

Abstract
A new, mechanically stable silica microparticle with macro-sized internal pores (1.6-μm particles with 100-nm pores) has been developed for chromatography. The particles are characterized by an extensive network of interconnected macropores with a high intraparticle void volume as observed by transmission electron microscopy (TEM). They are synthesized by an aerosol assembly technique called ultrasonic spray pyrolysis (USP). The particles have a high surface area for a macroporous material, ~200 m2/g, making them suitable for large biomolecular separations. To demonstrate their potential for bioseparations, they have been functionalized with lectins for affinity enrichment of glycoproteins. The material was derivatized with two lectins, Concanavalin A (Con A) and Aleuria aurantia lectin (AAL), and binding properties were tested with standard glycoproteins. The columns exhibited excellent binding capacities for microaffinity enrichment—Con A was able to bind 75 μg of a standard glycoprotein in a 50 × 1-mm column. Following initial tests, the lectin microcolumns were utilized for enrichment of glycoproteins from 1-μL volumes of blood serum samples, which was performed in triplicate for each lectin. The enriched serum fractions were subjected to side-by-side glycomic and glycoproteomic profiling analyses with mass spectrometry to show that the new particles offer excellent sensitivity for microscale analyses of precious biological sample materials. The unique combination of the macroporous architecture and small particle diameter suggests the material may have advantages for conventional modes of chromatographic separation of macromolecules in an ultrahigh-pressure liquid chromatography (UHPLC) format.
Introduction
Advances in separation science, in general, and high-performance liquid chromatography (HPLC), in particular, are often related to new types of sorption materials, their particle sizes and pore structure, and for the benefits of separation selectivity, to the chemical properties that can be imparted to the surfaces of these supports. Among the wide range of sorption materials used in analytical chromatography, silica-based columns have been popular due to their rigidity at high column pressures and the chemical versatility of silica, which facilitates incorporation of a variety of structures onto its surface through the modification of silanol groups.
Surface porosity of silica-based chromatographic columns is also an important consideration in the separation of molecules small and large. In recent years, this has led to the development of silica-based monolithic columns1–3, featuring large and small pores together, as well as small particles (sub 2-μm) with a solid core and porous external layer4–6. The porous, pelicular layers of these core-shell particles typically have pore sizes less than 400 Å. Very recently, new sphere-on-sphere particles with a “raspberry-like” surface morphology were reported7 as yet another alternative in separation science. With the new trend of using sub-2-μm particles packed into small-diameter columns leading to UHPLC8, different column alternatives must be kinetically evaluated in terms of separation efficiency, time needed for separation, and the pressure gradients required to achieve the necessary column performance.
In this report, we describe for the first time the chromatographic properties of a new type of sorption material with very unusual structural features. This material is represented by a spherical silica particle, less than 2 μm, containing an interconnected network of macropores. It has been synthesized through a novel ultrasonic spray pyrolysis (USP) process9. As a result of their unique structure, these particles offer the highest reported surface area for a macroporous chromatographic material to date. Yet, these particles remain rigid under high pressures that are compatible with state-of-the-art LC instrumentation. While the evaluations for different separation modes are underway in our laboratories, this communication highlights one particular feature of this novel material: its very high surface area allows a high density of ligands to be immobilized for the sake of affinity chromatography. We have chosen lectin affinity chromatography here to demonstrate the expected increase in column binding capacity and its correlation with the surface density of immobilized lectin. Additionally, while evaluating the performance of the lectin microcolumns, we observed an apparent correlation between lectin density and the extent of analyte retardation, which could result from an increased frequency of multivalent binding events10.
Lectins are a unique class of proteins that exhibit affinity for carbohydrates. They offer relatively weak binding (Kd ~ 10−4–10−7 M) compared to other affinity ligands such as commercial antibodies (Kd ~ 10−9 M), but because of their carbohydrate specificities, they are eminently suited for glycoproteomic investigations, such as the cases where altered glycosylation has been measured due to a human disease, and the respective glycoproteins (aberrantly glycosylated) must subsequently be identified11.
In this communication, we demonstrate lectin affinity chromatography using Con A and AAL as examples. The binding capacity and specificities have been tested using standard glycoproteins. In addition, human blood serum and its immunodepleted form were applied to the lectin microcolumns to demonstrate their practical utility in modern glycomic and glycoproteomic investigations11,12. Utilizing a mere one-microliter volume of serum, we demonstrate collection of lectin-enriched fractions of glycoproteins for their subsequent analysis by mass spectrometry (MS).
Materials and Methods
Reagents and Materials
Synthesis of Macroporous SiO2 Microspheres
Macroporous SiO2 was synthesized by USP as previously reported9. Briefly, 1.293g of LiNO3 (0.01875 mol) was dissolved in 13.6482 mL of H2O. The LiNO3 solution was added to 2.253g of 40% by weight SiO2 Snowtex-ZL (0.015 mol) and briefly sonicated (~30 sec) to ensure dispersion. The precursor solution was sparged at room temperature with N2 gas (99.0%) at a flow rate of 210 mL/min for 30 min and then nebulized into a quartz furnace tube under a steady stream of N2 (210 mL/min). The furnace temperature was set to 500 °C. The product particles were collected post-furnace in 3 water-filled bubblers containing 200 mL of water each. Products were washed with water, centrifuged at 15,000 rpm, and the supernatant removed to extract the salt template. This washing procedure was done twice. Sonication was used to help fully disperse the product.
NaOH Treatment of SiO2 Microspheres
Covalent Attachment of Lectins to Silica Particles
Packing Lectin Microcolumns
A packing reservoir was filled with a 50/50 slurry of silica in 20 mM phosphate buffer, 150 mM NaCl, pH 7.4. The reservoir was attached to an Äkta Purifier 900 fast protein liquid chromatograph (FPLC). A PEEK column, 50 × 1.0 mm, was attached downstream of the packing reservoir with a 0.2-μm stainless steel mesh frit at the bottom of the column. Pressure-driven flow at a rate of 100 μL/min was used to pack the lectin silica slurry into the PEEK microcolumn. As pressure increased, the flow rate was gradually reduced to 20 μL/min, and packing was allowed to proceed until the pressure stabilized at this flow rate. The column was detached from the packing reservoir, and a second frit was then used to cap the end through which the column was filled with lectin-modified silica.
Lectin Affinity Chromatography Experiments
All lectin affinity chromatography experiments were performed with an Äkta Purifier 900 FPLC. For the Con A microcolumns, the binding buffer was 20 mM phosphate in 150 mM NaCl, pH 7.4, with 0.02% azide. The elution buffer was 100 mM methyl α-D-mannopyranoside in binding buffer, except for chromatogram E in Fig. 3 (seen below) where the elution buffer was 200 mM methyl α-D-mannopyranoside in binding buffer. For the AAL microcolumn, the binding buffer was the same as with Con A, but the elution buffer was 100 mM L-fucose in binding buffer. All samples were loaded in 100 μL, which was the volume of the sample loop. Enrichment experiments were performed in three stages: binding, elution, and reequilibration. During the binding stage, injected samples were driven through the column in binding buffer at a flow rate of 10 μL/min for 60 min, during which time unbound sample components were washed from the column. Next elution was performed by applying elution buffer at 20 μL/min for 20 min. Finally, the columns were reequilibrated in binding buffer at 20 μL/min for 80 min. During binding and elution, fractions were either collected manually or in an automated fashion using the peak detection algorithm in the Unicorn software v4.00 that controlled the FPLC system. Fractions were collected in 10,000 molecular weight cut-off spin filters, then buffer-exchanged from binding or elution buffer to 20 μL of 10 mM phosphate buffer, pH 7.4, and split into two 10-μL fractions, one for glycoproteomic analysis by LC-MS/MS and one for permethylation and glycomic profiling by MALDI-TOF/TOF-MS.
Figure 3.

Elution profiles for HRP captured on Con A-functionalized macroporous 1.6-μm silica particles. All samples were injected in 100 μL of binding buffer, 20 mM phosphate, 150 mM NaCl, 0.02% azide, pH 7.4. Beginning at volume = 0 mL, binding buffer was applied for capture and removal of bound and unbound sample components, respectively. The red tick at 0.6 mL marks when elution buffer was applied. The elution buffer was 100 mM methyl α-D-mannopyranoside in binding buffer for A–D. A) 5 μg HRP captured on Con A-silica that had not been treated with 0.1M NaOH prior to functionalization with 3-GPTMS. Both HRP and BSA peaks were magnified 10x for comparison to the peaks in B–E, which represent larger protein masses. B–D) Injections of B) 25 μg, C) 75 μg, and D) 125 μg of HRP on Con A-silica that had been treated with 0.1M NaOH prior to functionalization with 3-GPTMS. E) 75 μg of HRP injected on the same column as B–D, but eluted with 200 mM methyl α-D-mannopyranoside. The bound peak eluted after 430 μL of elution buffer was applied.
Permethylation and MALDI-TOF/TOF-MS of N-linked Glycans
Protein Denaturation, Reduction, Alkylation, and Trypsin Digestion
Liquid Chromatography-Mass Spectrometry Analysis of Proteins and Glycoproteins
Peptide Identification and Label-free Quantification
MS/MS fragmentation spectra were compiled into a candidate peaklist using the TurboRAW2MGF utility developed in-house13 and searched against the UniProt database release 14.0 (20,328 sequences), homo sapiens taxonomy, using the MASCOT v2.3 search engine. The following criteria were used: trypsin selected as the enzyme, 1 missed cleavage allowed from trypsin digestion, ± 0.02 Da tolerance for precursors, ± 0.8 Da for fragment peaks, +2 and +3 charges, carbamidomethylation of cysteine (fixed modification), oxidation of methionine (variable modification), ion score ≥ 30, expect ≤ 0.1, accept only bold red queries, rank 1 identifications, and a minimum peptide mass of 600.00 Da.
A label-free quantitative approach was used to measure the relative abundance of identified proteins as a function of the confidently identified peptides as described previously13. Briefly, ProteinQuant Suite, an in-house developed software tool was utilized to reconstruct extracted ion chromatograms (EIC) for precursor m/z values (± 0.02 Da) that were confidently identified as peptides through fragmentation spectral searches of the UniProt database. To ensure that extracted EICs for the same peptides were integrated to generate relative quantitative data, proteins in each serum sample were quantified using a compiled master file of all identified peptides. MS files in the RAW format were converted to the universal mzXML format. For each peptide, the peak apex was then automatically set by searching for the maximum signal intensity within a 5-min window of the retention time for the precursor scan that was stored by MASCOT. Finally, peak edges were defined by the points where the signal intensity dropped to less than three times the baseline intensity, with a further constraint that the peak width could not exceed 1 min. Peak areas were then calculated by numeric integration. For each protein reported, the protein area is a sum of the peptide areas.
RESULTS and DISCUSSION
Macroporous Silica Particles
The particles are silicon dioxide spheres with a mean diameter of 1.6 ± 0.3 μm. They contain an extensive network of interconnected pores with a wide size distribution (Fig. 1). Most of the pores are between 50–150 nm in size (Figures 1 and S1A). TEM images like that shown in Fig. 1B indicate that the particles exhibit high porosity throughout. The surface area of the material, determined by 3-point Brunauer-Emmet-Teller (BET) analysis of the N2 adsorption isotherm, is 203 m2/g (Fig. 1C). Highly porous materials have the potential to be less mechanically stable than those with low porosity, especially at the pressures necessitated for high- and ultrahigh-pressure liquid chromatography (HPLC and UHPLC), which are now routinely used at pressures of 10,000 psi or more. In the absence of an available UHPLC or other precision pressurizing equipment, the particles were pressure-tested using a piston cylinder pump14 that applied a continuous pressure of 11,000 psi for 12 h and a gradient pressure from 11,000 to 8000 psi for a further 12-h period. SEM imaging of the pressure-tested particles revealed they had excellent mechanical stability and were therefore appropriate for high-pressure applications (Fig. S2A).
Figure 1.
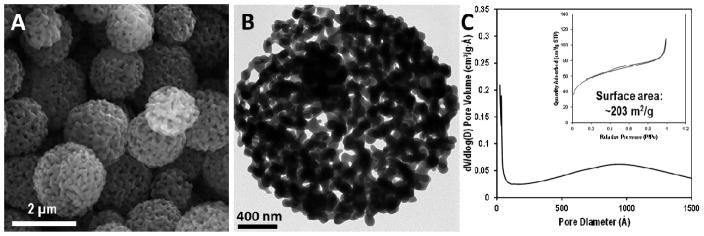
A) Scanning electron micrograph and B) transmission electron micrograph images of silica particles synthesized by ultrasonic spray pyrolysis/drying using salts as a pore template. C) Corresponding N2 adsorption-desorption isotherms of the particles (Inset: Pore size distributions obtained from BJH analysis of the same samples. Surface area based on 3-point BET analysis is also denoted.).
Binding Properties of Con A and AAL Microcolumns
The amount of Con A covalently attached to the silica particles was monitored by bicinchoninic acid (BCA) protein assay. The initial lectin solution concentration at the time of coupling was compared to the concentration when binding was terminated, and the difference was used to estimate the amount of lectin bound to the silica particles. It was determined that 1.6 mg of Con A was bound to 100 mg of silica, or approximately 16 mg Con A per gram of silica. This was considerably lower than was expected, based on our previous work, in which 50–60 mg of Con A was immobilized per gram of silica particles (10-μm diameter, 100-nm pores)15. It suggested that a considerable portion of the surface area may have been insufficiently hydroxylated prior to functionalization with GPTMS. Furthermore, the particles were synthesized at 500 °C, and it is well known that high temperatures can significantly reduce the surface concentration of silanols16,17. To increase the extent of surface hydroxylation, the particles were very briefly washed in 0.1 M NaOH, then washed with copious amounts of water. As the SEM images in Fig. S1 show, the silica treated with 0.1 M NaOH had an altered morphology, as a portion of the surface had been etched away from the original material, which had the intrinsic effect of increasing the mean pore size. The surface area was also decreased from 203 to 188 m2/g. It was expected that the correspondingly larger pores could increase the bulk transport of liquid through the particles as previously described18,19, thereby enhancing the transport of biological macromolecules through the particles20 and thus increasing the accessibility of the surface area for affinity capture. The mechanical stability of the particles after NaOH treatment was tested using the piston cylinder pump high pressure test as before with the untreated particles, i.e. the material was subjected to a constant pressure of 11,000 psi followed by a gradient from 11,000 to 8000 psi, and they were also unaffected. An SEM image of the NaOH particles after pressure testing is shown in Fig. S2B. Lectin coupling was subsequently performed using the NaOH-treated silica. The BCA protein assay was used to approximate that 4.0 mg of Con A was bound to 100 mg of the NaOH-treated particles, representing a substantial increase compared to the untreated material. However, it is expected that still more lectin may be bound to the material through further optimization.
It is well known that Concanavalin A has affinity for α-linked mannose residues21,22. The binding capacity of the Con A column was tested with horseradish peroxidase (HRP), which exhibits a series of N-glycans with terminal α-linked mannose23. Two 1.0 × 50-mm (40 μL) Con A-silica columns—one containing lectin coupled to the unmodified silica particles and the other containing lectin coupled to the NaOH-treated particles—were tested for their binding capacity with HRP. Triplicate injections were performed at each amount to demonstrate the quantitative repeatability of the enrichment experiments. During the binding phase, the columns were washed with 600 μL of binding buffer, i.e. 15 column volumes, prior to application of the elution buffer, to ensure that unbound species were removed. The maximum capacity of the Con A-untreated silica column was between 15 and 20 μg of HRP, as seen in Fig. 2. This represents a marked improvement for a Con A-silica microcolumn compared to a previous report from our laboratory15, which is one of the only previous quantitative characterizations of microscale lectin affinity in the literature. In that work, a Con A-silica column fabricated with 10-μm particles was able to bind between 100 and 200 ng of the standard glycoprotein, ribonuclease B, which exhibits a series of high-mannose glycans. Yet more strikingly, the Con A-NaOH-treated silica column described herein was able to reproducibly bind 75 μg of HRP.
Figure 2.

Binding capacity of lectin microcolumns fabricated with the novel macroporous silica particles. Triplicate injections were made at each mass of standard glycoprotein. A) HRP captured on a Con A column created with NaOH-untreated silica (blue diamonds) and on a Con A column created with NaOH-treated silica (red triangles). B) AGP captured on an AAL column created with NaOH-untreated silica. The binding capacities for each of the three columns, as measured under the chromatographic conditions specified in the Materials and Methods section, are labeled.
A further difference between the two Con A columns created with the new silica material was observed with regard to their elution properties. The chromatographic profiles of the column not treated with NaOH showed that, following the application of elution buffer, 100 mM methyl α-D-mannopyranoside, there was a 150-μL delay before the bound horseradish peroxidase (HRP) eluted. The column created using NaOH-treated silica retained the bound HRP for 510 μL after elution buffer was first applied—a delay of 360 μL relative to the untreated silica column. Different amounts of HRP were injected, and for each the strongly bound peak eluted after the same volume (Fig. 3, chromatograms B-D). The NaOH-treated silica column was additionally tested with a more concentrated elution buffer, 200 mM methyl α-D-mannopyranoside, and the bound HRP eluted 80 μL earlier than with the 100 mM elution buffer. For each of these columns, a sample of bovine serum albumin was injected to demonstrate that an unbound protein (BSA is not captured by Con A) eluted after the same volume from each, with the leading edge appearing after 55 and 60 μL for the columns packed with untreated and NaOH-treated silica, respectively. This data appears to indicate that the high density of lectin, immobilized on the NaOH-treated surface can provide enhanced retardation of glycoconjugates by maximizing the density of immobilized lectin as well as the proximity of the glycoconjugates to lectin-coated surfaces24 through the large pore sizes and the small interparticle-interstitial spaces that result from packing the small-diameter particles20. As a result of the enhanced avidity that is observed with a high lectin density, we have considered that the novel particles may facilitate the exploitation of lectins and other classes of affinity ligands with lower specificities (i.e. larger Kd-values) in affinity capture experiments due to the density and spatial orientation of the molecules when they are immobilized on the support. While the remaining results for both the Con A and AAL columns reported herein were collected with the untreated material, the substantial increase in binding capacity and the apparent increase in retardation following the NaOH treatment has prompted further endeavors to optimize the surface for use in chromatographic applications.
The AAL was immobilized on the support material using an alternative approach. A 2-mg aliquot of biotinylated AAL was coupled to 100 mg of avidinylated silica particles, providing a surface density of 20 mg AAL per gram of silica. This alternative immobilization method demonstrates how the silica particles may be functionalized by various coupling schemes. AAL has specifity for α-linked fucose residues25,26 As such, the capacity of the AAL column was tested with human α-1-acid glycoprotein (AGP), which exhibits a series of complex fucosylated glycans27. Binding was tested by triplicate injections over the range of 1 to 30 μg of AGP, and the column was able to reproducibly bind nearly 20 μg without the appearance of an appreciable flow-through peak. The column was able to bind more AGP if more was injected, but above 20 μg, a flow-through peak was observed, indicating that the AAL-coated surface was nearing its binding saturation (Fig. 2).
Glycomic and Glycoproteomic Profiling of Human Blood Serum
Lectin affinity chromatography is frequently used in biomedical applications such as glycomic and glycoproteomic investigations of disease. Due to the complexity of most biological fluids and tissues, preconcentration of the target sample components is necessary to achieve adequate sensitivity to characterize low-abundance glycoanalytes, which are otherwise masked by ionic suppression during the electrospray process in LC-MS28. The microcolumns fabricated with the novel silica material were therefore tested in the context of glycomic and glycoproteomic analyses of a biological sample mixture using mass-spectrometric detection as a proof-of-principle evaluation.
The Con A column was evaluated with a mere 1-μL aliquot of blood serum that had been diluted 100-fold prior to injection and filtered through a 0.22-μm particle filter. To the best of our knowledge, no comparable enrichment experiments have been reported in the literature utilizing such a low volume of biological sample for lectin enrichment prior to glycoproteomic and glycomic analyses by mass spectrometry. The enrichments were performed in triplicate, and the overlaid chromatograms for the capture of serum glycoproteins are shown in Fig. S3A. Two fractions were collected for the Con A-bound (CB) and Con A-unbound (CU) serum proteins. Both fractions were then subjected to a bottom-up proteomic experiment by LC-MS/MS, followed by a label-free quantitative comparison facilitated by ProteinQuant13. The quantified glycoproteins in the CB fraction are reported in Table S1 along with their affinity ratios (CB/CU). The most abundant protein in the CB fraction was serotransferrin, which increased in relative signal from 7.0% in CU to 23.5% in CB. The CB fraction was enriched with several major serum glycoproteins, including serotransferrin, haptoglobin, and ceruloplasmin, which had Con A affinity ratios of 3.34, 5.62, and 6.73, respectively. Four of the quantified proteins had affinity ratios > 10: hemopexin, 11.78; α-1-acid glycoprotein 2, 13.26; zinc-α-2-glycoprotein, 16.96, and corticosteroid-binding globulin, 39.11. A relative quantitative comparison of the proteins enriched by Con A is available in Fig. S4.
The glycomic profile of a CB fraction was measured to identify the glycans expressed on the serum proteins enriched by Con A. Although only a single microliter of blood serum was applied to the Con A microcolumn, a high sample recovery and preconcentration of the enriched glycoproteins facilitated glycomic profiling with the sensitive permethylation procedure previously described29,30. The structures identified were primarily biantennary complex glycans. The affinity of the highly abundant serum glycoprotein, serotransferrin, for Con A, provided a likely explanation for the dominant biantennary disialylated glycan at m/z 2792 in the mass spectrum shown in Fig. 5A, as this is the most abundant glycan expressed on serotransferrin31. The majority of the complex glycans were biantennary, with only five triantennary and zero tetraantennary structures identified. This observation was in contrast with the detection of several multiantennary glycans following enrichment with AAL, as described below.
Figure 5.


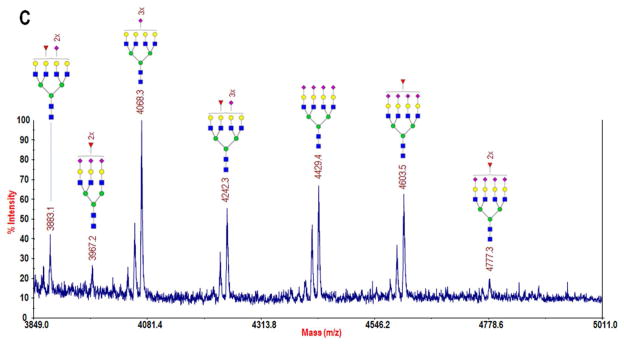
MALDI-TOF/TOF-MS profiles of permethylated N-glycans collected from lectin-enriched serum fractions: A) the bound fraction following Con A-enrichment of glycoproteins from a 1-μL sample of whole blood serum, B) the strongly bound fraction from AAL-enrichment of 40 μg of albumin- and IgG-depleted serum, and C) a zoomed region of B in which several highly branched complex glycans were identified, including two difucosylated structures. Monosaccharide symbols: blue square, N-acetylglucosamine; green circle, mannose; yellow circle, galactose; purple diamond, N-acetylneuraminic acid; and red triangle, fucose. (Note: Glycans in B and C were reduced prior to permethylation, resulting in a +16 m/z shift with respect to A. See Experimental section for details of reduction.)
The AAL column was used to enrich glycoproteins from a sample of 40 μg of human blood serum proteins that was previously depleted of serum albumin and IgG. This mass is reflective of the remaining protein content in a 1-μL aliquot of blood following removal of albumin and IgG. Fig. S3B demonstrates the chromatograms obtained for enrichment of serum glycoproteins with AAL. Proteins fractionated by the AAL column were collected in three separate segments: those that eluted after the application of < 5 column volumes of binding buffer were termed AAL-unbound (AU); those that eluted after the application of 5 column volumes of binding buffer were termed AAL-weakly bound (AWB), and those that did not elute until application of the elution buffer containing a competing affinity ligand, 100 mM L-fucose, were called AAL-strongly bound (ASB). Bottom-up proteomic experiments were performed to characterize the enrichment profile of glycoproteins, as with the Con A column. The glycoprotein signals spanned more than 5 orders of magnitude (Fig. 4). Enrichment factors for quantified glycoproteins are listed in Table S2. Fourteen glycoproteins, including the individually identified immunoglobulin chains, had AAL affinity ratios (AS/AU) > 10: angiotensinogen, 10.55; antithrombin-III, 10.62; complement C4-A, 11.12; β-2-glycoprotein 1, 12.32; Ig κ chain V-III region SIE, 13.26; complement C3, 13.45; Ig κ chain C region, 14.18; Ig λ-1 chain C regions, 14.64; α-1-acid glycoprotein, 15.63; leucine-rich α-2-glycoprotein, 19.30; haptoglobin, 20.34; apolipoprotein A-II, 23.28; apolipoprotein C-III, 30.43; and Ig α-1 chain C region, 33.47.
Figure 4.

A quantitative label-free comparison of the signal from each protein identified through bottom-up proteomic analysis by LC-FTMS of three fractions collected during AAL enrichment of human blood serum that was previously immunodepleted of albumin and IgG. The three fractions were unbound, weakly bound, and strongly bound, as labeled on the chromatograms in the supplemental information (Fig. S3B).
The glycomic profile of the ASB fraction is shown in Fig. 5B-C. From a comparison of the m/z range 1499–5017 to that of Con A, Fig. 4A and 4B, it may be seen that the ASB fraction contained more glycoproteins that express multiantennary glycans. Eight triantennary and eight tetraantennary structures were identified, and of the sixteen total, eight were fucosylated, including two difucosylated structures at m/z 3967 and 4777. These two structures have not been routinely observed in whole blood serum glycomic profiling, though they were identified in a previous investigation of serum from prostate cancer patients32, and they have also more recently been measured in a study of fucosylation of haptoglobin immunopurified from serum of pancreatic cancer patients33. This data demonstrates that, by targeting fucosylated glycoproteins, we were able to measure several of the more highly-branched, lower-abundance glycans in a very small volume of serum. Glycomic profiling following lectin enrichment is not commonly reported in the literature. By extracting these large N-glycans, which have been frequently associated with different types of cancer34, and performing side-by-side glycoproteomic profiling, we have confirmed the subgroup of glycoproteins on which they reside, including the two difucosylated structures that are typically not visible in non-cancerous sera. The enhanced sensitivity for detection of these structures that may be achieved with AAL enrichment utilizing the novel silica material will allow for quantitative characterization of their abundance in biomedical studies and thus allow us to delve deeper into the serum glycome. It is further possible that, by utilizing different lectins, such as Lycopersicon esculetum (tomato) lectin (LEL), which has specificity for beta lactosamine extensions35 that are also strongly linked with cancer11,36, we could extract other serum glycans that have been, until now, masked in the profiling experiments of the whole serum.
The achieved sensitivity using single-microliter sample volumes for lectin affinity chromatography is attributable to the high surface area provided by the new macroporous silica particles. In addition to this important property, the combination of characteristics, including high mechanical stability, macroporosity and UHPLC-sized particles is rare, if not unique to this particular material. The potential impact of the pore structure on the mass transfer kinetics and analyte dispersion is currently being investigated. Likewise, performance evaluations of the material for biomolecular separations with common modes of chromatography such as size-exclusion and reversed-phase are also underway.
CONCLUSION
A unique silica material has been utilized to fabricate lectin affinity chromatography columns for microscale enrichment of glycoproteins. The silica particles have a high porosity, they are porous throughout, and they have an apparently high degree of pore interconnectivity, resulting in a “mesh-like” architecture. The particles are 1.6 μm in diameter, similar to the current state-of-the-art materials used in UHPLC columns, which are 1.7 μm. Within this size regime, they are further distinguished from other siliceous materials by the predominance of macropores. It appears that modifications to the surface can enhance the coverage of the particles with the desired stationary phase. Through a series of experiments with standard glycoproteins and single-microliter volumes of blood serum samples, the application of the lectin microcolumns for highly sensitive glycomic and quantitative glycoproteomic profiling have been demonstrated. The apparent increase in binding affinity correlating with a high density of immobilized lectin could allow us to exploit weaker affinity relationships that offer unique specificities. Further development and characterization of this unique material is ongoing, and its application to various modes of separation will be the subject of future investigations. The material shows excellent promise for biomolecular chromatography applications, owing to its rigidity, high surface area, large pores, and small particle diameters.
Supplementary Material
Acknowledgments
We acknowledge financial support from the National Institute of General Medical Sciences R01-GM024349, the National Cancer Institute U01-CA128535, the Indiana Clinical and Translational Sciences Institute, funded in part by grant UL1 RR 02576 from the National Institutes of Health, National Center for Research Resources, and NSF CAREER DMR-0955028. The authors would also like to thank Prof. James G. Brophy of the Department of Geological Sciences at Indiana University-Bloomington for assistance with pressure-testing of the SiO2 particles.
References
- 1.Ishizuka N, Minakuchi H, Nakanishi K, Soga N, Nagayama H, Hosoya K, Tanaka N. Anal Chem. 2000;72(6):1275–80. doi: 10.1021/ac990942q. [DOI] [PubMed] [Google Scholar]
- 2.Tanaka N, Kobayashi H, Ishizuka N, Minakuchi H, Nakanishi K, Hosoya K, Ikegami T. J Chromatogr A. 2002;965(1–2):35–49. doi: 10.1016/s0021-9673(01)01582-5. [DOI] [PubMed] [Google Scholar]
- 3.Cabrera K. J Sep Sci. 2004;27(10–11):843–52. doi: 10.1002/jssc.200401827. [DOI] [PubMed] [Google Scholar]
- 4.Kirkland JJ. Anal Chem. 1992;64(11):1239–1245. [Google Scholar]
- 5.Kirkland JJ, Truszkowski FA, Dilks CH, Jr, Engel GS. J Chromatogr A. 2000;890(1):3–13. doi: 10.1016/s0021-9673(00)00392-7. [DOI] [PubMed] [Google Scholar]
- 6.McCalley DV. J Chrom A. 2008;1193(1–2):85–91. doi: 10.1016/j.chroma.2008.04.007. [DOI] [PubMed] [Google Scholar]
- 7.Ahmed A, Ritchie H, Myers P, Zhang H. Adv Mater. 2012 doi: 10.1002/adma.201202810. [DOI] [PubMed] [Google Scholar]
- 8.Jorgenson JW. Annu Rev Anal Chem. 2010;3:129–150. doi: 10.1146/annurev.anchem.1.031207.113014. [DOI] [PubMed] [Google Scholar]
- 9.Peterson AK, Morgan DG, Skrabalak SE. Langmuir. 2010;26(11):8804–9. doi: 10.1021/la904549t. [DOI] [PubMed] [Google Scholar]
- 10.Gestwicki JE, Cairo CW, Strong LE, Oetjen KA, Kiessling LL. J Am Chem Soc. 2002;124(50):14922–33. doi: 10.1021/ja027184x. [DOI] [PubMed] [Google Scholar]
- 11.Mann BF, Goetz JA, House MG, Schmidt CM, Novotny MV. Mol Cell Proteomics. 2012 doi: 10.1074/mcp.M111.015792. [DOI] [PMC free article] [PubMed] [Google Scholar]
- 12.Alley WR, Jr, Vasseur JA, Goetz JA, Svoboda M, Mann BF, Matei DE, Menning N, Hussein A, Mechref Y, Novotny MV. J Proteome Res. 2012;11(4):2282–300. doi: 10.1021/pr201070k. [DOI] [PMC free article] [PubMed] [Google Scholar]
- 13.Mann B, Madera M, Sheng Q, Tang H, Mechref Y, Novotny MV. Rapid Commun Mass Spectrom. 2008;22(23):3823–34. doi: 10.1002/rcm.3781. [DOI] [PubMed] [Google Scholar]
- 14.Boyd FR, England JL. J Geophys Res. 1960;65(2):741–748. [Google Scholar]
- 15.Madera M, Mechref Y, Novotny MV. Anal Chem. 2005;77(13):4081–90. doi: 10.1021/ac050222l. [DOI] [PMC free article] [PubMed] [Google Scholar]
- 16.Snyder LR. Sep Sci. 1966;1(2–3):191–218. [Google Scholar]
- 17.Sunseri JD, Cooper WT, Dorsey JG. J Chromatogr A. 2003;1011(1–2):23–9. doi: 10.1016/s0021-9673(03)01070-7. [DOI] [PubMed] [Google Scholar]
- 18.Happel J. AIChE J. 1958;4(2):197–201. [Google Scholar]
- 19.Carta G, Jungbauer A. Protein Chromatography: Process Development and Scale-up. Wiley-VCH; Weinheim: 2010. [Google Scholar]
- 20.Afeyan NB, Gordon NF, Mazsaroff I, Varady L, Fulton SP, Yang YB, Regnier FE. J Chromatogr. 1990;519(1):1–29. doi: 10.1016/0021-9673(90)85132-f. [DOI] [PubMed] [Google Scholar]
- 21.Goldstein IJ, Hollerman CE, Merrick JM. Biochim Biophys Acta. 1965;97:68–76. doi: 10.1016/0304-4165(65)90270-9. [DOI] [PubMed] [Google Scholar]
- 22.Baenziger JU, Fiete D. J Biol Chem. 1979;254(7):2400–7. [PubMed] [Google Scholar]
- 23.Takahashi N, Lee KB, Nakagawa H, Tsukamoto Y, Masuda K, Lee YC. Anal Biochem. 1998;255(2):183–7. doi: 10.1006/abio.1997.2463. [DOI] [PubMed] [Google Scholar]
- 24.Cuatrecasas P. Annu Rev Biochem. 1971;40:259–78. doi: 10.1146/annurev.bi.40.070171.001355. [DOI] [PubMed] [Google Scholar]
- 25.Yamashita K, Kochibe N, Ohkura T, Ueda I, Kobata A. J Biol Chem. 1985;260(8):4688–93. [PubMed] [Google Scholar]
- 26.Matsumura K, Higashida K, Ishida H, Hata Y, Yamamoto K, Shigeta M, Mizuno-Horikawa Y, Wang X, Miyoshi E, Gu J, Taniguchi N. J Biol Chem. 2007;282(21):15700–8. doi: 10.1074/jbc.M701195200. [DOI] [PubMed] [Google Scholar]
- 27.Higai K, Aoki Y, Azuma Y, Matsumoto K. Biochim Biophys Acta. 2005;1725(1):128–35. doi: 10.1016/j.bbagen.2005.03.012. [DOI] [PubMed] [Google Scholar]
- 28.Enke CG. Anal Chem. 1997;69(23):4885–93. doi: 10.1021/ac970095w. [DOI] [PubMed] [Google Scholar]
- 29.Kang P, Mechref Y, Novotny MV. Rapid Commun Mass Spectrom. 2008;22(5):721–34. doi: 10.1002/rcm.3395. [DOI] [PubMed] [Google Scholar]
- 30.Alley WR, Jr, Madera M, Mechref Y, Novotny MV. Anal Chem. 2010;82(12):5095–106. doi: 10.1021/ac100131e. [DOI] [PMC free article] [PubMed] [Google Scholar]
- 31.Spik G, Bayard B, Fournet B, Strecker G, Bouquelet S, Montreuil J. FEBS Lett. 1975;50(3):296–9. doi: 10.1016/0014-5793(75)80513-8. [DOI] [PubMed] [Google Scholar]
- 32.Kyselova Z, Mechref Y, Al Bataineh MM, Dobrolecki LE, Hickey RJ, Vinson J, Sweeney CJ, Novotny MV. J Proteome Res. 2007;6(5):1822–32. doi: 10.1021/pr060664t. [DOI] [PMC free article] [PubMed] [Google Scholar]
- 33.Lin Z, Simeone DM, Anderson MA, Brand RE, Xie X, Shedden KA, Ruffin MT, Lubman DM. J Proteome Res. 2011;10(5):2602–11. doi: 10.1021/pr200102h. [DOI] [PMC free article] [PubMed] [Google Scholar]
- 34.Varki A. Essentials of Glycobiology. 2. Cold Spring Harbor Laboratory Press; Cold Spring Harbor, N.Y: 2009. [PubMed] [Google Scholar]
- 35.Merkle RK, Cummings RD. J Biol Chem. 1987;262(17):8179–89. [PubMed] [Google Scholar]
- 36.Kannagi R, Fukushi Y, Tachikawa T, Noda A, Shin S, Shigeta K, Hiraiwa N, Fukuda Y, Inamoto T, Hakomori S, Imura H. Cancer Res. 1986;46(5):2619–26. [PubMed] [Google Scholar]
Associated Data
This section collects any data citations, data availability statements, or supplementary materials included in this article.