

Abstract
An important challenge in medical diagnostics is to design all-in-one contrast agents that can be detected with multiple techniques such as magnetic resonance imaging (MRI), X-ray computed tomography (CT), positron emission tomography (PET), single photon emission tomography (SPECT) or fluorescence imaging (FI). Although many dual labeled agents have been proposed, mainly for combined MRI/FI, constructs for three imaging modalities are scarce. Here gold/silica nanoparticles with a poly(ethylene glycol), paramagnetic and fluorescent lipid coating were synthesized, characterized and applied as trimodal contrast agents to allow for nanoparticle-enhanced imaging of macrophage cells in vitro via MRI, CT and FI, and mice livers in vivo via MRI and CT. This agent can be a useful tool in a multitude of applications, including cell tracking and target-specific molecular imaging, and is a step in the direction of truly multi-modal imaging.
Keywords: molecular imaging, cellular uptake, MRI, CT, contrast agents, paramagnetic agents, fluorescent probes, trimodal probes, nanoparticles
1. INTRODUCTION
The development of nanoparticulate contrast agents for use in multimodality diagnostic imaging and therapy has been intensively pursued in recent years. An important challenge in probe development is to design contrast agents that can be detected with multiple techniques such as magnetic resonance imaging (MRI), X-ray computed tomography (CT), positron emission tomography (PET), single photon emission tomography (SPECT) or fluorescence imaging (FI) (1). Although many dual labeled agents have been proposed, mainly for combined MRI/FI (2–6), few constructs with more imaging modalities have been reported (7,8). MRI, CT and FI nevertheless exhibit complementary strengths in terms of spatial and temporal resolution, the possibility to generate contrast and sensitivity. For example, CT imaging renders 3D images of mainly hard tissue, such as bone, whereas MRI excels in generating 3D images with excellent soft tissue contrast. Fluorescence techniques (FI, plate readers, etc.) are highly complementary since they are much more sensitive and allow multiplex imaging. Bulte et al. have exemplified the usefulness of such multimodal imaging approaches in a recent study where they labeled cell containing biocompatible microcapsules with multimodal contrast agents to enable their visualization with CT, MRI and ultrasound imaging to allow monitoring of a potential treatment for type I diabetis mellitus (9). CT is an anatomical imaging technique of which the signal attenuation is proportional to agent concentration, while MRI is capable of generating three-dimensional anatomical images with exceptional soft tissue contrast, but it has limited potential to quantify contrast agent concentration. Optical techniques are highly sensitive, can visualize multiple species and are very fast, but can only be reliably applied to small organisms, like mice, because of the limited penetration depth of light. Therefore, the combination of these techniques can give quantifiable information of contrast agent accumulation, at different levels, which may prove valuable, especially in a preclinical setting, at developmental stages where the technology has not matured, and proper validation is still essential.
Here we present the synthesis, characterization, in vitro and in vivo application of a novel trimodal contrast agent for combined MRI, CT and FI. It comprises gold/silica particles with a near-infrared (NIR) fluorescent and paramagnetic lipid coating (Au-SiFluPaLCs). The electron-dense gold core enables its detection with CT (and ex vivo with transmission electron microscopy, TEM), while the paramagnetic lipids generate MR signal and the NIR dye allows FI.
2. RESULTS
Gold nanocrystals were grown to 66 ± 8 nm and coated with an ~11 nm silica shell through the polyvinylpyrrolidone (PVP) method to a 88 ± 9 nm average particle diameter (synthesis details can be found in the Supporting Information) (10,11). The silica surface was made hydrophobic (12) and coated with paramagnetic, dye-conjugated and PEGylated lipids (13). In Fig. 1(a) the lipid-coating synthesis procedure is shown schematically (lipid structure formulae in Fig. S1 of the Supporting Information). The hydrophobic gold/silica particles, paramagnetic Gd–DTPA–DSA [gadolinium diethylene triamine pentaacetic acid di(stearylamide)], fluorescent Cy5.5-PEG-DSPE [Cyanine5.5 conjugated 1,2-distearoyl-sn-glycero-3-phosphoethanolamine-N-[methoxy(poly(ethylene glycol))-2000] and PEG-DSPE amphiphiles were dissolved in chloroform and dropwise added to hot physiological buffer. The rapid evaporation of chloroform results in a micellar lipid coating of the hydrophobic gold/silica particles. The presence of this dense (PEGylated) lipid layer around the inorganic particle core renders aqueous dispersions of these particles very stable and results in shelf-lives of at least 3 months. Figure 1(b) shows a TEM image of the gold/silica particles, and the inset shows a negative stain TEM image of lipid-coated gold/silica particles. By use of negative stain TEM a hydrophobic layer of ~2 nm was found on the lipid-coated particles. Determination of their hydrodynamic diameter by laser-based dynamic light scattering (DLS) led to unreliable results (diameters smaller than the gold/silica core), which is ascribed to the high laser light absorbance of the gold core. Previously, however, we found that a lipid-coated, quantum dot containing silica nanoparticles had a 39 nm diameter as determined by TEM but exhibited a 58 nm hydrodynamic diameter (13). The hydrodynamic diameter for the lipid-coated gold/silica particles can thus be estimated to be ~108 nm, 20 nm larger than 88 ±9 nm. Absorption (black curve), emission (excited at λexc 660 nm; red curve) and excitation spectra (recorded at λem 710 nm; blue curve) of the trimodal particle dispersion (inset) were taken and are shown in Fig. 1(c). The NIR dye Cy5.5 was chosen to minimize re-absorption of the emission (λem max 698 nm) by the plasmon absorption band of the gold cores (λabs max 558 nm). In addition, the long emission wavelength of the Cy5.5 lies within the high transmission window of bio-tissue.
Figure 1.

(a) Schematic representation of the nanoparticle lipid coating procedure. (b) TEM image of hydrophobic gold/silica particles (88 ±9 nm). The inset shows a negative stain TEM image of the lipid-coated particles. (c) Absorption (black), emission (λexc 660 nm; red) and excitation (λem 710 nm; blue) spectra of the aqueous lipid-coated gold/silica particle dispersion (inset). Note that the dotted line in the emission spectrum is due to scattered excitation light and thus not due to Cy5.5 emission.
Next, the sensitivity of the nanoparticles for detection with NIR-FI, MRI and CT was determined. Dilution series were investigated respectively on a Xenogen IVIS-200 system using a Cy5.5 filter set, a 1.5 T MRI and a 110 keV CT clinical scanner. Concentration–signal curves, where gold and gadolinium concentrations were determined by inductively coupled plasma mass spectrometry (ICP-MS) analysis, and contrast images are shown in Fig. 2(a–c) (1 nM lipid-coated gold/silica particles =1.05 g l−1 or 5.3 pM Au =0.025 mM Gd). The increase in the fluorescence intensity is nonlinear due to re-absorption of emitted light at higher particle concentrations by the gold nanocrystal cores. The MRI and CT signal, however, increase linearly with particle concentration in the nanomolar regime. The ionic longitudinal relaxivity r1 of the gadolinium incorporated in the lipid layer was found to be 14.0 mM−1 s−1, which is in agreement with observed values for lipid-coated QD/silica nanoparticles [(13), 14.4 mM−1 s−1]. The total number of lipids/particle is 40 000, of which half carry Gd-DTPA, which results in a particulate relaxivity of 560 000 mM−1 s−1. For CT, the slope in the concentration–signal curve was found to be 23 HU (Hounsfield Units) per g gold l−1 solution which is similar to earlier reported values [(14), 25 HU per g l−1].
Figure 2.
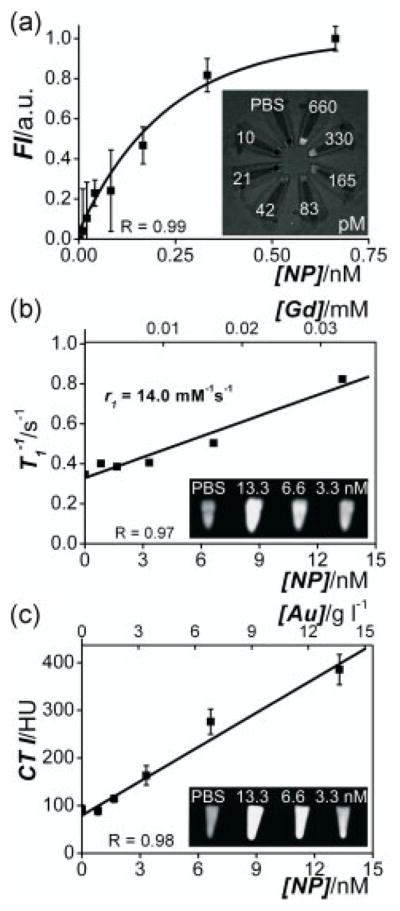
Concentration–signal curves of the lipid-coated gold/silica particles for (a) FI, (b) MRI and (c) CT. Note that both nanoparticle concentrations and the corresponding Gd and Au concentrations are given. The molar longitudinal relaxivity r1 of the gadolinium in the lipids was found to be 14.0 mM−1 s−1 and the slope in the CT curve was 23 HU per g gold l−1 solution. Insets show (a) FI, (b) MRI and (c) CT images of nanoparticle dilution series (concentrations indicated) revealing high sensitivity for all three imaging techniques.
The in vitro imaging potential of the trimodal contrast agent was tested by labeling murine macrophage J774A.1 cells (~1 ×10⁶). After establishing the concentrations and lengths of incubation conditions to generate appreciable contrast in viable cells through initial in vitro experiments, the cells were typically incubated for 24 h with 1.3 nM for confocal laser scanning microscopy (CLSM), MRI and CT. Figure 3(a) shows an overlay of a bright field image of the macrophages with blue fluorescence signal originating from cell nuclei (DAPI or 4′,6-diamidino-2-phenylindole stain) and red fluorescence from the Cy5.5-containing nanoparticles. MRI on a 9.4 Tscanner and CT at 110 keV show strong contrast enhancement for cell pellets (~1 ×10⁶ cells) that were incubated with the nanoparticles as compared with cell pellets of untreated macrophages (Fig. 3b, c).
Figure 3.
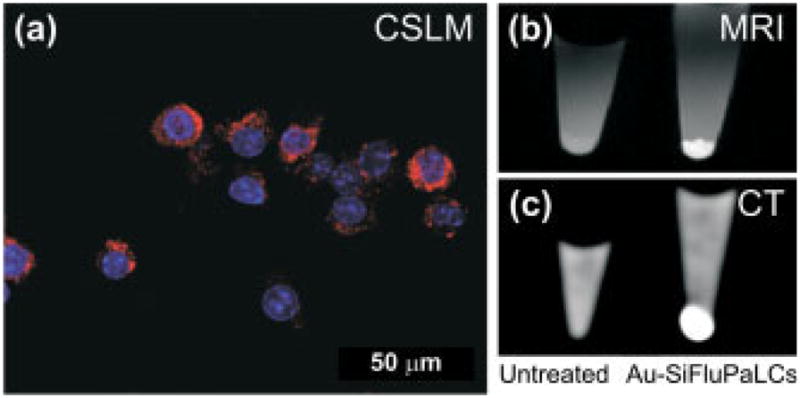
(a) Overlay of a bright field image of J774A.1 macrophages and CLSM images indicating nanoparticle uptake in the cytoplasm (red signal) and showing the cell nuclei (blue signal). (b) MRI and (c) CT images of untreated cells (left) and cells incubated with particles (right). The liquid above the cell pellets consists of an aqueous solution of 4% v/v para-formaldehyde.
Finally, in vivo MR and CT imaging of mice livers (n =2) was performed (Fig. 4). After baseline in vivo imaging, the lipid-coated gold/silica nanoparticles at a dose of 0.15 nmol kg−1 weight were intravenously administered. Post-injection imaging was carried out at 24 h. MR in vivo liver imaging was performed on a 9.4 T MRI scanner by collecting 2D images through the mouse abdomens (Fig. 4a). T1-weighted MR imaging of the livers showed a 24% mean intensity enhancement post nanoparticle injection, normalized to muscle MR signal. When in vivo CT images through the liver prior to (37.95 ±1.96 HU) and post (56.75 ±2.95 HU) nanoparticle administration are compared, a 50% mean X-ray attenuation increase post injection was observed (Fig. 4b). CT side views of the whole mouse body prior to and post particle administration also revealed an enhanced intensity of mice livers (Fig. 4c).
Figure 4.
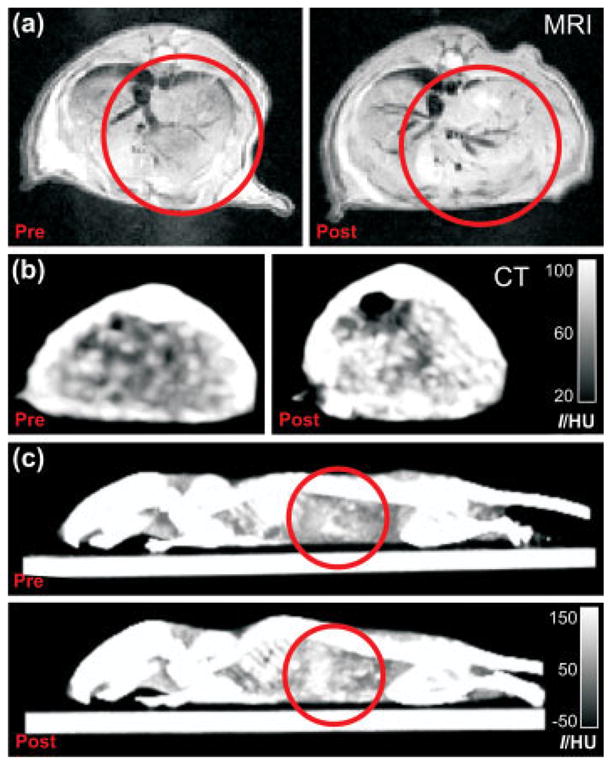
(a) MR and (b) CT images of mice abdomens prior to and 24 h post injection of the trimodal nanoparticles. (c) Side view 3D max intensity CT projections of the same mice as in (b). Red circles indicate regions with enhanced contrast.
3. DISCUSSION
Our results demonstrate that the trimodal nanoparticles effectively label phagocytotic cells and mice livers, which also contain a significant amount of phagocytotic cells as part of the reticuloendothelial system. The lipid-coated gold/silica particles served as high-quality contrast agents for MRI, CT and FI in vitro as well as for MR and CT in vivo multimodal imaging. The in vivo FI performance of this probe remains to be investigated, but based on the determined FI probe sensitivity in Fig. 2 it is expected that lower doses than the here applied particle dose of 0.15 nmol kg−1 would be suitable for in vivo FI. Such imaging should be feasible up to penetration depths of several millimeters, since the fluorescence wavelength of the Cy5.5 dye (λ =710 nm) lies in the near-infrared, the most light-transparent part of the spectrum for bio-tissue. For labeling of non-phagocytotic cells, transfection agents or electroporation techniques may be employed (15). In addition, the nanoparticle surface can be functionalized with small molecules or proteins that facilitate their uptake (16). The latter strategy can, for example, be applied to enable target-specific imaging of epitopes expressed in diseased tissue (17) upon intravenous nanoprobe administration. We previously demonstrated the possibility of such target-specific imaging through lipid-coated nanoparticles (3,13,18) and showed that the lipid layer highly improves the in vivo bio-applicability of silica-based nanoparticles (19).
It is further important to note that the here applied nanoparticle dose of 0.15 nmol kg−1 is very low due to the high payload of contrast generating material per nanoparticle. In earlier in vivo CT studies 30 ±10 nm square-like and 3–4 nm thick Bi2S3 nanoparticles were injected in doses corresponding to 57 μmol Bi3+ per mouse (20). Taking the Bi2S3 density to be 6.8 g ml−1, and using an average mouse weight of 25 g, the injected dose can be calculated to be 53 nmol kg−1. Also, for MRI studies the applied dose typically is a factor 100 higher than the here reported dose. For example polymer coated Gd2O3/silica nanoparticles have been applied for in vivo MRI with 2.5 μmol kg−1 gadolinium, corresponding to a nanoparticle dosis of 19 nmol kg−1 (4). In studies where Gd-labeled lipid nanoparticles were employed, the Gd dosing typically ranges from 5 to 100 μmol kg−1, corresponding for example to a nanoparticle dose of 57 nmol kg−1 for 6.5 ±0.08 nm quantum dots coated with a Gd-lipid containing high density lipoprotein surface coating (21). For 160 nm large Gd-lipid containing liposomes, nanoparticle doses corresponding to 60 nmol kg−1 are common, for example when used for murine tumor in vivo imaging (22). Again, in the current study the dosing was only 0.15 nmol kg−1 on a nanoparticle basis. Furthermore, the mentioned studies were not capable of combined MR and CT imaging, while the lipid-coated gold/silica particles generate in vivo contrast in both modalities using 100 times fewer nanoparticles kg−1. The potential beneficial effects of low administered doses of relatively large gold/silica nanoparticles on cytotoxicity remain to be assesed.
The build-up of this trimodal particle is such that the relative contrast for each of the modalities can be easily tuned. Increasing the gold core size, for example, enhances the CT contrast per particle. Changing the size of the gold core or thickness of the silica shell will alter the particle surface area and thus the included number of paramagnetic or fluorescent lipids. Varying the ratio between the different lipids is another tunable characteristic, while several fluorescent dyes may be conjugated, circumventing overlap of the fluorescence with the plasmon absorption (see Fig. S2 in the Supporting Information for gold particle, size-dependent absorption spectra). The desired relative CT, MRI, and FI signals originating from this nanoconstruct can therefore be optimized for different applications.
4. CONCLUSIONS
In conclusion, a trimodal nanoparticle was synthesized and shown to generate contrast in MRI, CT and FI with an approximately nanomolar (MRI/CT) and ~100 pM (FI) detection limit. The ionic longitudinal relaxivity r1 and the CT attenuation were found to be 14.0 mM−1 s−1 and 23 HU/(g l−1), respectively. Phagocytotic cell studies with MRI, CT and confocal microscopy demonstrate the successful uptake of and labeling with the nanoparticles. The material further served as efficient contrast agent for in vivo MR and CT imaging of mice livers. At doses as low as 0.15 nmol kg−1, MRI and CT in vivo signals were enhanced 24% and 50%, respectively. We envision a variety of applications for this agent, including cell tracking and target-specific molecular imaging.
5. EXPERIMENTAL PROCEDURES
5.1. Synthesis of hydrophobic gold/silica nanoparticles, Cy5.5-PEG-DSPE synthesis and lipid coating of hydrophobic particles
The chemistry of the synthesis of the here presented lipid-coated gold/silica nanoparticles is described extensively in the Supporting Information.
5.2. Cell culture and incubation of the nanoparticles
J774A.1 murine macrophage cells (ATCC, Manassas, VA, USA) were maintained in a culture medium consisting of DMEM fortified with 10% FBS, 100 U ml−1 penicillin and 100 μg ml−1 streptomycin and kept in a 5% CO2, humidified incubator at 37 °C. The cells were incubated for 24 h with 1.3 nM CLSM, MRI and CT. Before collecting and analyzing the cells, the medium was removed and the cells were washed three times with 1 × PBS to remove any non-internalized nanoparticles from solution. Cell pellets for MRI and CT were fixed with 4% v/v paraformaldehyde.
5.3. Animals
Wild-type mice (Jackson Laboratories, C57BL) were fed an ordinary chow diet and were 4 months old at the time of the experiments. The mice were anesthetized for the duration of the imaging experiments using 4% isoflurane in medical oxygen for induction and using a lowered dose of 2% isoflurane for maintaining anesthesia. The contrast agent was injected via the tail vein of these animals using a catheter. All mice were male and were housed and maintained at the Mount Sinai Animal Facility. The Mount Sinai School of Medicine Institute of Animal Care and Use Committee approved all experiments.
5.4. Transmission electron microscopy
Formvar-coated nickel grids were dipped in nanoparticle solutions and imaged on a Hitachi H7650 microscope linked to a Scientific Instruments and Applications digital camera controlled by Maxim CCD software. TEM images were processed using Tecnai Imaging and Analysis software. Negative stain TEM samples were prepared by exchanging the buffer for a 0.125 M ammonium acetate and 0.26 mM EDTA solution adjusted to pH 7.4 and then mixed in a 1:1 ratio with a 2% sodium phosphotung-state negative stain solution (pH 7.4).
5.5. Optical measurements
Absorption spectra were taken on a Beckman Coulter DU 730 UV–vis spectrophotometer. Emission spectra of the nanoparticles excited at λexc 660 nm were measured using the monochromator of a Spex Fluorolog spectrometer (double-grating, 0.22 m, SPEX 1680) and a 450 W Xe lamp as the excitation source. The luminescence spectra were recorded using a Princeton Instruments CCD-camera (liquid N2 cooled) and a 0.25 m Acton Research monochromator (150 lines mm−1 grating blazed at 500 nm). Excitation spectra, in which one measures the emission intensity at a fixed wavelength (in this case at λem 710 nm) as a function of the excitation wavelength, were recorded with the same setup, using the emission monochromator of the Spex Fluorolog spectrometer and a photomultiplier tube (PMT; Hamatsu, R928).
5.6. ICP-MS element analysis
Elemental analyses of gadolinium and gold concentrations in the nanoparticle solutions were done by inductively coupled plasma mass spectrometry against common standards (Cantest Ltd, Burnaby, Canada). The gold concentrations, together with the TEM-determined average gold particle diameters, the spherical approximation of gold nanocrystals and a density of ~18.9 g cm−3 for gold nanoparticles, were used to calculate the nanoparticle concentrations.
5.7. Fluorescence imaging
The sensitivity for FI was determined by exciting several dilutions of the nanoparticles (10, 21, 42, 83, 165, 330 and 660 pM) for 20 s on a Xenogen IVIS-200 system with a 150 W Quartz halogen lamp filtered by the Cy5.5 excitation band (615–665 nm), while the emission was quantitatively recorded using the Cy5.5 emission filter (695–770 nm).
5.8. Magnetic resonance imaging
MRI of 1 × PBS (control) and nanoparticle solutions (0.8, 1.7, 3.3, 6.6 and 13.3 nM) was performed on a 1.5 T Siemens Sonata clinical scanner at room temperature. A knee volume coil was used for imaging using an inversion recovery turbo spin-echo sequence where the echo time (TE) was 5.6 ms, the repetition time (TR) 5000 ms, the field of view (FOV) 12 ×12 cm and the matrix size 256 ×256. The inversion time was varied between 23 ms and 4870 ms. T1 values were determined from these images via three parameter fitting of the inversion recovery curve of data derived from regions of interest using MatLab R2007b (Natick, MA, USA). These values were converted to R1 values (proportional to Gd content) by dividing 1000 by T1 (ms).
MRI of cell pellets was performed at 9.4 T on a vertical bore magnet interfaced to a Bruker imaging console (Bruker, Biospec). A 3 cm quadrature-driven birdcage coil was used. The cell pellet-containing cups were placed in a custom-made sample holder, capable of carrying 2 Eppendorf cups. T1-weighted images of cell pellets (averages of eight images) were generated with a TE of 9.5 ms, a TR of 500 ms, a 2 × 2 cm FOV, and a 128 × 128 matrix size. In these images cells with a high Gd content appear brighter than cells with a low Gd content.
Mice (n =2) were imaged using the same 9.4 T system as described above. The liver was identified in a coronal section on a localizing sequence. T1-weighted MRI was performed using a black blood sequence. Ten contiguous 1 mm thick slices were acquired using a spin echo sequence with a 128 ×128 matrix size, a 3 mm FOV, a TE of 8.6 ms and a TR of 800 ms. An inflow saturation band of 3 mm was used with a slice gap of 3 mm for additional blood flow suppression. Sixteen signal averages were used for a total imaging time of 27 min per scan. A saturation pulse was used to eliminate signal from fat tissue and minimize chemical shift artifacts. After a pre-injection, baseline MRI scan, mice were injected with a dose of gold/silica lipid-coated nanoparticles equivalent to 2 μmol Gd kg−1 and 160 mg Au kg−1. The mice were scanned again at 24 h post-injection. The medical image analysis software package eFilm was used to process the data.
5.9. Computed tomography imaging
CT imaging of 1 × PBS (control) and nanoparticle solutions (0.8, 1.7, 3.3, 6.6 and 13.3 nM), and cell pellets (non-treated cells or cells incubated with the nanoparticles) were imaged on a Siemens Somatom Emotion 6 clinical scanner at 110 keV and 25 mA. The slice thickness was 0.63 mm, the FOV 50 × 50 mm, the matrix size 512 × 512 and the data were reconstructed using a B30f kernel. Images were analyzed using Osirix v. 3.0.1 32-bit.
For in vivo imaging, a Siemens Somatom 64-slice CT system was used. Mice (n =2) were imaged pre- and 24 h post-injection with the gold/silica lipid coated contrast agent. Images were acquired using 120 keV, 35 mA, 0.6 mm slice thickness, a matrix size of 512 × 512 and a 10 × 10 mm FOV. The data were reconstructed using a U40u kernel and analyzed using Osirix v. 3.0.1 32-bit.
5.10. Confocal laser scanning microscopy
Macrophage cells for CLSM were grown on coverslips placed at the bottom of wells plates. After incubation the coverslips were mounted on slides using a media containing DAPI and sealed. Imaging was performed on a Zeiss LSM 510 META microscope (Carl Zeiss, Jena, Germany) with a Plan-Neofluar 40 × (1.3 oil DIC) objective lens. Data were captured and analyzed using Zeiss LSM 510 Meta and Image Browser software (Zeiss).
Supplementary Material
Acknowledgments
This research was supported by NIH/NCI 5R24 CA095823-04, NSF DBI-9724504, NIH 1 S10 RR0 9145-01, NIH/NHLBI R01 HL71021 (Z.A.F.), Kf Hein Fonds and KWF Kankerbestrijding (M.M.V.S.). We thank the AHA Founder’s Affiliate for Postdoctoral Fellowship 09POST2220194 (D.P.C.).
Footnotes
Experimental details, lipid chemical structures and gold particle, size-dependent absorption spectra are available in the online version of this article.
References
- 1.Rudin M, Weissleder R. Molecular imaging in drug discovery and development. Nat Rev Drug Discov. 2003;2(2):123–131. doi: 10.1038/nrd1007. [DOI] [PubMed] [Google Scholar]
- 2.Frullano L, Meade T. Multimodal MRI contrast agents. J Biol Inorg Chem. 2007;12(7):939–949. doi: 10.1007/s00775-007-0265-3. [DOI] [PubMed] [Google Scholar]
- 3.Mulder WJM, Koole R, Brandwijk RJ, Storm G, Chin PTK, Strijkers GJ, Donega CD, Nicolay K, Griffioen AW. Quantum dots with a paramagnetic coating as a bimodal molecular imaging probe. Nano Lett. 2006;6(1):1–6. doi: 10.1021/nl051935m. [DOI] [PubMed] [Google Scholar]
- 4.Bridot J-L, Faure A-C, Laurent S, Riviere C, Billotey C, Hiba B, Janier M, Josserand V, Coll J-L, VanderElst L, Muller R, Roux S, Perriat P, Tillement O. Hybrid gadolinium oxide nanoparticles: multimodal contrast agents for in vivo imaging. J Am Chem Soc. 2007;129(16):5076–5084. doi: 10.1021/ja068356j. [DOI] [PubMed] [Google Scholar]
- 5.Lu CW, Hung Y, Hsiao JK, Yao M, Chung TH, Lin YS, Wu SH, Hsu SC, Liu HM, Mou CY, Yang CS, Huang DM, Chen YC. Bifunctional magnetic silica nanoparticles for highly efficient human stem cell labeling. Nano Lett. 2007;7(1):149–154. doi: 10.1021/nl0624263. [DOI] [PubMed] [Google Scholar]
- 6.McCarthy JR, Weissleder R. Multifunctional magnetic nanoparticles for targeted imaging and therapy. Adv Drug Deliv Rev. 2008;60(11):1241–1251. doi: 10.1016/j.addr.2008.03.014. [DOI] [PMC free article] [PubMed] [Google Scholar]
- 7.Santra S, Yang HS, Holloway PH, Stanley JT, Mericle RA. Synthesis of water-dispersible fluorescent, radio-opaque, and paramagnetic CdS:Mn/ZnS quantum dots: a multifunctional probe for bioimaging. J Am Chem Soc. 2005;127(6):1656–1657. doi: 10.1021/ja0464140. [DOI] [PubMed] [Google Scholar]
- 8.Nahrendorf M, Zhang H, Hembrador S, Panizzi P, Sosnovik DE, Aikawa E, Libby P, Swirski FK, Weissleder R. Nanoparticle PET-CT imaging of macrophages in inflammatory atherosclerosis. Circulation. 2008;117(3):379–387. doi: 10.1161/CIRCULATIONAHA.107.741181. [DOI] [PMC free article] [PubMed] [Google Scholar]
- 9.Arifin DR, Long C, Gilad AA, Manek S, Call E, Alric C, Roux S, Tillement O, Link TW, Arepally A, Bulte JWM. Novel trimodal gadolinium-gold microcapsules for simultaneous immunoprotection and positive contrast MRI, X-ray, and ultrasound imaging of human pancreatic islet cells. Proc Int Soc Magn Reson Med Sci Meet Exhib. 2009;17:526. [Google Scholar]
- 10.Graf C, Vossen DLJ, Imhof A, vanBlaaderen A. A general method to coat colloidal particles with silica. Langmuir. 2003;19(17):6693–6700. [Google Scholar]
- 11.Liu SH, Han MY. Synthesis, functionalization, and bioconjugation of monodisperse, silica-coated gold nanoparticles: robust bioprobes. Adv Funct Mater. 2005;15(6):961–967. [Google Scholar]
- 12.van Helden AK, Jansen JW, Vrij A. Preparation and characterization of spherical monodisperse silica dispersions in non-aqueous solvents. J Colloid Interface Sci. 1981;81(2):354–368. [Google Scholar]
- 13.Koole R, van Schooneveld MM, Hilhorst J, Castermans K, Cormode DP, Strijkers GJ, de Mello Donega C, Vanmaekelbergh D, Griffioen AW, Nicolay K, Fayad ZA, Meijerink A, Mulder WJM. Paramagnetic lipid-coated silica nanoparticles with a fluorescent quantum dot core: a new contrast agent platform for multimodality imaging. Bioconjug Chem. 2008;19(12):2471–2479. doi: 10.1021/bc800368x. [DOI] [PMC free article] [PubMed] [Google Scholar]
- 14.Kattumuri V, Katti K, Bhaskaran S, Boote EJ, Casteel SW, Fent GM, Robertson DJ, Chandrasekhar M, Kannan R, Katti KV. Gum arabic as a phytochemical construct for the stabilization of gold nanoparticles: in vivo pharmacokinetics and X-ray-contrast-imaging studies. Small. 2007;3(2):333–341. doi: 10.1002/smll.200600427. [DOI] [PubMed] [Google Scholar]
- 15.Bulte J. Intracellular endosomal magnetic labeling of cells. Meth Mol Med. 2006;124:419–439. doi: 10.1385/1-59745-010-3:419. [DOI] [PubMed] [Google Scholar]
- 16.Lewin M, Carlesso N, Tung C-H, Tang X-W, Cory D, Scadden DT, Weissleder R. Tat peptide-derivatized magnetic nanoparticles allow in vivo tracking and recovery of progenitor cells. Nat Biotechnol. 2000;18(4):410–414. doi: 10.1038/74464. [DOI] [PubMed] [Google Scholar]
- 17.Artemov D, Bhujwalla Z, Bulte J. Magnetic resonance imaging of cell surface receptors using targeted contrast agents. Curr Pharm Biotechnol. 2004;5(6):485–494. doi: 10.2174/1389201043376553. [DOI] [PubMed] [Google Scholar]
- 18.Koole R, van Schooneveld MM, Hilhorst J, de Mello Donega C, ’t Hart DC, van Blaaderen A, Vanmaekelbergh D, Meijerink A. On the incorporation mechanism of hydrophobic quantum dots in silica spheres by a reverse microemulsion method. Chem Mater. 2008;20(7):2503–2512. [Google Scholar]
- 19.van Schooneveld MM, Vucic E, Koole R, Zhou Y, Stocks J, Cormode DP, Tang CY, Gordon RE, Nicolay K, Meijerink A, Fayad ZA, Mulder WJM. Improved biocompatibility and pharmacokinetics of silica nanoparticles by means of a lipid coating: a multimodality investigation. Nano Lett. 2008;8(8):2517–2525. doi: 10.1021/nl801596a. [DOI] [PubMed] [Google Scholar]
- 20.Rabin O, Manuel Perez J, Grimm J, Wojtkiewicz G, Weissleder R. An X-ray computed tomography imaging agent based on long-circulating bismuth sulphide nanoparticles. Nat Mater. 2006;5(2):118–122. doi: 10.1038/nmat1571. [DOI] [PubMed] [Google Scholar]
- 21.Cormode DP, Skajaa T, van Schooneveld MM, Koole R, Jarzyna P, Lobatto ME, Calcagno C, Barazza A, Gordon RE, Zanzonico P, Fisher EA, Fayad ZA, Mulder WJM. Nanocrystal core high-density lipoproteins: a multimodality contrast agent platform. Nano Lett. 2008;8(11):3715–3723. doi: 10.1021/nl801958b. [DOI] [PMC free article] [PubMed] [Google Scholar]
- 22.Leclercq F, Cohen-Ohana M, Mignet N, Sbarbati A, Herscovici J, Scherman D, Byk G. Design, Synthesis, and evaluation of gadolinium cationic lipids as tools for biodistribution studies of gene delivery complexes. Bioconjug Chem. 2002;14(1):112–119. doi: 10.1021/bc025567e. [DOI] [PubMed] [Google Scholar]
Associated Data
This section collects any data citations, data availability statements, or supplementary materials included in this article.