Abstract
Purpose
To demonstrate the use of generalized equivalent uniform dose (gEUD) atlas for data pooling in radiation pneumonitis (RP) modeling, to determine the dependence of RP on gEUD, to study the consistency between data sets, and to verify the increased statistical power of the combination.
Methods and Materials
Patients enrolled in prospective phase I/II dose escalation studies of radiation therapy of non-small cell lung cancer at Memorial Sloan-Kettering Cancer Center (MSKCC) (78 pts) and the Netherlands Cancer Institute (NKI) (86 pts) were included; 10 (13%) and 14 (17%) experienced RP requiring steroids (RPS) within 6 months after treatment. gEUD was calculated from dose-volume histograms. Atlases for each data set were created using 1-Gy steps from exact gEUDs and RPS data. The Lyman-Kutcher-Burman model was fit to the atlas and exact gEUD data. Heterogeneity and inconsistency statistics for the fitted parameters were computed. gEUD maps of the probability of RPS rate ≥20% were plotted.
Results
The 2 data sets were homogeneous and consistent. The best fit values of the volume effect parameter a were small, with upper 95% confidence limit around 1.0 in the joint data. The likelihood profiles around the best fit a values were flat in all cases, making determination of the best fit a weak. All confidence intervals (CIs) were narrower in the joint than in the individual data sets. The minimum P value for correlations of gEUD with RPS in the joint data was .002, compared with P=.01 and .05 for MSKCC and NKI data sets, respectively. gEUD maps showed that at small a, RPS risk increases with gEUD.
Conclusions
The atlas can be used to combine gEUD and RPS information from different institutions and model gEUD dependence of RPS. RPS has a large volume effect with the mean dose model barely included in the 95% CI. Data pooling increased statistical power.
Introduction
Radiation pneumonitis (RP) is an extensively studied toxicity in lung cancer radiation therapy (1). However, the small numbers of cases per study limit the statistical power of prior investigations of the dose-volume dependencies of RP. Combining studies would address this (2–4). Unfortunately, published results do not allow for meta-analysis (2), with a few exceptions based on mean lung dose (MLD) (1, 5).
The generalized equivalent uniform dose (gEUD) describes volume effects by 1 parameter (a) (6). If a is determined by data fitting, and only the best fit gEUD response is published, responses with different a cannot be merged. The gEUD atlas is a platform for integrating individual data sets. It reports gEUD response statistics for a range of a’s, unlimited by the assumption of 1 value (7).
The purposes of this paper were to demonstrate the use of the gEUD atlas to combine prospective data from dose escalation protocols for non-small cell lung cancer (NSCLC) from Memorial Sloan-Kettering Cancer Center (MSKCC) and The Netherlands Cancer Institute – Antoni van Leeuwenhoek Hospital (NKI), to determine the best fit a and gEUD response of RP, to study the consistency between the individual data sets, and to verify that the combination increased statistical power.
Methods and Materials
Details of the prospective phase I/II dose escalation protocols for NSCLC radiation therapy conducted at MSKCC and NKI were extensively described previously (8–10). We summarize only the essentials here.
Protocols
The 104 MSKCC patients were medically inoperable; 16 had induction chemotherapy. Prescription doses were 70.2 Gy, 75.6 Gy, and 81 Gy, in 1.8-Gy daily fractions, 5 days per week. Beyond 81 Gy, 2-Gy fractions were used. For stage T1–T2, N0 tumors, the highest dose was 90 Gy, and for higher-stage tumors it was 84 Gy.
The NKI patients were medically inoperable or had proven locally advanced NSCLC; 88 patients were treated, 16 with induction chemotherapy. The overall treatment time was limited to 6 weeks; if necessary, using twice-daily irradiations 6 or more hours apart. Treatments were 5 days per week with 2.25-Gy fractions.
At MSKCC, the lung contours included low-density structures, excluding soft tissue equivalent gross tumor volume and hilum. At NKI, they were obtained from computed tomography images using a threshold of −300 HU with the gross tumor volume excluded.
The MSKCC treatment planning used an in-house system (11). Treatment was delivered by 6-MV or higher energy beams using 3-dimensional conformal radiation therapy; 3 patients received intensity modulated radiation therapy. At NKI, 3-dimensional conformal radiation therapy treatment plans using 3 to 7 8-MV photon beams were designed with a 3-dimensional treatment planning system (U-MPlan, University of Michigan). In both trials, equivalent path-length algorithms were used to account for tissue inhomogeneity.
Endpoints and patients used in this study
For this study, RP requiring steroids or worse (RPS) was analyzed. At MSKCC, RPS was Radiation Therapy Oncology Group (RTOG) ≥grade 3 RP (12); at NKI, RPS was Southwest Oncology Group ≥grade 2 RP (13) (Table E1).
Additional inclusion criteria for this study were as follows: treatment was planned on 1 single computed tomography scan including the whole lung volume, dose-volume histograms (DVHs) could be retrieved, patient experienced RPS within 6 months or had 6 months or more of follow-up. At MSKCC 78 patients satisfied these criteria, 10 of whom received induction chemotherapy. The median age was 70 years (range, 39–84 years). Prescriptions ranged from 57.6–90 Gy. Ten patients experienced RPS. At NKI 86 patients met our criteria. The median age was 70 years (range, 36–87 years). Prescriptions ranged from 49.5–94.5 Gy. Fourteen patients experienced RPS.
gEUD atlas
Lung doses were converted to linear-quadratic equivalent doses delivered in 2-Gy fractions using α/β = 3 Gy for each dose bin in the DVH (14). Below, all doses and DVHs include these corrections.
For a specific a, each patient’s gEUD was calculated using (6):
| (1) |
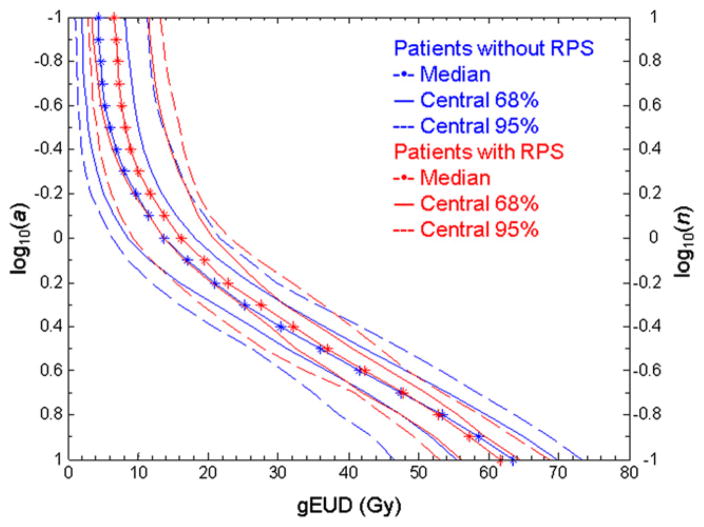
where vi is the fractional lung volume receiving dose di. gEUD is deff in the Lyman-Kutcher-Burman (LKB) model, with n = 1/a. For small a, low doses dominate the gEUD computation; for large a, the hot spot dominates. If a is unity, gEUD is the mean dose. Changing the value of a generates a gEUD(a) curve: for the DVH in Fig. E1A, this is shown in Fig. E1B. Figure 1 summarizes the distribution of these curves for all patients with and without RPS.
Fig 1.
Median values and envelopes containing the central 68% and 95% distributions of generalized equivalent uniform dose (gEUD) (dots, solid, and dashed lines, respectively) at each log10(a), for patients with (red) and without (blue) radiation pneumonitis requiring steroids (RPS) in the joint data (eg, for the 24 patients with RPS or worse, the 68% and 95% bands show the 8th and 11th patients from the median). The right-hand y axis shows n (=1/a) in the Lyman-Kutcher-Burman model.
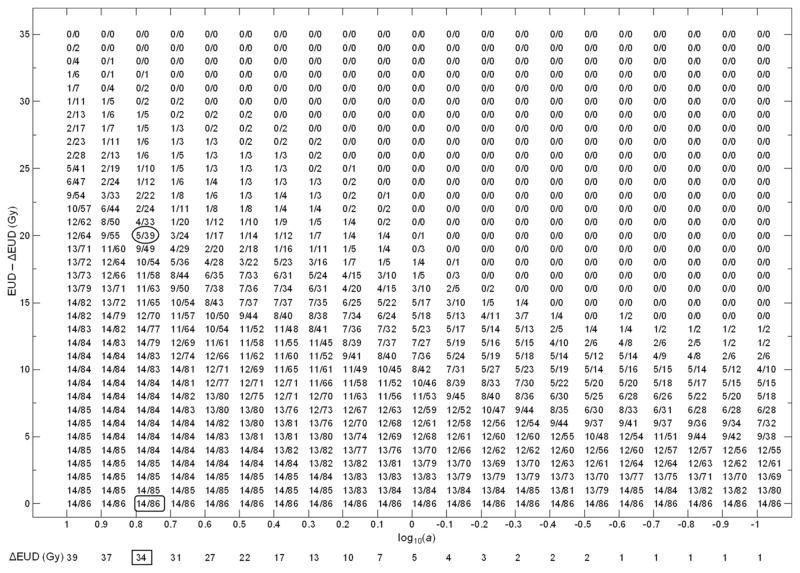
A gEUD atlas, a discrete cumulative description of patients’ RPS/gEUD information, was constructed for each data set using the method of Jackson et al (7). Each element at a grid point (i,j) in the atlas contains 2 numbers: the denominator np(i,j) is the number of patients whose gEUD(ai) is ≥gEUDj; the numerator nc(i,j) is the number of patients in the denominator with RPS. We constructed atlases for a varying from log10(a) = −1.0 to log10(a) = 1.0 at intervals of log10(a) = 0.1 with gEUD binned in 1-Gy intervals; this corresponds to n = 10-0.1, respectively.
Figure 2 shows the NKI atlas. For fixed log10(ai), there is a range 0-ΔgEUDi where atlas elements are identical. For efficiency the column is shifted by ΔgEUDi, which is shown below the log10(ai) value. For example, for log10(ai) = 0.8, the element 14/86 (rounded rectangle) repeats until ΔgEUDi = 34 Gy; the column was shifted by 34 Gy and 14/86 displayed once. The ΔgEUDi (34 Gy) was recorded below log10(ai) = 0.8 (rectangle) and the gEUD of element 5/39 (oval) is 20 + 34 = 54 Gy.
Fig 2.
The generalized equivalent uniform dose (gEUD) atlas for the Netherlands Cancer Institute data set. For compact display, the gEUD values in each column were shifted by the ΔgEUD value at the bottom.
When the atlas was used for model fitting, for a specific log10(ai), the number of patients between gEUDj and gEUDj+1 was (np(i,j) − np(i,j+1)); and the number with RPS was (nc(i,j) − nc(i,j+1)). In Fig. 2, for log10(ai) = 0.8, from elements 5/39 (oval) and 4/33 (above oval), 6 patients fell in the gEUD bin (54, 55), and 1 patient experienced RPS.
The denominators and numerators in the atlas of the combined data (Fig. E3) were determined by adding corresponding elements at the same a and gEUD in the MSKCC (Fig. E2) and NKI atlases (7).
Below, gEUDs based directly on equation 1 are called “exact” to distinguish them from the binned values from the atlas.
Statistical analysis
Maximum likelihood fits using the LKB (6) model were performed to correlate gEUD with RPS. In the model the RPS probability, p, is
| (2) |
where TD50 is the dose where p=50%, and m determines the response function slope.
Fits were performed for the NKI, MSKCC, and combined data, using both the exact and atlas-based gEUD values. Model parameters and their 68% and 95% confidence intervals (CI) were determined using the likelihood profile method. The resulting values of a and the response functions were compared. The range of a with significant correlation with RPS was determined.
The heterogeneity Q-value (15) and inconsistency I2-value (16) between the fitted model parameters were computed to check consistency between the 2 data sets.
Goodness of fit statistics were computed for the best fit models using the method of Tucker et al (17). First the outcome O for each patient was simulated using the model; then the squared residual (O-E)2 was computed, where E is the modeled complication probability. The distribution of the sum of squared residuals for all patients was calculated using 100,000 simulations. The goodness of fit statistic, G, was then calculated as the percentage of simulations where the sum of the squared residuals was larger than the observed value. If G is too close to 1, the model overfits the data, if G is too close to zero, the model does not fit the data.
From the atlases, we calculated maps of the probability of an RPS rate larger than or equal to 20% (a higher rate of RPS would be clinically unacceptable at MSKCC and NKI) and of the lower 68% confidence limit on the RPS rate, using the method of Jackson et al (7). These maps provide intuitive views of regions in gEUD space associated with unacceptable pneumonitis incidence.
Results
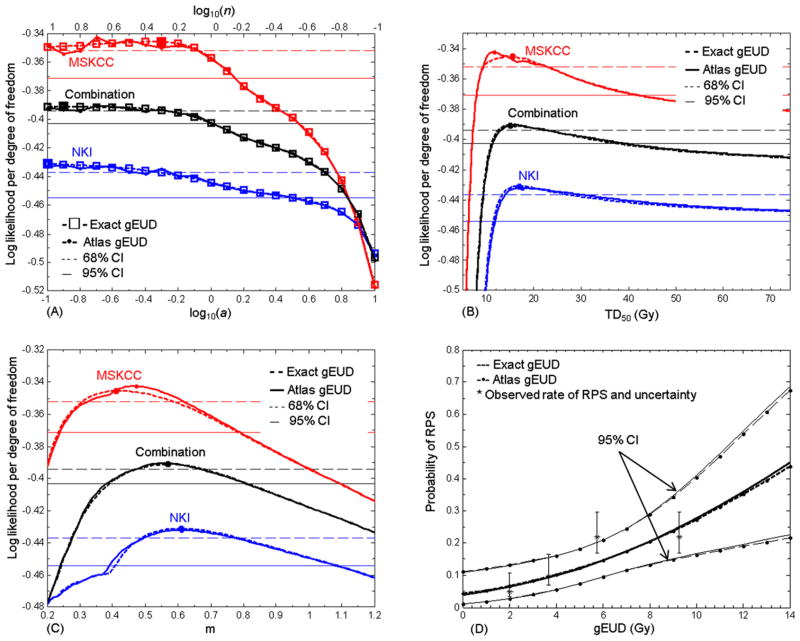
Table 1 and Fig. 3 show fitted LKB model parameters and likelihood profiles for all data sets, using either exact or atlas-based gEUD values. In each data set, the best fit values of a were poorly determined because the likelihood profiles were flat in their neighborhoods. The 1-Gy gEUD atlas resolution introduced small amounts of noise, leading to large changes in the best fit a in the MSKCC atlas. This effect was smaller in the combination. Upper 68% and 95% confidence limits on a were found, but lower 68% and 95% confidence limits were not. For the joint data, the limits from the exact and atlas-based gEUD values agreed well. The atlas-based best fit a values were below the upper 68% confidence limits of the exact calculation for all data sets. The upper 95% confidence limit on a was smaller for the joint data set compared with the individuals. In the joint data, values of log10(a) > 0.02 were excluded with 95% confidence. In all cases the best fit models had large volume effects.
Table 1.
Fit results
| Coefficients | log10(a) | TD50 | m |
|---|---|---|---|
| NKI exact gEUD | |||
| Best fit | −1 | 17 | 0.61 |
| 68% CI | (<−, −0.32) | (13.4, 27.7) | (0.49, 0.78) |
| 95% CI | (<−, 0.48) | (11.5, +>) | (0.41, 1.09) |
| NKI atlas gEUD | |||
| Best fit | −0.9 | 17.5 | 0.61 |
| 68% CI | (<−, 0.23) | (13.7, 33.1) | (0.49, 0.79) |
| 95% CI | (<−, 0.53) | (11.8, +>) | (0.39, 1.10) |
| MSK exact gEUD | |||
| Best fit | −0.3 | 15.5 | 0.41 |
| 68% CI | (<−, −0.08) | (9.5, 22.7) | (0.31, 0.58) |
| 95% CI | (<−, 0.14) | (8.0, 42.5) | (0.24, 0.78) |
| MSK atlas gEUD | |||
| Best fit | −0.7 | 11.6 | 0.47 |
| 68% CI | (<−, −0.18) | (9.7, 18.9) | (0.37, 0.58) |
| 95% CI | (<−, 0.12) | (8.1, 37.7) | (0.25, 0.76) |
| Joint exact gEUD | |||
| Best fit | −0.9 | 15.1 | 0.57 |
| 68% CI | (<−, −0.26) | (12.6, 22.8) | (0.48, 0.67) |
| 95% CI | (<−, 0.01) | (11.1, 38.1) | (0.39, 0.81) |
| Joint atlas gEUD | |||
| Best fit | −0.7 | 15.9 | 0.56 |
| 68% CI | (<−, −0.29) | (13.4, 22.0) | (0.49, 0.65) |
| 95% CI | (<−, −0.01) | (11.4, 38.6) | (0.39, 0.79) |
Abbreviations: CI = confidence interval; gEUD = generalized equivalent uniform dose; MSK = Memorial Sloan-Kettering Cancer Center; NKI = Netherlands Cancer Institute.
Fig 3.
Lyman-Kutcher-Burman model analysis for radiation pneumonitis requiring steroids or worse. (A) Log likelihood profiles per degree of freedom for a, for the Netherlands Cancer Institute (blue), Memorial Sloan-Kettering Cancer Center (red), and the combined (black) data. Profiles using exact generalized equivalent uniform dose (gEUD) values are shown with dashed lines and open squares; those using the atlas are shown with solid lines and dots. Colored horizontal lines show the respective 68% (thin dashed lines) and 95% (thin solid lines) confidence level for the log likelihood. Log likelihood curves are flat around their maximum values (darker squares) at small a for both individual data sets and their combination. (B) and (C) Equivalent profiles for TD50 and m. (D) Response functions at best fit a (log10(a) = −0.9), with 95% confidence intervals (CIs), compared with the observed complication rates with 68% CIs for each quartile in gEUD, plotted at each quartile’s median.
The 68% and 95% CIs on TD50 and m were narrower for the joint data set than those for individuals, indicating the increased power in the combination.
The P values of Q (15) were ≥0.34 and values of I2 (16) were zero for all fitted parameters, showing that there is no evidence that the individual data sets are inconsistent.
The fitted response functions using exact and atlas-based gEUD values were very similar. Figure 3D shows examples for the combined data at best fit a, compared with observed complication rates. Exact and atlas-based predictions of RPS rates and their 95% CIs differed by <~1% in the range of the data. The goodness of fit statistics, G, for the best fit models ranged from 0.43–0.50 for all data sets, using either exact or atlas-based gEUD values. There was no evidence that the models did not fit the relevant data.
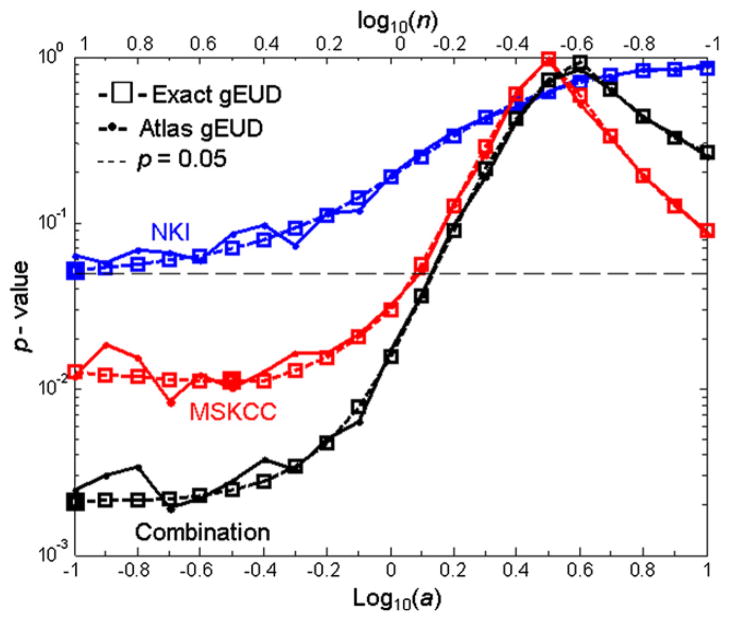
The P values for the model fits are shown as a function of log10(a) in Fig. 4. The strongest correlations with RPS occurred at small a in all data sets and for exact and atlas-based calculations, agreeing with the likelihood profiles (Fig. 3A). Figure 4 indicates that no data set showed significant correlations for log10(a) >0.14. Correlations of gEUD with RPS at small a values were stronger in the combined data set than in the individuals. The minimum P value of the combined data set (P=.002) is much lower than those of the individuals (P=.01 and 0.05 for the MSKCC and NKI data sets, respectively), showing that data pooling increased the statistical power. At smaller a, the discretization of the gEUD atlases caused noise in the P value curves but did not affect the overall patterns of significance.
Fig 4.
The P values for the fitted model at each log10(a), for the Netherlands Cancer Institute (blue), Memorial Sloan-Kettering Cancer Center (red) and the combined (black) data. The horizontal dashed line is P=.05.
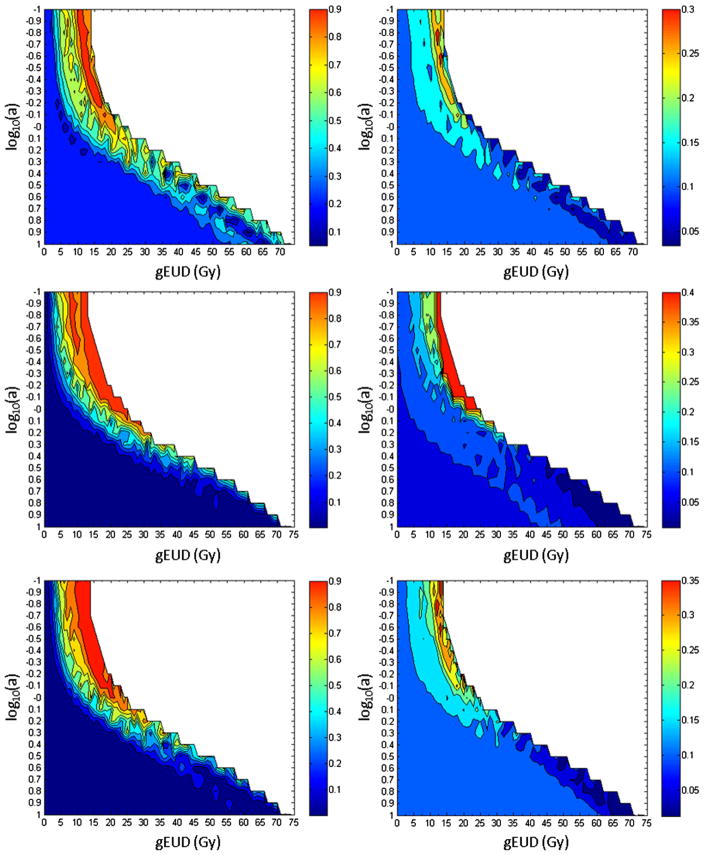
The maximum tolerated rate of RPS for NSCLC patients at MSKCC is 20%. The maps of the probability of RPS rate ≥20% (left column in Fig. 5) show higher risk for patients with larger gEUD values than those with lower ones at small a for all data sets. This effect was not seen at large a. This is consistent with the P value plots (Fig. 4) and the shifts in the summarized gEUD curves for patients with RPS at small a (Fig. 1). Similarly, maps of the lower 68% confidence limit on the RPS rate (right column in Fig. 5) show that at small a and large gEUD, these limits reach ~30%–40%. This compares with the observed relative risk of ~4 for patients in the highest and lowest quartiles in gEUD for log10(a) = −0.9 (Fig. 3D).
Fig 5.
Probability of radiation pneumonitis requiring steroids (RPS) rate ≥20% (left column) and the lower 68% confidence limit on the RPS rate (right column), for patients with generalized equivalent uniform dose ≥the plotted position. Top to bottom: the Netherlands Cancer Institute, Memorial Sloan-Kettering Cancer Center, and combined data.
Discussion
Data pooling has the potential to overcome the shortage of cases in individual studies, but current data reporting standards are inadequate for this task. The atlas provides a solution, which we demonstrated by analyzing prospective RPS and DVH data from MSKCC and NKI.
This study was entirely prospective and included only NSCLC patients in whom pneumonitis was the primary endpoint. To our knowledge, there is only 1 other such study of gEUD for pneumonitis: the analysis by Bradley et al (3) of RTOG 9311 patients. The LKB model analyses of pneumonitis in the MSKCC dose escalation trial has not been published before, and this analysis is the first to include all eligible patients from the NKI trial.
Consistent patterns of RPS
Measures of heterogeneity and inconsistency showed that the volume effects and dose responses in individual data sets were consistent. Similar broad patterns in the atlas-based maps (Fig. 5) showed increasing probability of RPS at similar values of gEUD for a <1.0; these increases petered out for a >1; the P values (Fig. 4) have similar dependence on a. All these indicated large volume effects for RPS.
Statistical power
Correlations of gEUD with RPS at small a were stronger in the combined set (Fig 4). The increased statistical power of the combination allowed better model fitting with narrower CIs on parameters.
Best fit models
In this study, the values of a were not predetermined but varied over a wide range (0.1–10). In the individual data sets and their combination, best fit RPS models had very small values of a, indicating large volume effects. The lower bound on a was poorly determined because the likelihood profiles for a became very flat, indicating that comparable fits were obtained provided a was small enough. The MLD (a = 1) model was not excluded but was at the extreme limit of our 95% CIs for a in the combined data.
Our results for a are consistent at the 95% confidence level with those from other studies of RP. Bradley et al (3) studied RP in patients from RTOG 9311 and Washington University, and they found the best fit for a between 0 and 1. Tucker et al (19) analyzed severe RP for 576 patients treated with radiation and concurrent chemotherapy, and they found a best fit a = 1.75 (95% CI [0.76–3.85]). Seppenwoolde et al (18) analyzed RP in breast, lymphoma, and NSCLC patients treated at NKI and the University of Michigan, including a subset of the NKI patients included here, and found a best fit a = 1.01. Moiseenko et al (20) analyzed symptomatic RP in 55 patients treated for malignant thymoma, with a best fit a = 0.98 (68% CI [0.65–1.96]).
Utility of atlases as tools for meta-analysis
To use atlases for data pooling, endpoint, organ, and dose definitions need to be compatible. We demonstrated that when these conditions are met, gEUD atlases of complication probability provide a reporting tool that can be used to conduct fits of dose-volume response in pooled data. Fitted response functions using atlas data were negligibly different from those based on exact data. The atlases identified boundaries on the values of a resulting in significant correlation of gEUD with RPS with negligible error. Where they existed, CIs on best fit model parameters were well determined using the atlases. The only salient differences between exact and atlas-based calculations occurred in locating the maximum likelihood values of parameters when the relevant likelihood profiles were flat ie, these values are ill-determined in the first place.
Conclusion
The atlas method can be used to combine gEUD and complication information from different institutions and model the gEUD dependence of complication incidence in the joint data. We used gEUD atlases to combine DVH and RPS data from NKI and MSKCC dose escalation protocols, and we found best fit gEUD responses for RPS. The best fit value of a was badly determined because the likelihood profiles were flat around the maximum; however, 95% CIs indicated that a ≤ 1.05. This includes the MLD model at the extreme limit and shows that the volume effect for RPS is large. Our gEUD maps of the probability that complication rates were ≥20%, and of the lower 68% CIs on complication probabilities, showed that volume effects for RPS in the NKI and MSKCC data were roughly consistent. More formally, Q and I2 tests for statistical inconsistency were not significant. Narrower CIs and the decrease of the P values in the joint data set demonstrated that the statistical power of our study was increased by data pooling.
The QUANTEC group (2) recognized the importance of data pooling to increase the statistical power of dose-volume modeling studies. Here we have demonstrated that atlases provide a simple method to achieve this goal. We encourage other investigators to publish their own atlases so their data can be used in future metaanalysis, and to use the atlases of Fig. 2, Fig. E2, and Fig. E3 in combination with their own pneumonitis data.
Supplementary Material
Summary.
The small numbers of cases per study limit the statistical power of investigations of the generalized equivalent uniform dose (gEUD) dependencies of complications. The atlas method was used to combine information from 2 prospective phase I/II dose escalation protocols and to model the gEUD dependence of radiation pneumonitis incidence in the joint data. The best fit value of the volume effect parameter, a, was <1.
Acknowledgments
Supported in part by NIH R01CA129182-01A2 and by the Dutch Cancer Society (Grant 99-2043).
Footnotes
Conflict of interest: none.
Supplementary material for this article can be found at www.redjournal.org.
References
- 1.Marks LB, Bentzen SM, Deasy JO, et al. Radiation dose-volume effects in the lung. Int J Radiat Oncol Biol Phys. 2010;76:S70–S76. doi: 10.1016/j.ijrobp.2009.06.091. [DOI] [PMC free article] [PubMed] [Google Scholar]
- 2.Jackson A, Marks LB, Bentzen SM, et al. The lessons of QUANTEC: recommendations for reporting and gathering data on dose-volume dependencies of treatment outcome. Int J Radiat Oncol Biol Phys. 2010;76:S155–S160. doi: 10.1016/j.ijrobp.2009.08.074. [DOI] [PMC free article] [PubMed] [Google Scholar]
- 3.Bradley JD, Hope A, El Naqa I, et al. A nomogram to predict radiation pneumonitis, derived from a combined analysis of RTOG 9311 and institutional data. Int J Radiat Oncol Biol Phys. 2007;69:985–992. doi: 10.1016/j.ijrobp.2007.04.077. [DOI] [PMC free article] [PubMed] [Google Scholar]
- 4.Deasy JO, Bentzen SM, Jackson A, et al. Improving normal tissue complication probability models: the need to adopt a “data-pooling” culture. Int J Radiat Oncol Biol Phys. 2010;76:S151–S154. doi: 10.1016/j.ijrobp.2009.06.094. [DOI] [PMC free article] [PubMed] [Google Scholar]
- 5.Kwa SLS, Theuws JCM, Wagenaar A, et al. Evaluation of two dose-volume histogram reduction models for the prediction of radiation pneumonitis. Radiother Oncol. 1998;48:61–69. doi: 10.1016/s0167-8140(98)00020-6. [DOI] [PubMed] [Google Scholar]
- 6.Marks LB, Yorke ED, Jackson A, et al. Use of normal tissue complication probability models in the clinic. Int J Radiat Oncol Biol Phys. 2010;76:S10–S19. doi: 10.1016/j.ijrobp.2009.07.1754. [DOI] [PMC free article] [PubMed] [Google Scholar]
- 7.Jackson A, Yorke ED, Rosenzweig KE. The atlas of complication incidence: a proposal for a new standard for reporting the results of radiotherapy protocols. Semin Radiat Oncol. 2006;16:260–268. doi: 10.1016/j.semradonc.2006.04.009. [DOI] [PubMed] [Google Scholar]
- 8.Rosenzweig KE, Fox JL, Yorke E, et al. Results of a phase I dose-escalation study using three-dimensional conformal radiotherapy in the treatment of inoperable nonsmall cell lung carcinoma. Cancer. 2005;103:2118–2127. doi: 10.1002/cncr.21007. [DOI] [PubMed] [Google Scholar]
- 9.Yorke ED, Jackson A, Rosenzweig KE, et al. Correlation of dosimetric factors and radiation pneumonitis for non-small-cell lung cancer patients in a recently completed dose escalation study. Int J Radiat Oncol Biol Phys. 2005;63:672–682. doi: 10.1016/j.ijrobp.2005.03.026. [DOI] [PubMed] [Google Scholar]
- 10.Belderbos JSA, Heemsbergen WD, De Jaeger K, et al. Final results of a Phase I/II dose escalation trial in non-small-cell lung cancer using three-dimensional conformal radiotherapy. Int J Radiat Oncol Biol Phys. 2006;66:126–134. doi: 10.1016/j.ijrobp.2006.04.034. [DOI] [PubMed] [Google Scholar]
- 11.Mohan R, Barest G, Brewster LJ, et al. A comprehensive three-dimensional radiation treatment planning system. Int J Radiat Oncol Biol Phys. 1988;15:481–495. doi: 10.1016/s0360-3016(98)90033-5. [DOI] [PubMed] [Google Scholar]
- 12.Cox JD, Stetz J, Pajak TF. Toxicity criteria of the Radiation Therapy Oncology Group (RTOG) and the European organization for research and treatment of cancer (EORTC) Int J Radiat Oncol Biol Phys. 1995;31:1341–1346. doi: 10.1016/0360-3016(95)00060-C. [DOI] [PubMed] [Google Scholar]
- 13.Green S, Weiss GR. Southwest Oncology Group standard response criteria, endpoint definitions and toxicity criteria. Invest New Drugs. 1992;10:239–253. doi: 10.1007/BF00944177. [DOI] [PubMed] [Google Scholar]
- 14.Wheldon TE, Deehan C, Wheldon EG, et al. The linear-quadratic transformation of dose-volume histograms in fractionated radio-therapy. Radiother Oncol. 1998;46:285–295. doi: 10.1016/s0167-8140(97)00162-x. [DOI] [PubMed] [Google Scholar]
- 15.Cochran W. The combination of estimates from different experiments. Biometrics. 1954;10:101–129. [Google Scholar]
- 16.Higgins JPT, Thompson SG, Deeks JJ, et al. Measuring inconsistency in meta-analyses. BMJ. 2003;327:557–560. doi: 10.1136/bmj.327.7414.557. [DOI] [PMC free article] [PubMed] [Google Scholar]
- 17.Tucker SL, Dong L, Bosch WR, et al. Late rectal toxicity on RTOG 94-06: analysis using a mixture Lyman model. Int J Radiat Oncol Biol Phys. 2010;78:1253–1260. doi: 10.1016/j.ijrobp.2010.01.069. [DOI] [PMC free article] [PubMed] [Google Scholar]
- 18.Seppenwoolde Y, Lebesque JV, de Jaeger K, et al. Comparing different NTCP models that predict the incidence of radiation pneumonitis. Int J Radiat Oncol Biol Phys. 2003;55:724–735. doi: 10.1016/s0360-3016(02)03986-x. [DOI] [PubMed] [Google Scholar]
- 19.Tucker SL, Liu HH, Liao Z, et al. Analysis of radiation pneumonitis risk using a generalized Lyman model. Int J Radiat Oncol Biol Phys. 2008;72:568–574. doi: 10.1016/j.ijrobp.2008.04.053. [DOI] [PMC free article] [PubMed] [Google Scholar]
- 20.Moiseenko V, Craig T, Bezjak A, et al. Dose-volume analysis of lung complications in the radiation treatment of malignant thymoma: a retrospective review. Radiother Oncol. 2003;67:265–274. doi: 10.1016/s0167-8140(03)00003-3. [DOI] [PubMed] [Google Scholar]
Associated Data
This section collects any data citations, data availability statements, or supplementary materials included in this article.


