Abstract
Four gadolinium (Gd)-based macromolecular contrast agents, G3-(Gd-DOTA)24, G5-(Gd-DOTA)96, G3-(Gd-DTPA)24, and G5-(Gd-DTPA)96, were prepared that varied in the size of dendrimer (generation three and five), the type of chelate group (DTPA or DOTA), and the theoretical number of metallated chelates (24 and 96). Synthesis relied on a dichlorotriazine derivatized with a DOTA or DTPA ligand that was incorporated into the dendrimer and ultimately metallated with Gd ions. Paramagnetic characteristics and in vivo pharmacokinetics of all four contrast agents were investigated. The DOTA-containing agents, G3-(Gd-DOTA)24 and G5-(Gd-DOTA)96, demonstrated exceptionally high r1 relaxivity values at off peak magnetic fields. Additionally, G5-(Gd-DOTA)96 showed increased r1 relaxivity in serum compared to that in PBS, which was consistent with in vivo images. While G3-(Gd-DOTA)24 and G3-(Gd-DTPA)24 were rapidly excreted into the urine, G5-(Gd-DOTA)96 and G5-(Gd-DTPA)96 did not clear as quickly through the kidneys. Molecular simulation of the DOTA-containing dendrimers provides a single-molecular level characterization of the structures and suggests that a majority of the metallated ligands are accessible to water. These triazine dendrimer-based MRI contrast agents exhibit several promising features such as high in vivo r1 relaxivity, desirable pharmacokinetics, and well-defined structure.
Keywords: magnetic resonance imaging, triazine dendrimer, relaxivity, pharmacokinetics, gadolinium
INTRODUCTION
Numerous nanomaterials—inorganic, organic, and hybrid—with unique chemical and physical characteristics are being explored for biologic application. Among them, synthetic dendritic macromolecules are versatile and promising for biological and medical applications because of their flexible, reproducible syntheses and biocompatible characteristics.1 When used as macromolecular MRI contrast agents, several advantages over low molecular weight gadolinium-chelates emerge including enhanced r1 relaxivity2, 3 because of efficient water exchange, unique pharmacokinetics that can be adapted to target the blood pool,4, 5 liver,6, 7 kidney,8, 9 and lymphatic flows,10, 11 the ability to be a drug carrier, and flexibility for labeling due to their inherent multivalency.12, 13 The improved relaxivity and prolonged pharmokinetics help minimize the injected dose of gadolinium ions, thus, reducing the risk of nephrogenic systemic fibrosis (NSF),14-16 a recent concern in the design of gadolinium-based contrast agents.17
Monodispersity, a feature of lower generation dendrimers, is a desirable characteristic of macromolecular contrast agents because it facilitates characterization and confidence in composition which lead to materials with batch-to-batch consistency vis a vis in vivo behavior. On increasing generation, however, the dispersity of most dendrimers increases. For instance, more than 10% of commercial PAMAM dendrimers larger than generation 4 appear to be defective, containing missing branches, molecular loops, and dimers18, 19 leading to inconsistent product quality that can be a potential regulatory concern when pursuing clinical application of dendrimers. These defects may be critical because in vivo pharmacokinetics of dendrimers can be influenced by the nature of the chemical core, interior, and surface of the dendrimer although this is still poorly understood. Even with the same surface modifications and similar sizes, dendrimers with different interiors such as PAMAM and PPI showed distinct in vivo pharmacokinetics.8 Moreover, the number of generations and nature of the conjugated chelates used to bind Gadolinium are also critical factors that alter relaxivity and pharmacokinetics.20, 21
Triazine dendrimers can be reproducibly synthesized with well-defined structure.22-28 Their syntheses are straightforward. They are amenable to multiple characterization methods. They are stable. These characteristics offer distinct advantages over other classes of dendrimers, creating opportunities for drugs or diagnostic agents with more predictable and tunable pharmacokinetic profiles. Here, we describe a family of Gd-based MRI contrast agents that utilize monodisperse triazine dendrimers of two different generations24 to yield generation 3 and 5 targets upon conjugation with the DOTA or DTPA-containing ligands (Chart 1).
Chart 1.
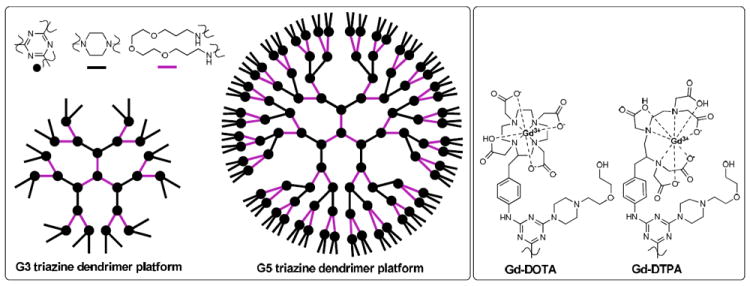
Representation of the two triazine dendrimers (left) and the metallated chelates that appear on each peripheral piperazine.
MATERIALS AND METHODS
Synthesis
The macromolecular Gd3+ chelates were synthesized using the triazine dendrimers of generation 3 and 5 prepared as previously reported.24 To incorporate either DOTA or DTPA groups, a conjugation strategy using a functionalized monomer was adopted (Scheme 1). That is, the t-butyl ester-protected ligands were incorporated into the dichlorotriazine 5 or 8 in 88% yield. Reactions with the dendrimer platforms afforded the four poly(monochlorotriazine) dendrimers, 6, 7, 9, and 10, respectively. The surface group HEEP, 1-[2-(2-hydroxyethoxy)ethyl]piperazine, was chosen due to high reactivity of the cyclic secondary amine towards monochlorotriazines and the hydrophilic auxiliary groups. Following an acidic deprotection, the desired macromolecular ligands, 1, 2, 3, and 4 were obtained. From the G3 and G5 dendritic platforms, these agents were synthesized in four steps in 70-80% overall yield.
Scheme 1.
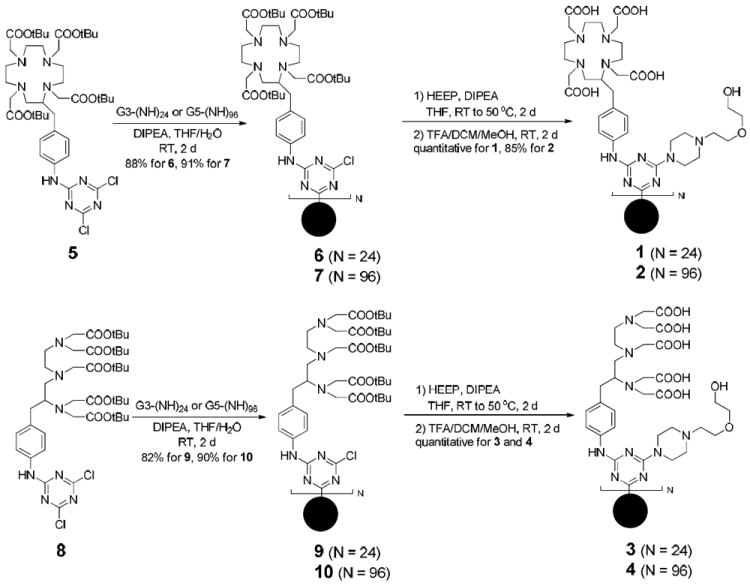
Synthesis of the Triazine Dendrimers (1—4) Containing DOTA or DTPA Ligands (G3 and G5 Dendrimer Platforms Depicted as Black Dot Spheres)
Preparation of Gd(III) Complexes
The dendrimers (1-4) were dissolved in deionized water. Gd(OAc)3 (24 equiv. for 1 and 3, 96 equiv. for 2 and 4) was added to the solution at room temperature. The pH of the solution was adjusted to 5.5-6 by adding dilute NaOH (aq). Xylenol orange solution was used to monitor the presence of free gadolinium ions. The reaction solution was stirred at 50 °C for 2 days. In order to remove nonspecifically bound Gd3+ ions, the solution was stirred with 3 mM of EDTA at room temperature for 2 hrs. The resulting solution was purified by diafiltration using Amicon stirred ultrafiltration cell equipment (PLCC membrane, MWCO 5 kDa for 1 and 3, 10 kDa for 2 and 4) in deionized water over 3 days. No free Gd3+ ions were observed from the purified solution with xylenol orange test. Each solution was lyophilized to provide the dendrimer-Gd complexes, G3-(Gd-DOTA)24 (from 1), G5-(Gd-DOTA)96 (from 2), G3-(Gd-DTPA)24 (from 3), and G5-(Gd-DTPA)96 (from 4), respectively.
Computational Procedure
The protocol used for the creation and the parametrization of the G3-(Gd-DOTA)24 and G5-(Gd-DOTA)96 dendrimers has been previously used by us for the simulation of other dendritic molecules.29 The dendritic scaffolds were constructed as composed by different residues: a central (CEN) unit, the flexible (FLX) units composing the branches, the rigid triazine residues (RIG) and the surface units, namely the DOTA (DOT) groups and the protective terminal units (END). The entire modeling work was carried out using the AMBER 11 suite of programs.30 The DOTA groups were parameterized as previously reported.31 The force field parameters for the other non-standard residues composing the dendrimers were assigned consistently with the “general AMBER force field (GAFF)” (gaff.dat).32 The partial charges for these residues were obtained using the AM1-BCC33,34 calculation method within the antechamber35 module of AmberTools 1.4 (AMBER 11). The models for G3-(Gd-DOTA)24 and G5-(Gd-DOTA)96 were immerged in a periodic box containing TIP3P water molecules36 extending 14 Å from the solute atoms. A suitable number of ions were added in solution using the standard addIons utility of the leap module (AMBER 11) to guarantee the systems neutrality and the ionic concentration of 150 mM [NaCl]. Water molecules were eventually replaced with ions when superposition occurred. The parm99 all-atom force field37 was used to parametrize the standard residues in the system. The two solvated dendrimers were initially minimized. Two first steps of molecular dynamics simulations (MD) followed, lasting 50 ps in NVT and NPT conditions respectively, to reach the simulation temperature of 300 K and to equilibrate the solution density inside the periodic box. The systems were then equilibrated for 100 nanoseconds (ns) in NPT periodic boundary condition at 300 K and 1 atm, using a time step of 2 femtoseconds, the Langevin thermostat and a 10 Å cutoff. During this time, both dendrimers reached the equilibrium with good stability. The SHAKE algorithm was used during the simulations on the bonds involving Hydrogen atoms38,39 and the particle mesh Ewald40 (PME) approach was adopted to treat the long-range electrostatic effects. The equilibrated phase of the MD trajectories was further processed with the ptraj module of AMBER 11 to the extract structural data (i.e., the radius of gyration, Rg, and the radial distribution functions, RDF).
Paramagnetic Characteristics
Relaxivity was measured by a custom designed variable field T1-T2 analyzer (Southwest Research Institute, San Antonio, TX) and a 3T MR system (Signa LX, GE Healthcare, Waukesha, WI, USA). For the variable field analyzer, the field strength was varied from 0.035 to 1.5 T (1.5-63 MHz) and the sample temperature was set at 23 °C. Solutions of G3-(Gd-DOTA)24, G5-(Gd-DOTA)96, G3-(Gd-DTPA)24, G5-(Gd-DTPA)96, Gd-DOTA (Prohance), and Gd-DTPA (Magnevist, Berlex, Princeton, NJ) (1 mMGd, PBS, pH 7.4) were prepared, and T1 was measured using a saturation recovery pulse sequence with 32 incremental recovery times. T2 was measured using a Carr-Purcel-Meiboom-Gill pulse sequence of 500 echoes and an interecho time of 2 msec. To investigate the temperature dependency, additional measurements were performed at 0.8-T field strength.
Relaxivity was measured at 23 °C using a 3.0-T clinical scanner (Signa Excite, GE Healthcare, Waukesha, WI, USA) equipped with a rectangular single loop receiver coil (84 × 126 × 6 mm). Phantom solutions in 1x; PBS consisting of 0, 0.1, 0.25, 0.5, 0.75 and 1 mM in Gd(III) together with Gd-DTPA as reference controls were prepared. A series of single-slice 2D inversion recovery (IR) fast-spin echo images of all solutions were obtained at an echo time (TE) of about 7.54 ms using different inversion recovery times (TI) of 50, 100, 350, 750, 1250, 2500, and 5000 ms. The r1 values for each dilution were determined by fitting ROI intensity values from variable IR images using Igor Pro (http://www.wavemetrics.com). r2 values were measured from ROI values from T2 maps, which were calculated from the multiecho images in ImageJ (http://rsb.info.nih.gov/ij) using the MRI analysis plugin (http://rsb.info.nih.gov/ij/plugins/mri-analysis.html). The molar relaxivities, r1 and r2, were obtained from the slope of 1/T1 or 1/T2 vs [Gd(III)] plots determined from region of interest measurements.
Contrast-Enhanced Dynamic 3D-Micro MRI of Mice
All dynamic micro-MRI images were obtained at 3-T with a 1-in. round receive-only modified Alderman-Grant resonators. Mice were chemically restrained with 2% isoflurane (Abbott Laboratories, NJ) in O2 delivered using a Summit Anesthesia Solutions vaporizer (Bend, OR) at a flow rate of 0.8 L/min. Respiration rate was maintained at 25-30 respirations per min and monitored using a Biopac System MP150 (Biopac Inc., Goleta, CA). The temperature of the mouse was maintained at 32 ± 1 °C using a Polyscience Model 210 heating recirculator with 3M Fluorinert Electronic Liquid FC-77 with body temperature monitored using FOTM fiber optic sensors (Fiso Technologies Inc., San Jose, CA) and a UMI-8 multichannel instrument (Fiso Technologies Inc). A tail vein cannula consisting of a 30-gauge needle attached to Tygon tubing (0.01 in i.d) was then established. Prior to injection of the contrast agent, a T1 map was obtained by using a 3D-fast spoiled gradient echo image (3D-fSPGR) sequence at two different flip angles (repetition time/echo time 10.888/3.86 ms; flip angles 8° and 24°; bandwidth 31.25 kHz; matrix size 512×128×40; voxel resolution 156×156×600 μm; slice thickness 0.6 mm; two averages; scan time ~2 min). One hundred microliter (100 μL) of the G3-(Gd-DOTA)24, G5-(Gd-DOTA)96, G3-(Gd-DTPA)24, G5-(Gd-DTPA)96, or PAMAM-G4-Gd-DTPA was injected (0.03 mmolGd/kg) from the tail vein. The region of interest was placed on the liver, the cortex and medulla of the kidney, the muscle at the femoral region and the jugular vein, and the time-intensity curves were made. In addition, the slice data were processed into 3D images with the maximum intensity protection (MIP) method.
RESULTS AND DISCUSSION
Characterization of Compounds
Characterization of compounds rests on NMR spectroscopy and mass spectrometry. After conjugation reaction of the dendrimer platform with the dichlorotriazine monomer containing ligands, the resulting poly(monochlorotriazines), 6, 7, 9, and 10, were monitored by 1H NMR and MALDI-TOF MS. While the peaks derived from 1H NMR spectroscopy are somewhat broad in Figure 1, integration yields an estimate of the number of chelate groups. That is, signals from the chelate groups (a, b, and d) can be compared to those from the dendrimer platform (c). The integrated intensity of signal c was used as a standard for the comparison as the dendrimer platforms. We assume from the reasonable match, that the reaction to install chelate on the dendrimer proceeded exceedingly well given the small deviations between theoretical expectations and experimental observations. Analyzing extent of reaction is more difficult with MALDI-TOF MS (Figure 1), but the results are consistent. Table 1 represents chemical summary of the macromolecular ligands (1-4). All the compounds contain around 24 (for G3) or 96 (for G5) ligands, the maximum number that can be theoretically attached. After metalation with Gd3+, these materials comprise approximately 13 wt% of gadolinium as determined by a titration assay: A known amount of dendrimer stock solution was titrated with a 10 mM of Gd(OAc)3 (aq) at pH 5.5-6 until the solution tested positive for free gadolinium ions using xylenol orange solution. The solution was stirred at 50 °C for 2 days and then titrated with a 1 mM EDTA (aq) until no free Gd3+ was observed from xylenol orange test. By this method, the molar ratio of Gd3+ per dendrimer was determined, which was consistent with the theoretical number of ligands of each dendrimer (Table 1).
Figure 1.
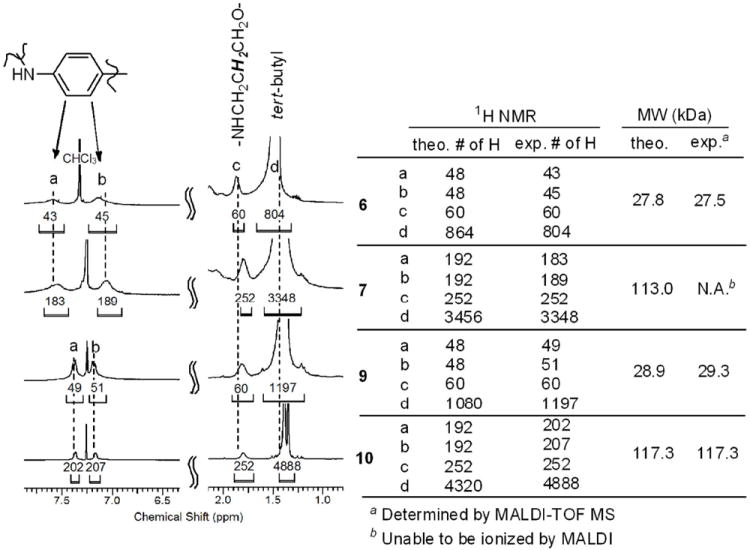
1H NMR spectra and molecular weights of the dendrimers, 6, 7, 9, and 10, containing DOTA or DTPA ligands.
Table 1.
Chemical Summary of the Macromolecular Ligands (1—4) and the Corresponding Gd3+ Complexes
| compound | MW (kDa)
|
ligands
|
metalation
|
||||
|---|---|---|---|---|---|---|---|
| theo. | exp.a | name | theo. # | exp. #a | name | Gd3+ #b | |
| 1 | 25.8 | 25.5 | DOTA | 24 | 23.6 | G3-(Gd-DOTA)24 | 23.7 |
| 2 | 104.6 | 105.7 | DOTA | 96 | 97.5 | G5-(Gd-DOTA)96 | 95.8 |
| 3 | 25.5 | 24.8 | DTPA | 24 | 23.1 | G3-(Gd-DTPA)24 | 23.5 |
| 4 | 103.6 | 104.7 | DTPA | 96 | 97.5 | G5-(Gd-DTPA)96 | 95.6 |
determined by MALDI-TOF MS
determined by titration assay
Computational Modeling
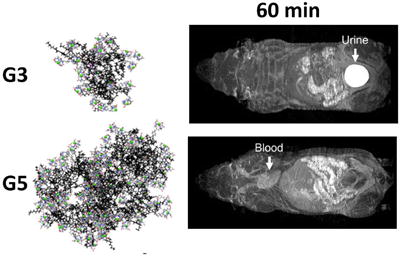
Computational models with explicit solvent and ions have provided a unique insight into the structure of triazine dendrimers. The simulations shown in Chart 2 are obtained from 100 ns of molecular dynamics (MD) simulations at 300 K and 1 atm of pressure. Both the equilibrated structures of DOTA chelates G3-(Gd-DOTA)24 and G5-(Gd-DOTA)96 are presented. From these computational models, we can calculate a number of interesting parameters. At the equilibrium, G3-(Gd-DOTA)24 and G5-(Gd-DOTA)96 showed a radius of gyration (Rg) of 22.6 +/- 0.2 Å and 35.1 +/- 0.3 Å, respectively.
Chart 2.
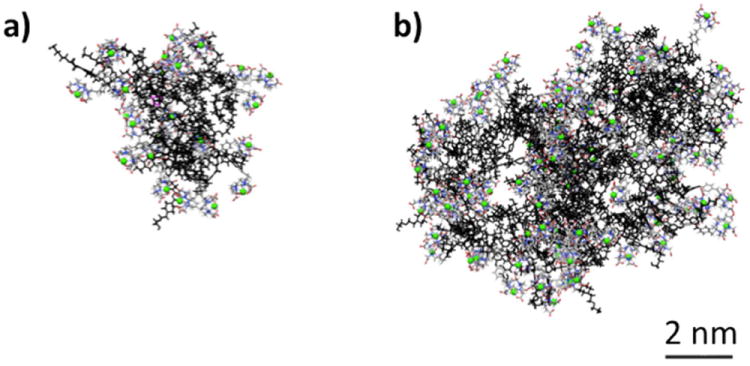
Equilibrated configurations of G3-(Gd-DOTA)24 (a) and G5-(Gd-DOTA)96 (b). The dendritic scaffold is colored in black, DOTA chelates are colored by atoms (C: grey, N: blue, O: red and H: white) and Gd atoms are colored in green. The center of the dendrimer is colored in pink. Explicit water molecules and Cl- and Na+ atoms are not shown for clarity.
These computations provide insights into interactions between these macromolecular chelates and water as well as the accessibility of the chelate to solvent as shown by radial distribution functions (RDFs). An RDF represents the density and the distribution of atoms in space with respect to the center of a given system of reference (the center of mass of the dendrimer). The RDFs shown in Figure 2 show the dendrimer platform (black continuous line), the DOTA chelates complexed with Gd ions (black dotted line), and water molecules (blue profile) with respect to the center. This plot gives indications about the presence of solute or solvent atoms in a certain zone of the system (spatial density). Since these curves are calculated at each step of the simulation, and they are reported in the plots as averaged over the equilibrated phases of the dynamic trajectories, they give information also on the dynamics of the system. These plots provide an indication on the time period in which a certain atom is present in a certain area in the space (dynamic density). In RDF plots, high and narrow peaks in a small area of these graphs mean not only high density of atoms in a certain zone, but also high localization and low mobility of these atoms whether dendrimer, DOTA or water. Conversely, broad and low intensity peaks indicate low density and high mobility.
Figure 2.

Radial distribution functions of dendrimer (black solid line) and metallated chelates (black dotted line) and water molecules (blue line) of G3-(Gd-DOTA)24 (left) and G5-(Gd-DOTA)96 (right).
RDF plots show reduced surface DOTA backfolding most likely due to the large size of the DOTA indicators. From these data we infer that the metallated ligands are accessible to water, with more groups available on G5-(Gd-DOTA)96 than G3-(Gd-DOTA)24. The larger dendrimer presents a higher surface density of Gd-DOTA groups than smaller dendrimer (the 2nd peak at 20 angstroms). Thus, the 96 Gd-DOTA groups of the generation 5 dendrimer may induce a higher surface density through structural crowding. This crowding is consistent with a decrease of water in that zone. In addition, some of these DOTA groups appear backfolded toward the dendrimer’s core as indicated by peaks between c.a. 15 and 25 angstroms from the dendrimer’s center. G3-(Gd-DOTA)24 shows a more uniform structure and a more flexible surface. After the 1st high intensity peak, the decrease in RDF is continous and uniform.
Computation suggests that both dendrimers allow for consistent water penetration—even with waters found in close proximity to the cores. Whether these waters can exchange with bulk solvent is less certain, as peaks could also be generated by trapped molecules close to the dendrimer’s center.
Relaxivity
Relaxivity profiles of triazine dendrimers conjugated with Gd-DOTA were different from those conjugated with DTPA-Gd or similar dendrimer agents that use PAMAM as a core instead of triazines. Both G5-(Gd-DOTA)96 and G3-(Gd-DOTA)24 showed higher r1 and r2 relaxivity compared with G5-(Gd-DTPA)96 and G3-(Gd-DTPA)24 especially at lower magnetic field than 30 MHz (Figure 3), where all dendrimer-based macromolecular MRI contrast agents showed the peak r1 relaxivity. The r1 relaxivity of all agents decreased at high magnetic field such as 128 MHz (3-Tesla) and 300 MHz (7-Tesla). Furthermore, triazine dendrimer-based agents, especially when conjugated with Gd-DOTA showed higher r1 relaxivity in serum than in PBS (Table 2), which can be advantageous in vivo imaging.
Figure 3.
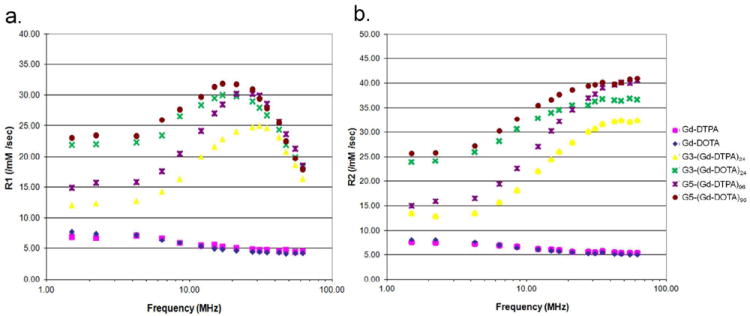
r1 (a) and r2 (b) relaxivity profiles of triazine dendrimer-based conjugates compared with low molecular weight Gd-chelates (Gd-DTPA and Gd-DOTA) below 63 MHz magnetic field at 23°C.
Table 2.
Relaxivities of Gd Contrast Agents at 128 MHz
| Chelates | r1 (/mM/s)
|
r2 (/mM/s)
|
||
|---|---|---|---|---|
| in PBS | in serum | in PBS | in serum | |
| G3-(Gd-DOTA)24 | 7.5 | 11.4 | 33 | 44 |
| G5-(Gd-DOTA)96 | 9.6 | 24 | 48 | 70 |
| G3-(Gd-DTPA)24 | 6.7 | 11 | 31 | 40 |
| G5-(Gd-DTPA)96 | 7.4 | 13 | 42 | 51 |
| PAMAM-G4-Gd-DTPA | 12 | 15 | 33 | 41 |
| Gd-DTPA | 4,8 | N.A. | 5.3 | N.A. |
A striking finding of this study is the differences in relaxivity profiles between triazine dendrimers and PAMAM dendrimers based on the chelate used. DOTA conjugated to G3 and G5 triazine dendrimers showed much higher r1 and r2 relaxivity at low magnetic field (12 MHz or lower) and higher r1 relaxivity at high magnetic field (128 MHz) than comparable PAMAM dendrimers even in the PBS buffer. The peak r1 relaxivity values of both dendrimers of the same generation were similar at 30 MHz. This increased relaxivity may be caused by the chelate conformation, which allows either fast or slow water exchange. DOTA is known to form a variety of conformations, when conjugated to different moieties via a side chain.31,32 Therefore, benzyl-DOTA conjugated with triazine dendrimer can exchange water rapidly leading to high r1 relaxivity at off peak magnetic fields.33
Another advantage of triazine G5 agents is that r1 increased dramatically in serum vs. PBS. Although the r1 of both triazine G5s and PAMAM-G4 in PBS were around 10 /mM/s, the r1 of triazine G5s in serum increased more than 2-fold up to above 20/mM/s at 128 MHz, a finding that did not occur with PAMAM-based MRI-CAs. In particular, triazine G5-DOTA demonstrated an r1 of 24 /mM/s, which is 85% higher than triazine G5-DTPA (13 /mM/s). This high relaxivity is likely related to loose serum protein binding which further slows the molecular tumbling rate.
In Vivo Dynamic Imaging Studies
In vivo pharmacokinetics using dynamic MRI was different for G3-based and G5-based agents. G3-(Gd-DTPA)24 and G3-(Gd-DOTA)24 quickly cleared from the kidneys. Dynamic MRI showed a quick decrease in blood signal and a temporally rapid increase of signal in the kidneys, followed by a gradual signal increase in the bladder (Figure 4a and 4b, Supplemental video 1 and 2, and Figure 5a and 5b). In contrast, G5-(Gd-DTPA)96 and G5-(Gd-DOTA)96 did not show clearance through the kidney, but demonstrated steady signal in the blood and the kidneys, and no or minimal signal increase in the bladder (Figure 4c and 4d, Supplemental video 3 and 4, and Figure 5a and 5b). In addition, G5-(Gd-DOTA)96 showed higher signal than G5-(Gd-DTPA)96 in vivo, which is consistent with its high serum relaxivity (Figure 4c and 4d) that has never seen, when employed PAMAM dendrimer as a platform (Supplemental figure 22). No significant difference of T1 signals in the liver was observed among the macromolecular chelates regardless of the generation and ligand (Figure 5c).
Figure 4.
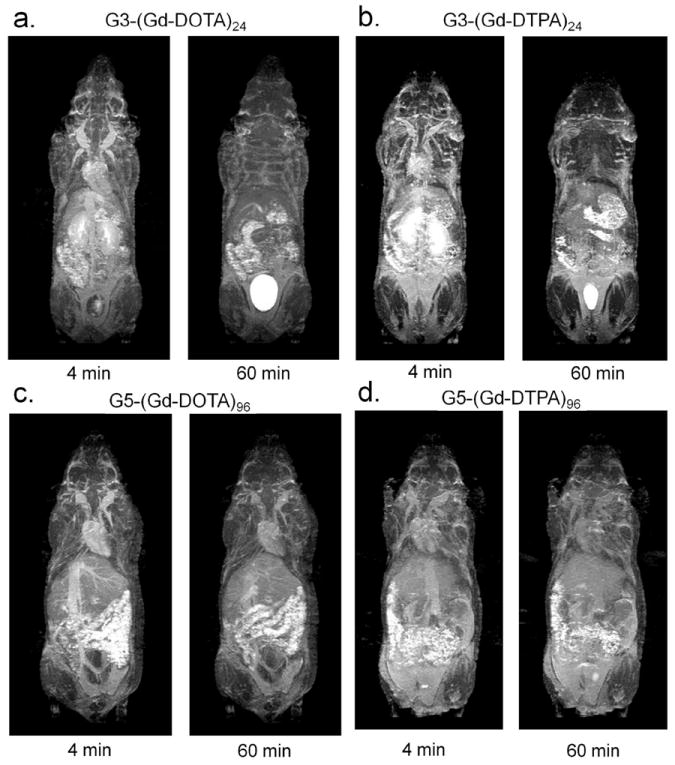
Early (4 min) and late (60 min) whole body MIP MR images of mice injected with 0.03 mmol/kg of G3-(Gd-DOTA)24 (a), G3-(Gd-DTPA)24 (b), G5-(Gd-DOTA)96 (c), and G5-(Gd-DTPA)96 (d) are shown. Entire dynamic MR images, which were taken every 2 min, are shown as Supplemental movies 1 to 4. (1: G3-(Gd-DOTA)24; 2: G3-(Gd-DTPA)24; 3: G5-(Gd-DOTA)96; 4: G5-(Gd-DTPA)96). Both G3 agents show enhanced kidneys (arrows) as well as blood pool in image 4 min after injection, however, show only the urine in the bladder 60 min after injection. In contrast, both G5 agents show blood pool up to 60 min after injection with minimal enhancement in the kidney and the bladder.
Figure 5.
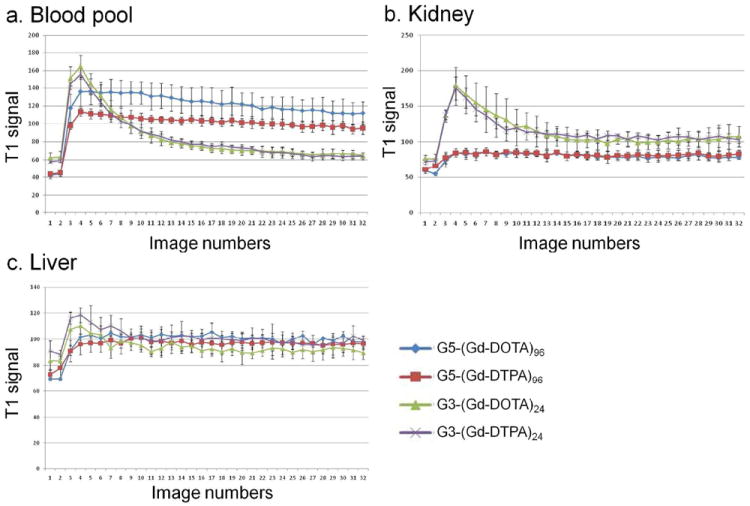
Serial dynamic T1 signals of the blood pool (a), the kidney (b) and the liver (c) are plotted. T1 signals are consistent with the dynamic image shown in Figure 4 and Supplemental videos. Image 1 is Pre-contrast and image 2 is obtained after contrast agent administration. Images were obtained every 2 min after injection (images 2-32).
CONCLUSIONS
Gd-based macromolecular contrast agents were synthesized using a well-characterized G3 or G5 triazine platform. NMR spectroscopy and mass spectrometry confirmed that both G3 and G5 contrast agents conjugated with either DTPA or DOTA contained approximately 24 and 96 chelates respectively, which represents the theoretical limit which is also unusual for such conjugations with other dendrimers. Both G3 dendrimers, as expected, showed a shorter half life in blood and more rapid renal excretion than G5 dendrimers. Although triazine G5 agents are smaller than PAMAM G4 agents, they show reduced their renal excretion.23 The r1 relaxivity of dendrimers chelated with DOTA was higher than that of dendrimers chelated with DTPA. G5-(Gd-DOTA)96 had a markedly higher relaxivity in serum than in PBS. Thus, this agent had a 4-5 fold improvement in relaxivity compared to low molecular weight Gd-DOTA or Gd-DTPA. The pharmacokinetics of dendrimer chelated with either DTPA or DOTA was similar. Taken together, the DOTA version of the triazine dendrimer has advantages in relaxivity in comparison to DTPA chelates at widely accessible MRI frequencies/field strengths (64-128 MHz; 1.5T-3T) especially in vivo, and has the added advantage of higher association constants for gadolinium, making it more attractive for clinical translation. Such aspirations benefit from the ease of characterization associated with these materials.
Supplementary Material
Acknowledgments
This research was supported by the Intramural Research Program of the National Institutes of Health, National Cancer Institute, Center for Cancer Research and the National Institutes of Health (GM 65460 to EES).
Footnotes
Supporting Information.
Details of synthesis and spectral data. This material is available free of charge via the Internet at http://pubs.acs.org.
References
- 1.Menjoge AR, Kannan RM, Tomalia DA. Dendrimer-based drug and imaging conjugates: design considerations for nanomedical applications. Drug Discov Today. 2010;15:171–185. doi: 10.1016/j.drudis.2010.01.009. [DOI] [PubMed] [Google Scholar]
- 2.Bryant LH, Jr, Brechbiel MW, Wu C, Bulte JW, Herynek V, Frank JA. Synthesis and relaxometry of high-generation (G = 5, 7, 9, and 10) PAMAM dendrimer-DOTA-gadolinium chelates. J Magn Reson Imaging. 1999;9:348–352. doi: 10.1002/(sici)1522-2586(199902)9:2<348::aid-jmri30>3.0.co;2-j. [DOI] [PubMed] [Google Scholar]
- 3.Ogawa M, Regino CA, Marcelino B, Williams M, Kosaka N, Bryant LH, Jr, Choyke PL, Kobayashi H. New nanosized biocompatible MR contrast agents based on lysine-dendri-graft macromolecules. Bioconjug Chem. 2010;21:955–960. doi: 10.1021/bc9005442. [DOI] [PMC free article] [PubMed] [Google Scholar]
- 4.Kobayashi H, Sato N, Hiraga A, Saga T, Nakamoto Y, Ueda H, Konishi J, Togashi K, Brechbiel MW. 3D-micro-MR angiography of mice using macromolecular MR contrast agents with polyamidoamine dendrimer core with references to their pharmacokinetic properties. Magn Reson Med. 2001;45:454–460. doi: 10.1002/1522-2594(200103)45:3<454::aid-mrm1060>3.0.co;2-m. [DOI] [PubMed] [Google Scholar]
- 5.Kobayashi H, Sato N, Kawamoto S, Saga T, Hiraga A, Ishimori T, Konishi J, Togashi K, Brechbiel MW. 3D MR angiography of intratumoral vasculature using a novel macromolecular MR contrast agent. Magn Reson Med. 2001;46:579–585. doi: 10.1002/mrm.1230. [DOI] [PubMed] [Google Scholar]
- 6.Kobayashi H, Kawamoto S, Saga T, Sato N, Hiraga A, Ishimori T, Akita Y, Mamede MH, Konishi J, Togashi K, Brechbiel MW. Novel liver macromolecular MR contrast agent with a polypropylenimine diaminobutyl dendrimer core: comparison to the vascular MR contrast agent with the polyamidoamine dendrimer core. Magn Reson Med. 2001;46:795–802. doi: 10.1002/mrm.1259. [DOI] [PubMed] [Google Scholar]
- 7.Kobayashi H, Saga T, Kawamoto S, Sato N, Hiraga A, Ishimori T, Konishi J, Togashi K, Brechbiel MW. Dynamic micro-magnetic resonance imaging of liver micrometastasis in mice with a novel liver macromolecular magnetic resonance contrast agent DAB-Am64-(1B4M-Gd)(64) Cancer Res. 2001;61:4966–4970. [PubMed] [Google Scholar]
- 8.Kobayashi H, Kawamoto S, Jo S, Bryant LH, Jr, Brechbiel MW, Star RA. Macromolecular MRI contrast agents with small dendrimers: pharmacokinetic differences between sizes and cores. Bioconjug Chem. 2003;14:388–394. doi: 10.1021/bc025633c. [DOI] [PubMed] [Google Scholar]
- 9.Kobayashi H, Kawamoto S, Jo S, Sato N, Saga T, Hiraga A, Konishi J, Hu S, Togashi K, Brechbiel MW, Star RA. Renal tubular damage detected by dynamic micro-MRI with a dendrimer-based MR contrast agent. Kidney Int. 2002;61:1980–1985. doi: 10.1046/j.1523-1755.2002.00364.x. [DOI] [PubMed] [Google Scholar]
- 10.Kobayashi H, Kawamoto S, Sakai Y, Choyke PL, Star RA, Brechbiel MW, Sato N, Tagaya Y, Morris JC, Waldmann TA. Lymphatic drainage imaging of breast cancer in mice by micro-magnetic resonance lymphangiography using a nano-size paramagnetic contrast agent. J Natl Cancer Inst. 2004;96:703–708. doi: 10.1093/jnci/djh124. [DOI] [PubMed] [Google Scholar]
- 11.Kobayashi H, Kawamoto S, Star RA, Waldmann TA, Tagaya Y, Brechbiel MW. Micro-magnetic resonance lymphangiography in mice using a novel dendrimer-based magnetic resonance imaging contrast agent. Cancer Res. 2003;63:271–276. [PubMed] [Google Scholar]
- 12.Kobayashi H, Koyama Y, Barrett T, Hama Y, Regino CA, Shin IS, Jang BS, Le N, Paik CH, Choyke PL, Urano Y. Multimodal nanoprobes for radionuclide and five-color near-infrared optical lymphatic imaging. ACS Nano. 2007;1:258–264. doi: 10.1021/nn700062z. [DOI] [PMC free article] [PubMed] [Google Scholar]
- 13.Kobayashi H, Longmire MR, Ogawa M, Choyke PL. Rational chemical design of the next generation of molecular imaging probes based on physics and biology: mixing modalities, colors and signals. Chem Soc Rev. 2011;40:4626–4648. doi: 10.1039/c1cs15077d. [DOI] [PMC free article] [PubMed] [Google Scholar]
- 14.Haemel AK, Sadowski EA, Shafer MM, Djamali A. Update on nephrogenic systemic fibrosis: are we making progress? Int J Dermatol. 2011;50:659–666. doi: 10.1111/j.1365-4632.2010.04851.x. [DOI] [PubMed] [Google Scholar]
- 15.Hellman RN. Gadolinium-induced nephrogenic systemic fibrosis. Semin Nephrol. 2011;31:310–316. doi: 10.1016/j.semnephrol.2011.05.010. [DOI] [PubMed] [Google Scholar]
- 16.Zou Z, Zhang HL, Roditi GH, Leiner T, Kucharczyk W, Prince MR. Nephrogenic systemic fibrosis: review of 370 biopsy-confirmed cases. JACC Cardiovasc Imaging. 2011;4:1206–1216. doi: 10.1016/j.jcmg.2011.08.013. [DOI] [PubMed] [Google Scholar]
- 17.Longmire MR, Ogawa M, Choyke PL, Kobayashi H. Biologically optimized nanosized molecules and particles: more than just size. Bioconjug Chem. 2011;22:993–1000. doi: 10.1021/bc200111p. [DOI] [PMC free article] [PubMed] [Google Scholar]
- 18.Sedlakova P, Svobodova J, Miksik I, Tomas H. Separation of poly(amidoamine) (PAMAM) dendrimer generations by dynamic coating capillary electrophoresis. J Chromatogr B. 2006;841:135–139. doi: 10.1016/j.jchromb.2006.03.013. [DOI] [PubMed] [Google Scholar]
- 19.Shi X, Majoros IJ, Baker JR., Jr Capillary electrophoresis of poly(amidoamine) dendrimers: from simple derivatives to complex multifunctional medical nanodevices. Mol Pharmaceutics. 2005;2:278–294. doi: 10.1021/mp0500216. [DOI] [PubMed] [Google Scholar]
- 20.Kobayashi H, Brechbiel MW. Dendrimer-based nanosized MRI contrast agents. Curr Pharm Biotechnol. 2004;5:539–549. doi: 10.2174/1389201043376571. [DOI] [PubMed] [Google Scholar]
- 21.Kobayashi H, Brechbiel MW. Nano-sized MRI contrast agents with dendrimer cores. Adv Drug Deliv Rev. 2005;57:2271–2286. doi: 10.1016/j.addr.2005.09.016. [DOI] [PubMed] [Google Scholar]
- 22.Chen HT, Neerman MF, Parrish AR, Simanek EE. Cytotoxicity, hemolysis, and acute in vivo toxicity of dendrimers based on melamine, candidate vehicles for drug delivery. J Am Chem Soc. 2004;126:10044–10048. doi: 10.1021/ja048548j. [DOI] [PubMed] [Google Scholar]
- 23.Lim J, Guo Y, Rostollan CL, Stanfield J, Hsieh JT, Sun X, Simanek EE. The role of the size and number of polyethylene glycol chains in the biodistribution and tumor localization of triazine dendrimers. Mol Pharmaceutics. 2008;5:540–547. doi: 10.1021/mp8000292. [DOI] [PubMed] [Google Scholar]
- 24.Lim J, Mintzer MA, Perez LM, Simanek EE. Synthesis of odd generation triazine dendrimers using a divergent, macromonomer approach. Org Lett. 2010;12:1148–1151. doi: 10.1021/ol902669g. [DOI] [PMC free article] [PubMed] [Google Scholar]
- 25.Lim J, Pavan GM, Annunziata O, Simanek EE. Experimental and computational evidence for an inversion in guest capacity in high-generation triazine dendrimer hosts. J Am Chem Soc. 2012;134:1942–1945. doi: 10.1021/ja210122z. [DOI] [PubMed] [Google Scholar]
- 26.Lim J, Simanek EE. Triazine dendrimers as drug delivery systems: From synthesis to therapy. Adv Drug Deliv Rev. 2012;64:826–835. doi: 10.1016/j.addr.2012.03.008. [DOI] [PubMed] [Google Scholar]
- 27.Neerman MF, Zhang W, Parrish AR, Simanek EE. In vitro and in vivo evaluation of a melamine dendrimer as a vehicle for drug delivery. Int J Pharm. 2004;281:129–132. doi: 10.1016/j.ijpharm.2004.04.023. [DOI] [PubMed] [Google Scholar]
- 28.Simanek EE, Abdou H, Lalwani S, Lim J, Mintzer MA, Venditto VJ, Vittur B. The 8 year thicket of triazine dendrimers: strategies, targets and applications. Proc R Soc A. 2010;466:1445–1468. [Google Scholar]
- 29.Garzoni M, Cheval N, Fahmi A, Danani A, Pavan GM. Ion-selective controlled assembly of dendrimer-based functional nanofibers and their ionic-competitive disassemby. J Am Chem Soc. 2012;134:3349–3357. doi: 10.1021/ja206611s. [DOI] [PubMed] [Google Scholar]
- 30.Case DA, Darden TA, Cheatham TE, III, Simmerling CL, Wang J, Duke RE, Luo R, Walker RC, Zhang W, Merz KM, Robertson B, Wang B, Hayik S, Roitberg A, Seabra G, Kolossvary I, Wong KF, Paesani F, Vanicek J, Liu J, Wu X, Brozell S, Steinbrecher T, Gohlke H, Cai Q, Ye X, Wang J, Hsieh M-J, Cui G, Roe DR, Mathews DH, Seetin MG, Sangui C, Babin V, Luchko T, Gusarov S, Kovalenko A, Kollman PA. AMBER 11. University of California; San Francisco: 2010. [Google Scholar]
- 31.Dimelow RJ, Burton NA, Hillier IH. The dynamics of water exchange in gadolinium DOTA complexes studied by transition path sampling and potential of mean force methods. Phys Chem Chem Phys. 2007;9:1318–1323. doi: 10.1039/b617068d. [DOI] [PubMed] [Google Scholar]
- 32.Wang J, Wolf RM, Caldwell JW, Kollman PA, Case DA. Development and testing of a general amber force field. J Comput Chem. 2004;25:1157–1174. doi: 10.1002/jcc.20035. [DOI] [PubMed] [Google Scholar]
- 33.Jakalian A, Bush BL, Jack DB, Bayly CI. Fast, efficient generation of high-quality atomic Charges. AM1-BCC model: I. Method. J Comput Chem. 2000;21:132–146. doi: 10.1002/jcc.10128. [DOI] [PubMed] [Google Scholar]
- 34.Jakalian A, Jack DB, Bayly CI. Fast, efficient generation of high-quality atomic charges. AM1-BCC model: II. Parameterization and validation. J Comput Chem. 2002;25:1623–1641. doi: 10.1002/jcc.10128. [DOI] [PubMed] [Google Scholar]
- 35.Wang J, Wang W, Kollman PA, Case DA. Automatic atom type and bond type perception in molecular mechanical calculations. J Mol Graphics Model. 2006;25:247–260. doi: 10.1016/j.jmgm.2005.12.005. [DOI] [PubMed] [Google Scholar]
- 36.Jorgensen WL, Chandrasekhar J, Madura JD, Impey RW, Klein ML. Comparison of simple potential functions for simulating liquid water. J Chem Phys. 1983;79:926–35. [Google Scholar]
- 37.Cornell WD, Cieplak P, Bayly CI, Gould IR, Merz KM, Ferguson DM, Spellmeyer DC, Fox T, Caldwell JW, Kollman PA. A 2nd generation force-field for the simulation of proteins, nucleic-acids and organic-molecules. J Am Chem Soc. 1995;117:5179–5197. [Google Scholar]
- 38.Ryckaert J-P, Ciccotti G, Berendsen HJC. Numerical-integration of cartesian equations of motion of a system with constraints - molecular-dynamics of n-alkanes. J Comput Phys. 1977;23:327. [Google Scholar]
- 39.Krautler V, van Gunsteren WF, Hanenberger PH. A fast SHAKE: Algorithm to solve distance constraint equations for small molecules in molecular dynamics simulations. J Comput Chem. 2001;5:501. [Google Scholar]
- 40.Darden T, York D, Pedersen L. Particle mesh Ewald - an n.log(n) method for Ewald sums in large systems. J Chem Phys. 1993;98:10089–10092. [Google Scholar]
Associated Data
This section collects any data citations, data availability statements, or supplementary materials included in this article.


