

Abstract
Endothelial cell (EC) dysfunction is a key feature of multiple organ injury, the primary cause of fatality seen in critically ill patients. Although the development of EC dysfunction in the heart and lung is well studied in sepsis, it remains unclear in the liver. Herein, we report that liver sinusoidal ECs (LSECs; defined as CD146+CD45−) exhibit increased intercellular adhesion molecule-1 (CD54) and Fas in response to sepsis induced by cecal ligation and puncture (CLP). By using magnetically enriched LSEC (CD146+) populations, we show evidence of marked apoptosis, with a twofold decline in viable LSECs in CLP animals compared with sham controls. These changes and increased serum alanine aminotransferase levels were all mitigated in septic Fas−/− and Fas ligand−/− animals. Although we previously reported increased numbers of Fas ligand expressing CD8+ T lymphocytes in the septic liver, CD8+ T-cell deficiency did not reverse the onset of LSEC apoptosis/damage. However, Kupffer cell depletion with clodronate liposomes resulted in greater apoptosis and Fas expression after CLP and a decrease in glycoprotein 130 expression on LSECs, suggesting that STAT3 activation may protect these cells from injury. Our results document a critical role for death receptor–mediated LSEC injury and show the first evidence that Kupffer cells are essential to the viability of LSECs, which appears to be mediated through glycoprotein 130 expression in sepsis.
Sepsis is the leading cause of death in critically ill patients in intensive care units and arises from the development of multiple organ injury, for which treatment options are limited.1,2 Our laboratory studies murine polymicrobial sepsis [cecal ligation and puncture (CLP) method] and focuses on the liver to understand the pathophysiological characteristics of multiple organ injury. The liver is susceptible to sepsis-induced inflammation because escaping microbial antigens/mediators arising from the gastrointestinal tract of the septic animal pass through the liver.
Under normal conditions, the liver is considered to be immune tolerant (it does not respond to microbial or food antigens often derived from the portal blood system). Liver sinusoidal endothelial cells (LSECs), an important specialized cell population, contribute to maintaining liver immune tolerance.3–6 LSECs are the predominant population in the hepatic sinusoid and form a barrier between the hepatocytes and blood, which is separated by the space of Disse.4 Kupffer cells (KCs), the primary resident macrophage population of the liver, are also situated within the hepatic sinusoid and strategically sit on top of LSECs.4 LSECs and KCs often act as the first responders during inflammation and express classic pattern recognition receptors, such as toll-like receptor-4, along with other scavenger receptors.3,4,7 LSECs have a high endocytotic capacity; they can absorb acetylated low-density lipoprotein and act as antigen-presenting cells (APCs). They also express major histocompatibility complex class I and II, and costimulatory markers, CD80 and CD86.3–5
Importantly, unlike vascular endothelial cells (ECs), LSECs do not have an organized basement membrane and are fenestrated.4 These fenestrations allow for an exchange of nutrients in the parenchyma, and cross talk with hepatocytes.4 In fact, it has been proposed that the cross talk between hepatocytes and LSECs in the liver, are physiologically important for liver homeostasis, organogenesis, and regeneration.8,9 However, LSECs are difficult to isolate and study due to controversy in defining these cells.10 LSECs are also phenotypically different from vascular ECs, as LSECs are often characterized as CD146+CD45− or CD31+CD45− expressing cells.11–14 Although both KCs, and LSECs express Fas, it has been proposed that LSECs may undergo Fas-mediated apoptosis, making the liver, along with the retina of the eye, one of two characterized organs that has been shown to undergo Fas-mediated apoptosis.15–17
Our previous studies have shown that there is a twofold increase in the number of Fas ligand (FasL)–expressing CD8+ T cells in the liver, 24 hours after CLP, and a significant increase in the number of apoptotic and/or necrotic nonleukocytic cells. Unfortunately, it still remains unclear as to what cell types are undergoing apoptosis and how this process is regulated.18,19
The endothelium acts as an initial line of defense against invading pathogens, and it regulates vascular tone and permeability. Therefore, EC dysfunction is a significant problem in sepsis. However, most of what we understand is derived from nonhepatic vascular beds and cell lines, with few studies focusing on hepatic endothelium dysfunction in septic models.20–26 Because injured ECs detach from their basement membrane, and circulate freely throughout the bloodstream, there has been great debate as whether endothelial apoptosis can be detected in vivo during sepsis.23,27 In this study, we have attempted to determine if LSECs undergo apoptotic cell death during sepsis and what controls this process and the degree to which these changes are associated with liver injury. We found that KCs are physiologically relevant to LSEC biological characteristics and protect LSECs and, indirectly, hepatocytes from further injury during septic inflammation.
Materials and Methods
Animals and Animal Use
All experiments conducted with animals in this study have been approved by the animal care use committee (No. 0053-10) at Rhode Island Hospital, Providence, RI and conform to the laboratory animal care guidelines set forth by the NIH. Age-matched (6 to 8 weeks) male mice were ordered from Jackson Laboratories (Bar Harbor, ME) for C57/BL6 wild-type (BL6), FasL-deficient (FasL−/−, Stock number: 1021), Fas deficient (Fas−/−, Stock number: 000482), and CD8 deficient animals (CD8−/−, Stock Number: 002665).
Cecal Ligation and Puncture
Male mice were anesthetized using isoflurane. A 1- to 2-cm midline incision was made below the diaphragm. The cecum was exposed, ligated with a sterile silk thread, and punctured twice with a 22-gauge needle. One puncture occurred at the site closest to the ligation, whereas the other puncture was made at a site distal from the ligation. After puncturing, fecal material was allowed to extrude into the abdominal cavity. The wound site was numbed with lidocaine, and the viscera and skin layers were sewn back in place with a 6.0 nylon silk suture. Sham controls were exposed to the same surgery; however, their cecum was neither ligated nor punctured. The animals were resuscitated with 1.0 mL of lactate ringer’s solution subcutaneously.28
NPC Isolation
Animals were sacrificed by CO2 asphyxiation, 24 hours after CLP/sham. The liver was then perfused with a collagenase IV (Sigma-Aldrich, St. Louis, MO) buffer [1% collagenase IV from Clostridium histolyticum and 0.02% DNase I in 10 mmol/L HEPES-NaOH (pH 7.4), 150 mmol/L NaCl, 5 mmol/L KCl, 1 mmol/L MgCl2, and 1.8 mmol/L CaCl2 in 1× PBS]. After perfusion, the liver was excised, minced, and digested for 30 minutes at 37°C. The collagenase was neutralized by ice-cold 1× PBS, and the hepatocytes were separated by slow centrifugation at 30 × g for 10 minutes. The supernatants were then spun at 300 × g for 10 minutes to pellet the nonparenchymal cell (NPC) fraction. The pellet was resuspended in Dulbecco’s modified Eagle’s medium complete (10% fetal bovine serum and 500 μg/mL gentamicin), layered on top of 30% Histodenz (Sigma-Aldrich), and spun at 1650 × g for 25 minutes at 4°C; cells at the interface layer were collected, washed, and counted.11
Staining for LSECs
NPCs were blocked with Fc blocker (CD32/CD16; BioLegend, San Diego, CA), 0.2 μg/μL, for 15 minutes at 4°C and stained for extracellular markers, anti–mouse CD45–phosphatidylethanolamine (PE) Cy7 (eBioscience, San Diego) and anti–mouse CD146-PE (BioLegend) or anti–mouse CD31-PE (eBioscience) for 45 minutes at 4°C. Isotype controls were also stained at the same time, as indicated by each manufacturer. For intercellular adhesion molecule (ICAM)-1 staining, CD54 (ICAM-1)-allophycocyanin (APC) (BioLegend) was used in combination with CD45-PE Cy7 and CD146-PE. For Tie2 staining, CD202b biotin (eBioscience) was combined with CD146-PE and CD45-PE Cy7 for 30 minutes at room temperature, and then streptavidin-APC was added for 15 minutes at 4°C. For Fas staining, Fas biotin (eBioscience) was combined with CD146-PE and CD45-PE Cy7 for 30 minutes at room temperature, and then streptavidin-APC was added for 15 minutes. For glycoprotein 130 (gp130) staining, gp130-APC (eBioscience) was combined with CD146-PE and CD45-PE Cy7 for 45 minutes at 4°C. After staining, cells were washed and then resuspended in staining buffer, and read at 50,000 events on a BD FACSArray (BD Biosciences, San Jose, CA). Fluorescence-activated cell sorter analyses were prepared by FlowJo software (Tree Star Inc., Ashland, OR).
Magnetic Bead LSEC (CD146+) Enrichment
The single NPC suspension was isolated and processed as previously described in NPC isolation section. Liver CD146+ cells from the NPC population were purified and separated by positive-selection magnetic beads.29 Phenotype and purity were determined by flow cytometry staining with a CD146-PE antibody and a CD31-PE antibody, and read at 50,000 events on a BD FACSArray.
Annexin V Staining of LSECs
The cells were initially stained as previously described with extracellular LSEC phenotypic markers for CD146, CD31, and CD45. After staining for extracellular phenotypic markers (45 minutes at 4°C), the cells were washed and stained with Annexin V–APC (BD Biosciences) for 15 minutes at room temperature in 1× Annexin V binding buffer. Cells were washed again after staining, and read at 50,000 events on a BD FACSArray.
TEM of Enriched LSECs
After magnetic bead enrichment, LSECs were washed, counted, and spun down.29 The pellets were fixed with 2.5% glutaraldehyde, washed, and postfixed with 1% osmium tetroxide. After postfixation, pellets were rinsed, dehydrated, infiltrated, and embedded in Spur’s epoxy resin. Ultrathin sections (50 to 60 nm thick) were prepared and retrieved onto 300 mesh copper grids. Sections were examined using a Morgagni 268 microscope (FEI Company, Hillsboro, OR), and images at ×7100 magnification were collected with an AMT Advantage 542 charge-coupled device camera system. For the quantification of TEM, random fields were taken at ×3500 magnification from sham and CLP samples. Cells within each field were then characterized into three categories: apoptotic, normal, and undeterminable status. Apoptotic cells were classified by hallmark morphological characteristics to the nuclei and cytoplasm.30 The percentage apoptotic cells per total cell number in a given field was calculated, and the values are expressed as means ± SEM for 10 fields per group.
In Situ Staining
Livers were perfused with PBS in situ and excised from C57/BL6 animals after sham and/or CLP surgery. Representative tissue sections were then fixed in 10% formalin and embedded in paraffin. Tissue sections (6 μm thick) were cut and mounted onto glass slides (Paul Monfils; Core Research Laboratories, Rhode Island Hospital, Providence, RI), and set aside for staining.
For TUNEL staining, rehydrated (xylene, 100%, 95%, and 70% ethanols, and distilled water) paraffin slides underwent epitope antigen retrieval in citrate buffer (Dako Agilent Technologies, Carpentaria, CA) for 20 minutes. After antigen retrieval, slides were permeabilized with 0.1% Triton X-100 and rinsed with distilled water, and an in situ cell death mix solution (dilution, 1:100, provided by Roche Applied Science, Indianapolis, IN) was added for 1 hour at 37°C. Slides were then washed in PBS and stained for CD146, an endothelial marker.
For CD146 (endothelial) staining, slides were washed in PBS and blocked overnight in 5% goat serum at 4°C. After blocking, slides were then washed again, blocked with avidin D–biotin (a kit provided by Vector Laboratories, Inc., Burlingame, CA), and stained with anti-CD146 (1:100, ab75769; Abcam, Inc., Cambridge, MA) overnight at 4°C. The next day, slides were washed again in PBS, and a secondary antibody (1:1000; anti-rabbit Alexa Fluor 594, provided as a gift from Dr. Reichner) was added for 1 hour at room temperature.
Slides were then coverslipped and mounted with Vectashield (Vector Laboratories, Inc.), including a DAPI stain. Images were acquired with a Nikon C1si confocal microscope (Nikon Inc., Melville, NY) using diode lasers 402, 488, and 561. Serial optical sections were performed with EZ-C1 computer software (Nikon Inc.). Z-series sections were collected at 0.25 μm with a 60× PlanApo lens and a zoom of 2. Each wavelength was acquired separately by invoking frame lambda. Images were processed with Elements computer software (Nikon Inc.).
Vascular Leakage Assay
At 24 hours after sham and/or CLP surgery was performed, animals were i.v. injected with 0.2 mL of Evans Blue Dye (EBD; 0.5% w/v; Sigma-Aldrich). After 15 minutes, the animals were euthanized and the liver tissue was perfused with 1× PBS, weighed, and extracted in formamide at 37°C for 48 hours. Serum samples were also collected. Extracted tissue samples were spun down at 500 × g, and the supernatants were read on a spectrophotometer at 610 nm. The tissue EBD concentration (mg/mL) was determined by the OD readings and compared with the standard curve. Data are expressed by determining the OD concentration value of the tissue (mg/mL), normalized to the OD concentration collected in serum (mg/mL).12
KC Depletion
Clodronate and PBS control liposomes were obtained from Dr. Nico van Rooijen (Department of Molecular Cell Biology, Vrije Universiteit, Amsterdam). Clodronate and PBS liposomes were vortex mixed and diluted 1:5 with 1× PBS, then injected i.v. into C57BL/6 animals. Two days later, CLP and/or sham surgery was performed, as previously mentioned.31,32
IL-6 Enzyme-Linked Immunosorbent Assay and ALT Levels of Mouse Serum
Whole blood samples were collected by cardiac puncture, using heparinized needles, from animals 24 hours after surgery, and spun down at 9300 × g for 10 minutes. For IL-6, serum levels were detected by an antibody-paired kit from BD Biosciences, and read at an absorbance of 405 nm on a BioRad Benchmark Plus microplate spectrophotometer (Bio-Rad Laboratories, Hercules, CA). For alanine aminotransferase (ALT) levels, serum was detected by a kit (Biotron Diagnostics, Hemet, CA), and read at an absorbance of 540 nm. Normal ranges for ALT are 5 to 30 U/L, with the linear limit at 130 U/L.
Statistical Analysis
Analyses were conducted by GraphPad Prism version 5 (GraphPad Software, Inc., La Jolla, CA) and graph data are shown as means ± SEM. Significant differences were established between groups when P ≤ 0.05, as calculated based on statistical tests; a Mann-Whitney U-test/rank sum nonparametric test for two groups; and a nonparametric one-way analysis of variance to test for the presence of a significant difference for more than two groups, along with a Holms-Sidak multiple comparisons test to quantify significant differences between groups.
Results
LSEC Isolation and Phenotyping from Septic and Nonseptic Animals
We first decided to determine the frequency and number of LSECs in the NPC population through flow cytometry. Our gating strategy for LSECs was based on published flow cytometric dot-plot approaches (Figure 1, A and B). We gated on the general NPC population by side scatter versus forward scatter, followed by delineation of LSECs with the markers, CD31 or CD146, as previously reported.11–14 Monocytes, granulocytes, and leukocytes also express CD31; therefore, CD146 (or melanoma cell adhesion molecule) has been reported as a more specific marker for hepatic sinusoidal endothelium.14,33 The CD146 marker has also been shown to associate with the endothelial junctions and actin cytoskeleton.33 Because some resident T cells express CD146, we excluded leukocytes with CD45 staining (ie, CD146+CD45−) Figure 1B). We observed that there were no differences in percentage between CD146+CD45− and CD31+CD45− expressing cells in the liver taken from Sham and CLP animals (Figure 1B and C), and considered the CD31+CD45− staining as a positive control for CD146+CD45− expressing cells. These defined LSEC populations (CD146+CD45− or CD31+CD45−) constitute for 24.39 ± 7.51% (Sham), and 23.91 ± 10.68% (CLP; means ± SD) of the total NPC population (Figure 1B and C). To further verify that the LSEC populations of interest (by staining for CD146+CD45− and CD31+CD45−) were indeed ECs, we validated that they expressed an additional endothelial cell marker, Tie2. Our gated LSEC populations (populations stained with CD146+CD45− or CD31+CD45−) did express Tie2, as seen with three-color staining (Figure 1, D and E). Ebrahimkhani et al34 recently also confirmed Tie2 as a marker for LSECs; this cell population was sorted by a flow cytometer as CD11b−Tie2+ expressing cells. Herein, because both the Tie2 expression and CD31+CD45− staining confirmed the CD146+CD45− staining, in the context of this study, we defined our LSEC population as CD146+CD45− expressing cells.
Figure 1.

LSEC phenotyping from sham and CLP BL6 animals. A: Typical gating strategy for NPCs stained for LSEC markers, using side scatter versus forward scatter. B: Representative dot plot of CD146+CD45−-expressing cells based on CD45 versus CD146 fluorescence staining intensity, which consist of approximately 25% to 30% NPCs. C: Representative dot plot of CD31+CD45−-expressing cells that are approximately 22% to 30% of NPCs. D: There is no difference in Tie2 expression of gated CD146+CD45− cells between CLP BL6 and sham BL6 animals. E: Tie2 expression of gated CD31+CD45−-expressing cells (n = 3 to 5 per group). P > 0.05, determined by the Mann-Whitney U-test. Data are expressed as means ± SEM.
LSECs Are Activated during Sepsis
Previous studies have shown that inflammation causes a direct increase of activation or adhesion molecule expression, such as ICAM-1 and vascular adhesion molecule-1, on sinusoidal endothelium in rat CLP models.35 We wanted to establish whether ex vivo LSECs showed evidence of activation after the onset of polymicrobial sepsis. We observed herein that CLP induced a marked increase in ICAM-1 expression on LSECs (gated on CD146+CD45− cells) at 24 hours by three-color staining (Figure 2A). The increased expression of ICAM-1 on the LSEC population suggests that the sinusoidal endothelium is activated by direct interaction of leukocytes during sepsis. In addition, we observed that the LSECs (gated on CD146+CD45− cells) exhibited an increase of the Fas death receptor (an apoptosis signaling molecule) 24 hours following CLP when compared to sham controls (Figure 2B). We also saw similar increases of Fas in the CD31+CD45− population (data not shown). The marked increase of Fas on the LSEC population is an interesting result, because the Fas receptor has been reported to be a marker of activation and an indicator of LSEC apoptosis.15,17
Figure 2.
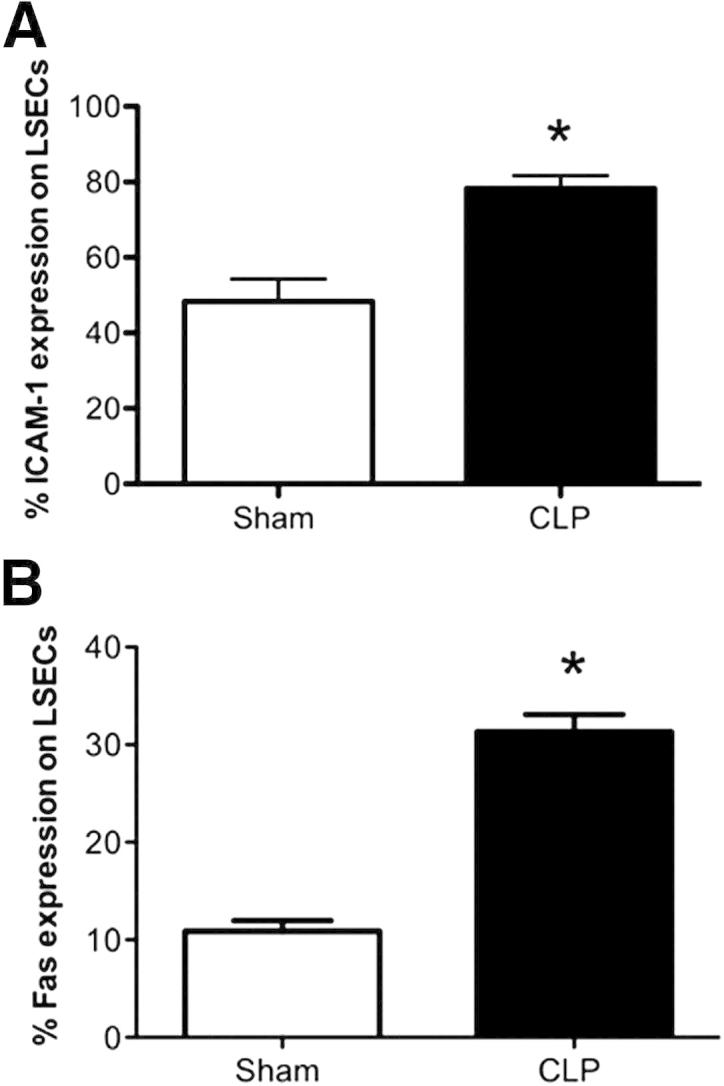
The LSEC population is activated after CLP. A: There is an increase of ICAM-1 (CD54) expression on LSECs (gated on CD146+CD45−-expressing cells) after CLP (n = 9 per group). B: There is an increase of Fas expression on LSECs (gated on CD146+CD45−-expressing cells) after CLP (n = 4 to 6 per group). *P < 0.01 for CLP BL6 versus sham BL6. P values were determined by a nonparametric Mann-Whitney U-test. All data are expressed as means ± SEM.
Sepsis Causes an Increase of Liver Tissue Permeability and Injury in Situ
Because the septic mouse NPCs had an increase of Fas expression on our defined LSEC population (CD146+CD45− expressing cells), we wanted to determine whether these cells were undergoing apoptosis during sepsis. However, when we simply examined the total NPC population for its expression of the early apoptotic marker, Annexin V, and total cell yield, we noted a modest declining trend in total NPC number as opposed to elevated Annexin V in the CLP mice (these differences were not statistically significant) (Figure 3, A and B). We did notice, however, that there was a significant increase of protein vascular leakage in whole liver tissue, as assessed by Evans Blue Dye (Figure 3C). This suggests that the sinusoidal endothelium had an increased permeability, and was undergoing some form of injury during CLP. We then decided to examine the sinusoidal endothelium in situ for indices of injury during sepsis. Herein, we stained sinusoidal endothelium for CD146 (EC marker) and TUNEL (apoptotic marker). The CD146 marker, which appears red, lines along the sinusoidal space and stains ECs (Figure 3D). Both sham and CLP liver tissue sections had CD146+ ECs within their sinusoidal spaces (Figure 3, D and E). There were decreased sinusoidal spaces in the CLP liver sections and decreased ECs present within these spaces. There was also more TUNEL staining of the actual ECs present in the CLP liver tissue (Figure 3E) sections compared with shams (Figure 3D). Although these qualitative data were encouraging, we decided to isolate the LSECs ex vivo to further clarify the nature of their developing dysfunction in response to sepsis.
Figure 3.

There is an increase of liver tissue permeability and in situ EC injury in sepsis. A: There is no change in NPC numbers between sham and CLP BL6 animals before magnetic enrichment. B: There is a 10% difference in Annexin V between sham and CLP BL6 LSECs (gated on CD146+CD45−-expressing cells) before enrichment (n = 5 to 6 per group). C: There is more albumin protein leakage, as assessed by Evans Blue Dye in liver tissue taken from CLP BL6 versus sham BL6 animals. *P < 0.05 (n = 4 to 6 per group), determined by a nonparametric Mann-Whitney t-test. All data are expressed as means ± SEM. Confocal immunofluorescence representative images of sham (D) and CLP (E) liver tissue sections. Original magnification, ×60. Liver tissue sections were stained with CD146 (red; EC marker), TUNEL (green; apoptosis), and DAPI (blue; nuclei). D: Gray arrows indicate sinusoidal ECs (red) from sham tissue sections and their nuclei (blue). E: White arrows indicate TUNEL-positive ECs (green and red) from CLP tissue sections and their nuclei (blue). There is greater TUNEL-positive staining in CLP sinusoidal endothelium compared with sham controls.
Enriched LSECs Undergo Apoptosis in Sepsis
Concerned that the changes in the LSECs might be diluted in the whole NPC isolation, we chose to enrich for CD146+ (by positive magnetic bead selection) from the NPC fraction, and subsequently stained for Annexin V. We determined the purity for our enriched CD146+ cells to be >80% (CD146+CD45−) and 90% (CD31+CD45−) (Figure 4A) by flow cytometry. By staining for Annexin V on gated CD146+CD45− (Figure 4C) and CD31+CD45− (Figure 4D) populations, we found that both exhibited a significant increase in Annexin V after CLP compared with sham animals, indicating that LSECs undergo apoptosis during sepsis. More important, we noted that this increase in Annexin V staining on the CLP mouse LSECs was associated with a marked decline in the total enriched CD146+ cell number when compared with sham (Figure 4B). It should also be appreciated that the high Annexin V baseline staining is likely attributed to the processing and manipulation of the liver, which occurs when isolating and enriching for the LSECs. When we stained naïve BL6 background animals for Annexin V, we see similar (20% to 30%) Annexin V staining levels to those of sham controls (Figure 4, C and D). The CD146+CD45− and CD31+CD45− staining of the enriched CD146+ cells were comparative in frequencies between sham and CLP; thus, we decided (for the ease of presentation) to show only the CD146+CD45− (defined as enriched LSECs) staining in the subsequent figures (Figures 5, 6, and 7).
Figure 4.

Enriched LSECs exhibit increased apoptosis during sepsis. A: Representative dot plots taken from sham CD146+-enriched LSECs stained with CD146+CD45− or CD31+CD45− to indicate isolation purity. B: CD146+-enriched LSEC number decreases in CLP compared with sham (n = 4 to 6 per group). C and D: Annexin V+ increases in CLP CD146+-enriched LSECs stained for CD146+CD45− and CD31+CD45− versus sham controls (n = 5 to 6 per group). Dashed line represents naïve Annexin V baseline level. E: TEM representative images of CD146+-enriched LSECs from CLP versus sham BL6 animals. Original magnification, ×7100. There are more nuclei with condensed chromatin in crescent formation and cytoplasmic blebbing (arrows) in CLP CD146+-enriched LSECs, compared with sham. F: Quantification of apoptotic enriched LSECs from sham (left panel) and CLP (right panel) animals. Random fields were scored and considered to be apoptotic if they had classic morphological changes to nuclei and cytoplasm. Original magnification, ×3500. The percentage of apoptotic cells per total number of cells in a given field was determined (n = 10 per group). *P < 0.05. P values were determined by a nonparametric Mann-Whitney U-test. All data are expressed as means ± SEM.
Figure 5.

Enriched LSEC apoptosis is Fas dependent. A: Annexin V staining decreased in CD146+-enriched LSECs from CLP Fas−/− animals versus CLP BL6 animals (n = 4 to 6 per group). Dashed line represents naïve Annexin V baseline level. B: There is a decrease in CD146+-enriched LSEC number after CLP versus sham controls. Cell numbers are restored to higher levels in the CLP Fas−/− animals after enrichment versus CLP BL6 animals (n = 6 to 8 per group). C: ALT levels decreased in CLP Fas−/− animals versus CLP BL6 animals (n = 5 to 9 per group). ALT levels increased in CLP BL6 animals versus sham. *P < 0.05 for CLP BL6 versus sham BL6; †P < 0.05 for CLP Fas−/− versus CLP BL6. P values were determined by a nonparametric one-way analysis of variance test. Data are expressed as means ± SEM.
Figure 6.

Enriched LSEC apoptosis decreases in FasL-deficient animals. A: Annexin V staining trends toward a decrease in CD146+-enriched CLP FasL−/− LSECs versus CLP BL6 LSECs; however, the P value was not significant (n = 4 to 6 per group). Dashed line represents naïve Annexin V baseline level. B: Enriched LSEC numbers decrease in CLP BL6 animals versus sham controls, and are restored back to sham BL6 in CLP FasL−/− animals (n = 6 to 8 per group). C: ALT levels increased in CLP BL6 animals versus sham controls, and the ALT levels decreased in CLP FasL−/− animals versus CLP BL6 animals (n = 5 to 9 per group). *P < 0.05 for CLP BL6 versus sham BL6; †P < 0.05 for CLP FasL−/− versus CLP BL6. Data are expressed as means ± SEM. P values were determined by a nonparametric one-way analysis of variance test.
Figure 7.

CD8+ T cells play a minor role in instigating apoptosis of enriched LSECs. A: There is a decrease of Annexin V in CD146+-enriched LSECs from CLP BL6 animals versus sham; however, there is no change in Annexin V staining between CLP CD8−/− versus CLP BL6 (n = 6 to 8 per group). Dashed line represents naïve Annexin V baseline level. B: There is a decrease in the overall cell number of enriched CD146+ LSECs in CLP BL6 versus sham controls. C: Serum ALT levels increased in CLP BL6 versus sham controls; however, there is no change between CLP CD8−/− and CLP BL6 animals (n = 5 to 9 per group). P value is for CLP BL6 versus sham BL6. P values were determined by a nonparametric one-way analysis of variance test. Data are expressed as means ± SEM. *P < 0.05.
Once we had established that the enriched (CD146+) LSEC population appears to exhibit early evidence of apoptosis, shown by increased Annexin V staining, we thought it was important to evaluate if actual morphological apoptotic changes existed between enriched LSEC populations from sham and CLP animals. Our representative TEM images indicated that there was generally more nuclear fragmentation, chromatin condensation, and cytoplasmic blebbing in CLP CD146+-enriched LSECs compared with sham controls (Figure 4, E and F). Quantification of the TEM data indicated that the percentage of morphologically apoptotic cells was increased in LSECs isolated from CLP animals (Figure 4F), further supporting our earlier Annexin V staining findings that imply LSECs exhibit increased apoptosis during sepsis.
Fas-Induced Apoptosis of LSECs during Sepsis
Because we observed an increase in LSEC Fas expression, we next decided to see if CLP-induced LSEC apoptosis was altered in Fas genetically deficient animals. In this set of experiments, we observed a significant decrease in Annexin V+ staining in the CLP Fas−/− mice (Figure 5A) and an increase in the total cell numbers after CD146+ enrichment compared with CLP BL6 mouse cells (Figure 5B). Overall liver injury, as assessed by ALT levels, also decreased in the CLP Fas−/− animals compared with CLP BL6 mice (Figure 5C). These data demonstrate that LSEC apoptosis is mediated by Fas ligation.
To further support our observations, we subsequently examined Annexin V staining of CD146+-enriched LSECs after CLP in BL6 and FasL−/− animals. Herein (Figure 6A), although we observed a marked increase in Annexin V on CD146+-enriched LSECs of CLP BL6 compared with sham, no such increase was seen of Annexin V staining on CD146+-enriched LSECs of CLP FasL−/− animals compared with sham FasL−/− cells. However, not statistically different from either sham or CLP BL6 Annexin V staining levels, the FasL-deficient LSECs were not affected (ie, not increased in Annexin V staining) by CLP in the same manner as the CLP BL6 mice. Further support for this observation can be seen in the changes in cell numbers between the enriched CD146+ LSECs themselves, because the number of LSECs in BL6 animals decreased substantially after CLP (Figure 6B), compared with equivalent background sham BL6 controls. However, the cell numbers of CD146+-enriched LSECs from CLP FasL−/− animals were similar to sham controls of FasL−/− animals and BL6 mice (Figure 6B). Although apoptosis of enriched CD146+ LSECs was unaffected in CLP FasL−/− animals, we also wanted to assess if liver tissue injury was affected by measuring ALT enzyme levels. ALT levels decreased in CLP FasL−/− compared with CLP BL6 animals, which, again, implied that FasL gene deficiency plays an indirect role in LSEC injury and/or apoptosis, and has a global effect on liver tissue parenchymal injury. The Annexin V staining levels on CD146+-enriched LSECs from sham and CLP Fas−/− and FasL−/− animals were fairly similar. Collectively, these data suggest that direct forms of LSEC injury occur because of Fas gene deficiency compared with FasL deficiency, which might be mediated through various FasL effector cells.
CD8+ T Cells Do Not Appear to be Sufficient to Instigate Fas-Mediated LSEC Apoptosis during Sepsis
Because we had previously reported an increase in the number of liver CD8+ cells expressing increased levels of FasL in response to CLP, we attempted to determine whether the LSEC apoptotic changes are instigated by CD8+ T cells.18 We compared CD146+-enriched LSECs for Annexin V in CD8−/− and BL6 animals. Herein, we noticed that, although there was a declining trend in Annexin V staining in CLP CD8−/− compared with CLP BL6 animals, it was not statistically significant between the CLP and sham CD8−/− groups (Figure 7A). However, the Annexin V staining on CD146+-enriched LSECs from CLP CD8−/− animals did trend toward an increase compared with sham CD8−/− controls. We further observed that the actual cell yields of CD146+-enriched LSECs in the CLP CD8−/− animals did not improve to the same extent as seen in the CLP Fas and FasL−/− animals (Figure 7B), suggesting that CD8+ T cell by LSEC interactions alone are not sufficient to account for modulating Fas-FasL–mediated LSEC apoptosis during sepsis. Similarly, with the observed lack of significant difference between CLP CD8−/− and CLP BL6 LSEC Annexin V staining, there was also no change in ALT levels between CLP CD8−/− and CLP BL6 (Figure 7C). These observations further validated our earlier conclusion that CD8+ T cells alone play a minor role in LSEC injury and/or cell death and, perhaps, require the combined effects of inflammation, along with the actions of other neighboring leukocytes, to mediate their effects on LSECs and overall liver tissue injury (Figure 7C).
KCs Protect LSECs from Sepsis-Induced Injury
Once we determined that CD8+ T cells were not the only cells contributing to LSEC injury, as originally thought (Figure 7), we decided to determine what role other neighboring leukocytes play in the induction of LSEC apoptosis during sepsis. KCs are anatomically situated close to LSECs. It has been previously reported that KCs and LSECs recognize lipopolysaccharide (LPS) and secrete IL-6 during endotoxin-induced infections.36,37 Because KCs are physiologically relevant to LSEC biological features within the hepatic sinusoid, we sought to determine what role they play in Fas-mediated apoptosis of LSEC during sepsis.
We depleted KCs (F4/80+, resident macrophage populations) by injecting clodronate liposomes i.v., 2 days before surgery. By the third day, the blood monocytes/macrophages have had time to reconstitute, whereas the KCs still had not differentiated.31,32 We confirmed that we had substantially reduced F4/80+CD11b− stained cells in the NPC populations taken from sham and CLP BL6-clodronate–treated animals by flow cytometry (Figure 8A). KCs usually comprise approximately 15% to 20% of the total NPC fraction; however, with clodronate liposomal treatment, this NPC F4/80+CD11b− population decreased to <5% (Figure 8A). We did not observe significant differences between the sham and CLP PBS control liposome-injected animals, indicating that the liposomes themselves did not affect the overall percentage of liver KCs (F4/80+CD11b− population), which remained at approximately10% (Figure 8A).
Figure 8.

Confirmation of KC depletion in sham and CLP animals. A: Representative dot plots of NPCs taken from naïve untreated, sham, and CLP animals that were injected with either PBS control or clodronate liposomes. Sham and CLP-clodronate–treated NPCs were taken from the unenriched fractions, and stained for F4/80 and CD11b. F4/80+CD11b− (KC) cells account for 15% to 20% of the total NPC population, and decrease to <5% with clodronate treatment. B: Representative dot plot of CD146+-enriched LSECs from sham and CLP-clodronate–treated animals; purity is unaffected by liposomes.
On establishing that we could deplete KCs in the liver, we then confirmed that liposomal treatment did not have adverse effects on the isolation purity of enriched LSECs (Figure 8B). We then stained CD146+-enriched LSECs from CLP-clodronate–treated and CLP PBS control animals with Annexin V. We observed that there was a significant increase of Annexin V staining on CD146+-enriched LSECs from CLP-clodronate–treated animals, compared with CLP PBS control animals (Figure 9A). There was also a decline in the overall CD146+-enriched LSEC numbers from CLP-clodronate–treated animals, compared with CLP PBS control mice, indicating that, in the absence of KCs, LSECs were more prone to apoptosis (Figure 9B).
Figure 9.

KCs protect enriched LSECs from sepsis-induced injury through gp130 expression. A: There is increased Annexin V staining in CD146+-enriched LSECs from CLP-clodronate–treated animals versus CLP PBS controls (n = 3 to 6 per group). Dashed line represents naive Annexin V baseline level. B: There is a decrease in the number of CD146+-enriched LSECs from CLP-clodronate–treated animals compared with CLP PBS controls (n = 6 to 7 per group). C: There is an increase of ICAM-1 expression on CD146+-enriched LSECs from CLP-clodronate–treated animals versus CLP PBS controls, and sham-clodronate–treated animals (n = 3 to 5 per group). D: There is no change in Fas expression between CD146+-enriched LSECs from CLP-clodronate–treated animals versus CLP PBS control animals (n = 3 to 5 per group). E: gp130 Expression significantly decreases on CD146+-enriched LSECs from CLP-clodronate–treated animals compared with CLP PBS controls (n = 3 to 6 per group). F: IL-6 cytokine serum levels decrease in CLP-clodronate–treated animals compared with CLP PBS controls (n = 6 to 11 per group). G: ALT enzyme levels increase in CLP-clodronate–treated animals compared with CLP PBS controls (n = 6 to 11 per group). *P < 0.05 for CLP PBS versus sham PBS; †P < 0.05 for CLP-clodronate–treated animals versus CLP PBS controls; and ‡P < 0.05 for CLP-clodronate versus sham-clodronate–treated mice. P values were determined by a nonparametric one-way analysis of variance test, followed by a Holms-Sidak multiple comparisons test. All data are expressed as means ± SEM.
KCs express Fas, and on activation with endotoxin, they have also been reported to up-regulate FasL.17 We wanted to test how Fas expression of LSECs was affected in the absence of KCs. Thus, we decided to determine whether the Annexin V staining and/or apoptotic effects of enriched CD146+ LSECs from CLP-clodronate–treated animals was due to Fas expression. We stained enriched CD146+ LSECs for Fas from CLP-clodronate–treated and CLP PBS control animals and did not see significant changes in Fas expression between CLP-clodronate–treated and CLP PBS control cells (Figure 9D). However, we did notice that CD146+-enriched LSECs had a greater expression of ICAM-1 in CLP-clodronate–treated animals compared with CLP PBS controls (Figure 9C). Because there is a direct loss of KCs by clodronate, infiltrating inflammatory monocytes and neutrophils overcompensate for their loss, and have increased interactions with the sinusoidal endothelium. Collectively, these data suggests that, in the absence of KCs, LSECs still demonstrate increased Fas expression during sepsis and are subjected to Fas-stimulated apoptosis and injury.
IL-6 is a multifunctional cytokine and one of the acute-phase proteins that are predominately produced in the liver.8 Although KCs and hepatocytes are the main producers of IL-6 in the liver, IL-6 secretion is also heavily regulated by the IL-6 receptor or gp130.7 We wanted to determine whether CD146+-enriched LSECs from clodronate-treated animals still had the ability to respond to IL-6. We stained CD146+-enriched LSECs for gp130. Interestingly, we found that CD146+-enriched LSECs from CLP-clodronate–treated animals had decreased gp130 (IL-6 receptor β) (Figure 9E). As a result, these CD146+-enriched LSECs from CLP-clodronate–treated animals were less protected from apoptosis and overall liver tissue injury (increased ALT enzyme levels in CLP-clodronate–treated animals compared with CLP PBS controls) (Figure 9G). The decrease in gp130 expression of enriched CD146+ cells correlates to the systemic IL-6 cytokine levels in CLP-clodronate–treated animals (Figure 9F). In the absence of KCs, the secretion of IL-6 into the blood decreases, further suggesting that KCs alone help to protect LSECs from septic-induced injury.
Discussion
The liver is a critical organ that regulates host metabolism and blood detoxification and maintains a functional immune response to exogenous infectious challenge. The liver also frequently becomes dysfunctional in response to insults, such as shock-associated injury and/or sepsis. These injuries contribute to the morbidity associated with multiple organ failure seen in critically ill patients.8,38 However, although significant strides have been made to understand the function and contribution of liver macrophages and/or hepatocytes in the pathophysiological changes leading to liver dysfunction during sepsis, few studies have investigated ex vivo LSEC function.24–26 It has been well established that ECs play a role in the inflammatory response; however, most of this knowledge is based on work done with ECs in vascular beds outside the liver.21,23 The inability to readily isolate and characterize LSECs, and to assess their response ex vivo to infectious sepsis-associated stimuli, made them a more challenging cell population to investigate.10 The goal of this study was to determine whether hepatic endothelial activation and damage contributes to liver injury seen in septic animals and how this might be regulated. We found that LSECs undergo Fas-mediated apoptosis during sepsis and are protected by KCs through their gp130 expression.
We initially hypothesized that infiltrating FasL-expressing CD8+ T cells instigate apoptosis of neighboring LSECs through the engagement of their Fas receptor. This was based on our previous finding that there was a twofold increase of FasL-expressing liver CD8+ T cells after sepsis.18 To test this concept, we first phenotypically defined LSEC populations (CD146+CD45−), as shown in Figure 1B, and confirmed that the actual LSEC population was of an endothelial lineage, with CD31 and Tie2 expression (Figure 1, C and D). We then determined that they underwent apoptosis in response to septic challenge in situ and ex vivo (Figures 3D, 3E, and 4C). We also examined whether CD8+ T cells influence the development of LSEC injury and apoptosis. Our results from this study indicate that LSEC dysfunction (as it relates to activation, injury, and apoptosis) does occur in the hepatic sinusoid during sepsis (increases in ICAM-1, Fas, and Annexin V) (Figures 2 and 4). However, the process is mainly dependent on Fas expression of LSECs (Figures 5 and 6) and regulated by KCs (Figure 9). CD8+ T cells, however, play a minor role (Figure 7), whereas KCs help to decrease the associated detrimental effects of sepsis and Fas-induced injury on LSECs by secreting IL-6 and engaging gp130 (Figure 9).
Instead of pinpointing the CD8+ T cells as a culprit for Fas-mediated LSEC cell death, we should consider that CD8+ T cells actually prime the EC, and enhance Fas-induced effects. Their interaction with LSECs remains unique; LSECs act as APCs and initially prime CD8+ T cells outside of the context of inflammation.6 Kennedy et al39 have shown that antigen-induced liver damage by infiltrating CD8+ T cells can be mediated in an Fas-dependent manner. Because we did not see stark changes in Annexin V staining of LSECs between CLP BL6 and CLP CD8−/− animals (Figure 6A), we believe that FasL on CD8+ T cells alone is not sufficient to instigate Fas-mediated LSEC sepsis-induced apoptosis.
We believe that there are more direct effects in Fas−/− animals compared with FasL−/− animals. This may be because FasL+-expressing leukocytes may not be the only cells that come in contact with the sinusoidal endothelium, and cause direct damage. There are other methods of endothelial cell apoptosis; one hallmark study has indicated that IL-6 and tumor necrosis factor-α are responsible for hepatocellular dysfunction seen in sepsis.26 The combined inflammatory milieu (ie, cytokines, such as tumor necrosis factor-α and bacteria) induced by polymicrobial septic insult, together with LSEC’s Fas expression, contributes to their demise. This might explain why there was no significant difference of Annexin V staining in enriched LSECs from CLP FasL−/− animals compared with CLP BL6 animals (Figure 6A). Yet, we saw differences in overall liver injury and cell yields (Figure 6, B and C) because the Fas receptor is still present.
In our model, once LSECs become activated, as indicated with an increased expression of ICAM-1 and Fas (Figure 2) during sepsis, we speculate that they should no longer be able to sustain a state of hepatic immune tolerance. Our results are promising because they coincide with a recent report that ICAM-1 is required to allow cross presentation of antigen to CD8+ T cells.34 In addition, adhesion molecule expression has been shown to directly correlate with the transmigration and extravasation of leukocytes into the hepatic sinusoid in an LPS model of sepsis.40 Our data, however, extends the story that perhaps CD8+ T cells activate LSECs, but do not directly induce apoptosis. In fact, increases in endothelial ICAM-1 could indicate that both FasL+- and non–FasL+-expressing leukocytes are able to potentiate sinusoidal EC injury, and this could also explain why we do not see stark differences in FasL−/− animals (Figure 6). However, on further activation and prolonged contact with infiltrating leukocytes and bacterial products, LSECs eventually become injured and then ultimately undergo apoptosis (increases of Annexin V and TUNEL staining), culminating in a decrease in overall cell number and increases in tissue permeability (Figures 3 and 4) and ALT (Figure 5). Overall, the harmful Fas-induced effects of LSEC injury in sepsis are regulated by the ability of KC to secrete IL-6 and signal to LSECs (Figure 9).
We believe that our findings from this study are novel because few have considered the role KCs play in the cross talk between LSECs and hepatocytes during injury. Other models have, however, shown that KCs are protective during septic peritonitis. When KCs were depleted with clodronate liposomes in septic peritonitis, mice exhibited decreased survival, and their mortality was shown to be due to the inability of KCs to produce pro-inflammatory cytokines.36 Actually, KCs might be the link that provides the indirect protection of hepatocytes from further Fas-induced injury by secreting IL-6, binding to gp130 on LSECs, and indirectly activating STAT3. It has been reported that STAT3 plays a major role in liver development and regeneration by protecting hepatocytes from Fas-induced liver injury.41,42
Our data show that KCs are needed within the hepatic sinusoid to protect LSECs from further injury (Figure 9). We believe that this phenomenon occurs because, in the absence of KCs, inflammatory monocytes and/or neutrophils overcompensate for their loss and exacerbate injury of the sinusoidal endothelium. Normally, there aren't many neutrophils in the liver; however, sepsis influences their infiltration, as seen in an LPS model of shock.43 We noted an increase of CD11b+ or immature monocyte/granulocyte populations after CLP (Figure 8A), again suggesting that neutrophils (or some other granulocyte populations) may directly injure ECs during septic inflammation. As a result of greater neutrophil influx into the liver without KCs present, this culminates in higher levels of serum ALT, Annexin V staining on LSEC populations, and more LSECs lost (Figure 9). We also believe that this correlates with an increase in ICAM-1 staining on LSECs in the presence of clodronate (Figure 9). Because more CD11b+ cells are interacting with the sinusoidal endothelium, a direct correlation exists with CD54 and/or ICAM-1 expression. Our observation also agrees with a study performed in an ischemia-reperfusion model, demonstrating that, in the presence of clodronate, ECs had more LPS binding and an increase in ICAM-1.44
Surprisingly, we also found that KCs protect LSECs by secreting IL-6 (there is greater IL-6 cytokine serum production from CLP PBS versus CLP-clodronate–treated animals) (Figure 9F). This was also evident by the drastic decrease in gp130 on enriched CD146+ LSECs from CLP-clodronate–treated animals compared with CLP PBS controls (Figure 9E). The decreased gp130 on enriched LSECs from clodronate-treated animals possibly suggests that gp130 promotes cell survival because these cells would possibly have less STAT3 activation and, therefore, more apoptosis. STAT3 phosphorylation has been shown to protect ECs from cell death.45 IL-6 from KCs, a pro-inflammatory cytokine, in this case, is beneficial, because it will signal to gp130 on LSECs. These data also correlate with other liver injury models, such as ischemia-reperfusion and cholestatic injuries, in which KCs also play a protective role.44,46 It has also been shown in a Gram-positive sepsis model, when hepatocyte-specific gp130−/− mice were injected with Streptococcus pyrogenes, there was less IL-6 secretion and KC/neutrophil accumulation in the liver.47 This again implies that the gp130 receptor is involved in regulating septic inflammation, and it proposes that KCs are possibly needed to modulate potentially harmful neutrophil-endothelium interactions in the liver.47 KCs and LSECs act harmoniously together to combat bacterial infections and clear pathogenic responses. In their absence, there is no longer a buffer to absorb apoptotic debris, and respond to danger signals (eg, LPS, bacteria, and endotoxin) that septic inflammation produces. Because we propose that KCs protect LSECs and, ultimately, hepatocytes from further injury, in the context of the liver, therapies that target and modulate KCs should be considered.
In conclusion, apoptosis, in general, has been widely investigated in septic animal models primarily in immune cell compartments, but there are limited studies that have focused on nonimmune cells, such as ex vivo studies performed on LSECs herein.48 Apoptosis has been shown to play a significant role in the mortality of critically ill patients, and animal models of septic injury.48,49 There is consensus that the mortality seen in critically ill patients is due to an impaired immune response that results, in part, from apoptosis of effector immune cells.50 Researchers have shown that anti-apoptotic molecules, such as anti-caspase 8, anti-caspase 3, anti-Fas (siRNA against Fas), and anti–FasL-blocking protein, can reduce the mortality associated with sepsis in animal models.48,51–53 More important, we show that these same molecules also appear beneficial in reducing LSEC injury because this study indicates that LSECs also undergo death receptor–mediated apoptosis, as shown with increased Fas expression (Figures 2B and 9) and Annexin V staining (Figure 4). Therefore, if LSEC injury is prevented and KCs remain intact, the parenchyma should be preserved and liver tissue will continue to function.
Unlike classic in vitro studies that investigate the interactions between leukocytes and vascular ECs outside their natural tissue microenvironment, we have confirmed that stressors related to septic challenge uniquely affect recently extracted LSECs ex vivo. Future studies should investigate the impact of vascular EC apoptosis and note how this compares with apoptosis of other tissue-specific ECs (eg, kidney ECs, which, like LSECs, are fenestrated) in septic animal models. Vascular injury in each tissue bed mimics their respective inflammatory microenvironments and directly correlates to organ injury in critically ill patients.
Acknowledgments
We thank Yaping Chen (Rhode Island Hospital, Providence, RI) for technical assistance during this project, Ginny Hovanesian for her expertise in confocal imagining (Core Resesarch Laboratories, Rhode Island Hospital, Providence, RI), Dr. Jonathan Reichner (Rhode Island Hospital, Providence, RI) for providing the anti-rabbit Alexa Fluor 594 secondary antibody for use in our in situ microscopy studies, and Dr. Nico van Rooijen (Vrije Universiteit, Amsterdam, The Netherlands) for providing the clodronate and PBS control liposomes in the KC-depleted studies.
Footnotes
Supported by NIH grants F31-DK083873 (N.A.H.), R25-HL088992 (J.N.B.), and R01-GM053209 (A.A.).
References
- 1.Martin G.S., Mannino D.M., Eaton S., Moss M. The epidemiology of sepsis in the United States from 1979 through 2000. N Engl J Med. 2003;348:1546–1554. doi: 10.1056/NEJMoa022139. [DOI] [PubMed] [Google Scholar]
- 2.Angus D.C., Linde-Zwirble W.T., Lidicker J., Clermont G., Carcillo J., Pinsky M.R. Epidemiology of severe sepsis in the United States: analysis of incidence, outcome, and associated costs of care. Crit Care Med. 2001;29:1303–1310. doi: 10.1097/00003246-200107000-00002. [DOI] [PubMed] [Google Scholar]
- 3.Crispe I.N. Liver antigen-presenting cells. J Hepatol. 2011;54:357–365. doi: 10.1016/j.jhep.2010.10.005. [DOI] [PMC free article] [PubMed] [Google Scholar]
- 4.Crispe I.N. The liver as a lymphoid organ. Annu Rev Immunol. 2009;27:147–163. doi: 10.1146/annurev.immunol.021908.132629. [DOI] [PubMed] [Google Scholar]
- 5.Thomson A.W., Knolle P.A. Antigen-presenting cell function in the tolerogenic liver environment. Nat Rev Immunol. 2010;10:753–766. doi: 10.1038/nri2858. [DOI] [PubMed] [Google Scholar]
- 6.Onoe T., Ohdan H., Tokita D., Shishida M., Tanaka Y., Hara H., Zhou W., Ishiyama K., Mitsuta H., Ide K., Asahara T. Liver sinusoidal endothelial cells tolerize T cells across MHC barriers in mice. J Immunol. 2005;175:139–146. doi: 10.4049/jimmunol.175.1.139. [DOI] [PubMed] [Google Scholar]
- 7.Knolle P.A., Löser E., Protzer U., Duchmann R., Schmidt E., zum Büschenfelde K.H., Rose-John S., Gerken G. Regulation of endotoxin-induced IL-6 production by liver sinusoidal endothelial cells and Kupffer cells by IL-10. Clin Exp Immunol. 1997;107:555–561. doi: 10.1046/j.1365-2249.1997.d01-959.x. [DOI] [PMC free article] [PubMed] [Google Scholar]
- 8.Dhainaut J.F., Marin N., Mignon A., Vinsonneau C. Hepatic response to sepsis: interaction between coagulation and inflammatory processes. Crit Care Med. 2001;29:S42–S47. doi: 10.1097/00003246-200107001-00016. [DOI] [PubMed] [Google Scholar]
- 9.Ding B.S., Nolan D.J., Butler J.M., James D., Babazadeh A.O., Rosenwaks Z., Mittal V., Kobayashi H., Shido K., Lyden D., Sato T.N., Rabbany S.Y., Rafii S. Inductive angiocrine signals from sinusoidal endothelium are required for liver regeneration. Nature. 2010;468:310–315. doi: 10.1038/nature09493. [DOI] [PMC free article] [PubMed] [Google Scholar]
- 10.Elvevold K., Smedsrod B., Martinez I. The liver sinusoidal endothelial cell: a cell type of controversial and confusing identity. Gastrointest Liver Physiol. 2008;294:G391–G400. doi: 10.1152/ajpgi.00167.2007. [DOI] [PubMed] [Google Scholar]
- 11.Katz S.C., Pillarisetty V.G., Bleier J.I., Shah A.B., DeMatteao R.P. Liver sinusoidal endothelial cells are insufficient to activate T cells. J Immunol. 2004;173:230–235. doi: 10.4049/jimmunol.173.1.230. [DOI] [PubMed] [Google Scholar]
- 12.Zellweger R.M., Prestwood T.R., Shresta S. Enhanced infection of liver sinusoidal endothelial cells in a mouse model of antibody-induced severe dengue disease. Cell Host Microbe. 2010;7:128–139. doi: 10.1016/j.chom.2010.01.004. [DOI] [PMC free article] [PubMed] [Google Scholar]
- 13.Schurich A., Berg M., Stabenow D., Bottcher J., Kern M., Schild H.J., Kurts C., Schuette V., Burgdorf S., Diehl L. Dynamic regulation of CD8 T cell tolerance induction by liver sinusoidal endothelial cells. J Immunol. 2010;184:4107–4114. doi: 10.4049/jimmunol.0902580. [DOI] [PubMed] [Google Scholar]
- 14.Connolly M.K., Bedrosian A.S., Malhotra A., Henning J.R., Ibrahim J., Vera V., Cieza-Rubio N.E., Hassan B.U., Pachter H.L., Cohen S. In hepatic fibrosis, liver sinusoidal endothelial cells acquire enhanced immunogenicity. J Immunol. 2010;185:2200–2208. doi: 10.4049/jimmunol.1000332. [DOI] [PMC free article] [PubMed] [Google Scholar]
- 15.Acquavella N., Ouiroga M.F., Wittig O., Cardier J.E. Effect of simvastin on endothelial cell apoptosis mediated by fas and TNF-alpha. Cytokine. 2010;1:45–50. doi: 10.1016/j.cyto.2009.09.011. [DOI] [PubMed] [Google Scholar]
- 16.Joussen A.M., Poulaki V., Mitsiades N., Cai W.Y., Suzuma I., Pak J., Ju S.T., Rook S.L., Esser P., Mitsiades C.S., Kirchhof B., Adamis A.P., Aiello L.P. Suppression of Fas-FasL-induced endothelial cell apoptosis prevents diabetic blood-retinal barrier breakdown in a model of streptozotocin-induced diabetes. FASEB J. 2003;17:76–78. doi: 10.1096/fj.02-0157fje. [DOI] [PubMed] [Google Scholar]
- 17.Yoon J.H., Gores G.J. Death receptor mediated apoptosis and the liver. J Hepatol. 2002;37:400–410. doi: 10.1016/s0168-8278(02)00209-x. [DOI] [PubMed] [Google Scholar]
- 18.Wesche-Soldato D.E., Chung C.S., Gregory S.H., Salazar-Mather T.P., Ayala C.A., Ayala A. CD8+ T cells promote inflammation and apoptosis in the liver after sepsis: role of Fas-FasL. Am J Pathol. 2007;171:87–96. doi: 10.2353/ajpath.2007.061099. [DOI] [PMC free article] [PubMed] [Google Scholar]
- 19.McNeal S.I., LeGolvan M.P., Chung C.S., Ayala A. The dual functions of receptor interacting protein 1 in fas-induced hepatocyte death during sepsis. Shock. 2011;35:499–505. doi: 10.1097/SHK.0b013e31820b2db1. [DOI] [PMC free article] [PubMed] [Google Scholar]
- 20.Lee W.L., Slutsky A.S. Sepsis and endothelial permeability. N Engl J Med. 2010;363:689–691. doi: 10.1056/NEJMcibr1007320. [DOI] [PubMed] [Google Scholar]
- 21.Aird W.C. Vascular bed-specific hemostasis: role of endothelium in sepsis pathogenesis. Crit Care Med. 2001;29(Suppl):S28–S34. doi: 10.1097/00003246-200107001-00013. discussion S34-S35. [DOI] [PubMed] [Google Scholar]
- 22.Schouten M., Wiersinga W.J., Levi M., van der Poll T. Inflammation, endothelium, and coagulation in sepsis. J Leukoc Biol. 2008;83:536–545. doi: 10.1189/jlb.0607373. [DOI] [PubMed] [Google Scholar]
- 23.Aird W.C. The role of the endothelium in severe sepsis and multiple organ dysfunction syndrome. Blood. 2003;101:3765–3777. doi: 10.1182/blood-2002-06-1887. [DOI] [PubMed] [Google Scholar]
- 24.Sakamoto S., Okanoue T., Itoh Y., Nakagawa Y., Nakamura H., Morita A., Daimon Y., Sakamoto K., Yoshida N., Yoshikawa T., Kashima K. Involvement of Kupffer cells in the interaction between neutrophils and sinusoidal endothelial cells in rats. Shock. 2002;18:152–157. doi: 10.1097/00024382-200208000-00011. [DOI] [PubMed] [Google Scholar]
- 25.Doi F., Goya T., Torisu M. Potential role of hepatic macrophages in neutrophil-mediated liver injury in rats with sepsis. Hepatology. 1993;17:1086–1094. [PubMed] [Google Scholar]
- 26.Wang P., Chaudry I.H. Mechanism of hepatocellular dysfunction during hyperdynamic sepsis. Am J Physiol. 1996;270:R927–R938. doi: 10.1152/ajpregu.1996.270.5.R927. [DOI] [PubMed] [Google Scholar]
- 27.Hotchkiss R.S., Tinsley K.W., Swanson P.E., Karl I.E. Endothelial cell apoptosis in sepsis. Crit Care Med. 2002;30:S225–S228. doi: 10.1097/00003246-200205001-00009. [DOI] [PubMed] [Google Scholar]
- 28.Rittirsch D., Huber-Lang M.S., Flierl M.A., Ward P.A. Immunodesign of experimental sepsis by cecal ligation and puncture. Nat Protoc. 2008;4:31–36. doi: 10.1038/nprot.2008.214. [DOI] [PMC free article] [PubMed] [Google Scholar]
- 29.Kern M., Popov A., Scholz K., Schumak B., Djandji D., Limmer A., Eggle D., Sacher T., Zawatzky R., Holtappels R. Virally infected mouse liver endothelial cells trigger CD8+ T-cell immunity. Gastroenterology. 2010;138:336–346. doi: 10.1053/j.gastro.2009.08.057. [DOI] [PubMed] [Google Scholar]
- 30.Saraste A. Morphologic criteria and detection of apoptosis. Hertz. 1999;24:189–195. doi: 10.1007/BF03044961. [DOI] [PubMed] [Google Scholar]
- 31.van Rooijen N., Sanders A., van den Berg T.K. Apoptosis of macrophages induced by liposome-mediated intracellular delivery of clodronate and propamidine. J Immunol Methods. 1996;193:93–99. doi: 10.1016/0022-1759(96)00056-7. [DOI] [PubMed] [Google Scholar]
- 32.van Rooijen N., Sanders A. Kupffer cell depletion by liposome-delivered drugs: comparative activity of intracellular clodronate, propamidine, and ethylenediaminetetraacetic acid. Hepatology. 1996;23:1239–1243. doi: 10.1053/jhep.1996.v23.pm0008621159. [DOI] [PubMed] [Google Scholar]
- 33.Bardin N., Anfosso F., Masse J.M., Cramer E., Sabatier F., Le Bivic A., Sampol J., Dignat-George F. Identification of CD146 as a component of the endothelial junction involved in the control of cell-cell cohesion. Blood. 2001;98:3677–3684. doi: 10.1182/blood.v98.13.3677. [DOI] [PubMed] [Google Scholar]
- 34.Ebrahimkhani M.R., Mohar I., Crispe I.N. Cross-presentation of antigen by diverse subsets of liver cells. Hepatology. 2011;54:1379–1387. doi: 10.1002/hep.24508. [DOI] [PMC free article] [PubMed] [Google Scholar]
- 35.Wu R.Q., Xu Y.X., Song X.H., Chen L.J., Meng X.J. Adhesion molecule and proinflammatory cytokine gene expression in hepatic sinusoidal endothelial cells following cecal ligation and puncture. World J Gastroenterol. 2001;7:128–130. doi: 10.3748/wjg.v7.i1.128. [DOI] [PMC free article] [PubMed] [Google Scholar]
- 36.Emmanuilidis K., Weighardt H., Maier S., Gerauer K., Fleischmann T., Zheng X.X., Hancock W.W., Holzmann B., Heidecke C.-D. Critical role of Kupffer cell-derived IL-10 for host defense in septic peritonitis. J Immunol. 2001;167:3919–3927. doi: 10.4049/jimmunol.167.7.3919. [DOI] [PubMed] [Google Scholar]
- 37.Uhrig A., Banafsche R., Kremer M., Hegenbarth S., Hamann A., Neurath M., Gerken G., Limmer A., Knolle P.A. Development and functional consequences of LPS tolerance in sinusoidal endothelial cells of the liver. J Leukoc Biol. 2005;77:626–633. doi: 10.1189/jlb.0604332. [DOI] [PubMed] [Google Scholar]
- 38.Szabo G., Romics L., Frendl G. Liver in sepsis and systemic inflammatory response syndrome. Clin Liver Dis. 2002;6:1045–1066. doi: 10.1016/s1089-3261(02)00058-2. [DOI] [PubMed] [Google Scholar]
- 39.Kennedy N.J., Russel J.Q., Michail N., Budd R.C. Liver damage by infiltrating CD8+ T cells is Fas dependent. J Immunol. 2001;167:6654–6662. doi: 10.4049/jimmunol.167.11.6654. [DOI] [PubMed] [Google Scholar]
- 40.McDonald B., McAvoy E.F., Lam F., Gill V., de la Motte C., Savani R.C., Kubes P. Interaction of CD44 and hyaluron is the dominant mechanism for neutrophil sequestration in inflamed liver sinusoids. J Exp Med. 2008;205:915–927. doi: 10.1084/jem.20071765. [DOI] [PMC free article] [PubMed] [Google Scholar]
- 41.Haga S., Terui K., Zhang H.Q., Enosawa S., Ogawa W., Inoue H., Okuyama T., Takeda K., Akira S., Ogino T., Irani K., Ozaki M. Stat3 protects against Fas-induced liver injury by redox-dependent and -independent mechanisms. J Clin Invest. 2003;112:989–998. doi: 10.1172/JCI17970. [DOI] [PMC free article] [PubMed] [Google Scholar]
- 42.Wuestefeld T., Klein C., Streetz K.L., Beraza N., Schölmerich J., Burgart L.J., Zender L., Kubicka S., Baskin-Bey E., Gores G.J., Manns M.P., Trautwein C. Lack of gp130 expression results in more bacterial infection and higher mortality during chronic cholestasis in mice. Hepatology. 2005;42:1082–1090. doi: 10.1002/hep.20912. [DOI] [PubMed] [Google Scholar]
- 43.McAvoy E.F., McDonald B., Parsons S.A., Wong C.H., Landmann R., Kubes P. The role of CD14 in neutrophil recruitment within the liver microcirculation during endotoxemia. J Immunol. 2011;186:2592–2601. doi: 10.4049/jimmunol.1002248. [DOI] [PubMed] [Google Scholar]
- 44.Ellett J.D., Atkinson C., Evans Z.P., Amani Z., Balish E., Schmidt M.G., van Rooijen N., Schnellmann R.G., Chavin K.D. Murine Kupffer cells are protective in total hepatic ischemia/reperfusion injury with bowel congestion through IL-10. J Immunol. 2010;184:5849–5858. doi: 10.4049/jimmunol.0902024. [DOI] [PMC free article] [PubMed] [Google Scholar]
- 45.Kano A., Wolfgang M.J., Gao Q., Jacoby J., Chai G.X., Hansen W., Iwamoto Y., Pober J.S., Flavell R.A., Fu X.Y. Endothelial cells require STAT3 for protection against endotoxin-induced inflammation. J Exp Med. 2003;198:1517–1525. doi: 10.1084/jem.20030077. [DOI] [PMC free article] [PubMed] [Google Scholar]
- 46.Abraham S., Szabo A., Kaszaki J., Varga R., Eder K., Duda E., Lazar G., Tiszlavicz L., Boros M., Lazar G. Kupffer cell blockade improves the endotoxin-induced microcirculatory inflammatory response in obstructive jaundice. Shock. 2008;30:69–74. doi: 10.1097/SHK.0b013e31815dceea. [DOI] [PubMed] [Google Scholar]
- 47.Klein C., Medina E., Sander L., Dierssen U., Roskams T., Mueller W., Trautwein C., Goldmann O. Contribution of interleukin-6/gp 130 signaling in hepatocytes to the inflammatory response in mice infected with Streptococcus pyrogenes. J Infect Dis. 2007;196:755–762. doi: 10.1086/520090. [DOI] [PubMed] [Google Scholar]
- 48.Hotchkiss R.S., Nicholson D.W. Apoptosis and caspases regulate death and inflammation in sepsis. Nat Rev Immunol. 2006;6:813–822. doi: 10.1038/nri1943. [DOI] [PubMed] [Google Scholar]
- 49.Hotchkiss R.S., Tinsley K.W., Swanson P.E., Chang K.C., Cobb J.P., Buchman T.G., Korsmeyer S.J., Karl I.E. Prevention of lymphocyte cell death in sepsis improves survival in mice. Proc Natl Acad Sci U S A. 1999;96:14541–14546. doi: 10.1073/pnas.96.25.14541. [DOI] [PMC free article] [PubMed] [Google Scholar]
- 50.Oberholzer A., Oberholzer C., Moldawer L. Sepsis syndromes: understanding the role of innate and acquired immunity. Shock. 2001;16:83–96. doi: 10.1097/00024382-200116020-00001. [DOI] [PubMed] [Google Scholar]
- 51.Wesche-Soldato D.E., Chung C.S., Lomas-Neira J.L., Doughty L.A., Gregory S.H., Ayala A. In vivo delivery of caspase 8 or Fas siRNA improves the survival of septic mice. Blood. 2005;106:2295–2301. doi: 10.1182/blood-2004-10-4086. [DOI] [PMC free article] [PubMed] [Google Scholar]
- 52.Hotchkiss R.S., Osmon S.B., Chang K.C., Wagner T.H., Coopersmith C.M., Karl I.E. Accelerated lymphocyte death in sepsis occurs by both the death receptor and mitochondrial pathway. J Immunol. 2005;174:5110–5118. doi: 10.4049/jimmunol.174.8.5110. [DOI] [PubMed] [Google Scholar]
- 53.Chung C.S., Song G.Y., Lomas J., Simms H.H., Chaudry I.H., Ayala A. Inhibition of Fas/Fas ligand signaling improves septic survival: differential effects on macrophage apoptotic and functional capacity. J Leukoc Biol. 2003;74:344–351. doi: 10.1189/jlb.0102006. [DOI] [PubMed] [Google Scholar]