Abstract
Crystal structures for the commercial monohydrate form and an anhydrate form of dasatinib, an oral anti-cancer agent, are presented along with characterization by Raman spectroscopy, powder X-ray diffraction, differential scanning calorimetry, and thermogravimetric analysis. Solubility measurements conducted in water reveal the anhydrate has dramatically improved solubility compared to the commercial hydrate form. Finally, dasatinib is a rare example of a promiscuous solvate former and the basis for this behavior can now be understood by examining the poor packing efficiency in the unsolvated form.
INTRODUCTION
The pharmaceutical behavior of hydrates has become the subject of increased attention over the last decade.1-5 One third of active pharmaceutical ingredients (APIs) are capable of forming hydrates during pharmaceutical processing, potentially leading to altered performance of the drugs.6 Hydration and dehydration of substances can occur either in response to changes in environmental conditions or during processing.7 These variations may result in dosage variations impacting drug bioavailability.2 The U.S. Food and Drug Administration (FDA) requires identification, characterization, and analysis of the stable form of a drug.8 Thus, solid form screening is needed in the early stages of drug development and more importantly during pharmaceutical processing where factors such as pressure, temperature, and humidity can alter the crystalline form of the API.9 Many drugs form stable hydrates, some of which can be dehydrated by simply heating or treatment under reduced pressure. After dehydration the anhydrate phase may become thermodynamically unstable and revert to the hydrate in ambient conditions.10 Hence, it can be challenging to formulate such drugs as anhydrates unless alternative routes to prepare pure and stable anhydrate phases can be uncovered.
Dasatinib [N-(2-chloro-6-methylphenyl)-2-[[6-[4-(2-hydroxyethyl)-1-piperazinyl]-2-methyl-4-pyrimidinyl]amino]-5-thiazole carboxamide monohydrate] is a potent, orally active, multitargeted inhibitor of several critical oncogenic kinases which was developed by Bristol-Myers Squibb.11-14 Dasatinib (DAS) was approved by the FDA in 2006 and is sold under the trade name Sprycel.15 DAS is a poorly water soluble drug and commercial DAS is a monohydrate (Figure 1) with solubility of 8 μg/mL at 24 °C.16
Figure 1.

Molecular structure of Dasatinib (DAS) hydrate : N-(2-chloro-6-methylphenyl)-2-[[6-[4-(2-hydroxyethyl)-1-piperazinyl]-2-methyl-4-pyrimidinyl]amino]-5-thiazole carboxamide monohydrate.
In this study, an anhydrate phase of DAS is characterized which shows better solubility than the commercial hydrate form. DAS is prone to solvate formation and inclusion of solvents decreases void space in the crystal (vide infra). Thus crystallization of the anhydrate phase from common solvents is a major challenge. We were able to crystallize DAS as a pure anhydrate phase and single crystal X-ray structures of both anhydrate and hydrate form were determined for the first time offering insight into the solvation behavior of this important drug. Additionally both anhydrate and hydrate forms were characterized by Raman spectroscopy, powder X-ray diffraction (PXRD), differential scanning calorimetry (DSC), and thermogravimetric analysis (TGA). Solubility measurements on the commercial form and anhydrate phase in water shows that the anhydrate has a major solubility advantage over the commercial form.
RESULT AND DISCUSSION
Crystallization
The commercial hydrate modification of DAS is stable at ambient conditions. DAS is slightly soluble in ethanol, methanol, acetone, and acetonitrile. Crystallization in common organic solvents yields DAS as a solvated form.17-20 We obtained DAS anhydrate by heating a sample of commercial DAS at a rate of 5 °C/ min. to 130 °C on a hotstage or in an oven for 2 hours and then allowing the sample to cool. Though this dehydration procedure converts the hydrate form to anhydrate, some decomposition is observed when the temperature exceeds 100 °C. Several attempts were made to crystallize DAS anhydrate from methanol, ethanol, 2-butanol, ethyl acetate, acetonitrile, acetone and other common organic solvents. Solvent combinations were also used for the crystallization experiments. Ultimately the pure anhydrate was obtained by dissolving DAS in a solvent combination of acetone/2-butanol (3:1) or acetone/methanol (3:1) followed by evaporation under ambient conditions. Pure DAS monohydrate was obtained by crystallization from hot water/ethanol followed by evaporation. The anhydrate phase completely converts to DAS monohydrate if the sample is suspended in water for 4-5 days.
Initial characterization of DAS phases was carried out with Raman spectroscopy. Both the commercial hydrate and anhydrate phases have several characteristic peaks in 1400-1700 cm-1 region (Figure 2). Further differences between hydrate and anhydrate phases were detected in the region from 2800-3300 cm-1 in which C-H vibrations from the aromatic ring and O-H stretching are observed (Figure S1 and Peak list Table S1, supporting information).
Figure 2.
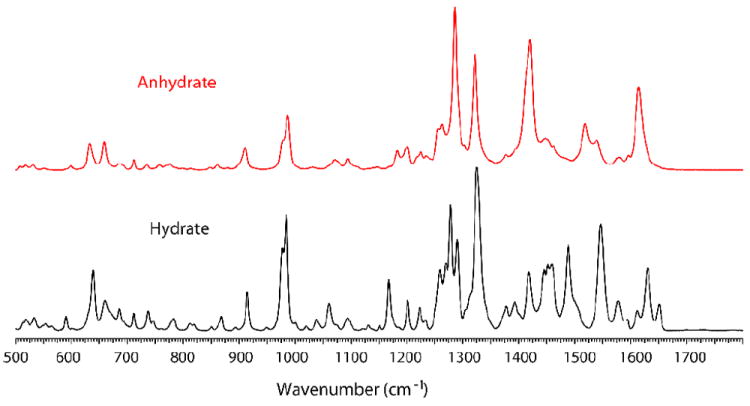
Raman spectra of hydrate and anhydrate form DAS.
Powder X-ray Diffraction
Microcrystalline samples of hydrate and anhydrate DAS phases were characterized by PXRD to ensure phase identity (Figure 3). DAS hydrate has relatively more reflections and sharp peaks than the anhydrate. Characteristic peaks of hydrate observed at 4.6, 9.6, 11.2, 12.3, 13.7, 15.2, 18.0, 19.1, 19.5, and 23.5 2θ compared to anhydrate which has characteristic peaks at 6.8, 12.3, 13.1, 13.7, 16.7, 24.3, 24.8 2θ. Both powder diffraction patterns are very distinctive and the reflections of each form are summarized in Table S2 (supporting information). PXRD data of both hydrate and anhydrate DAS phases match well reports in the patent literature.17
Figure 3.
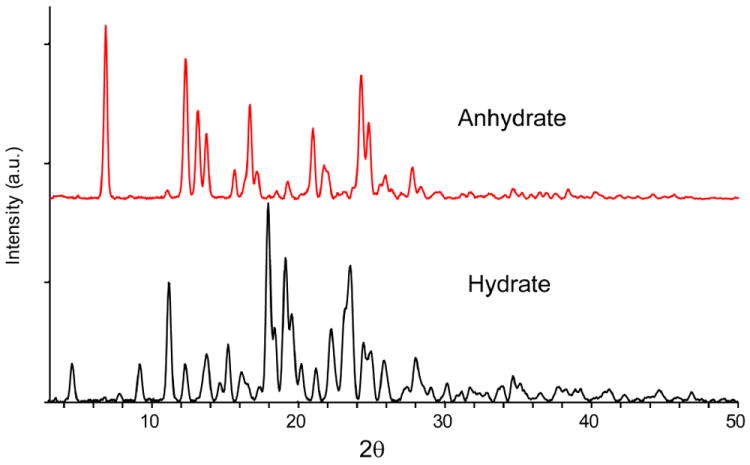
PXRD pattern of hydrate and anhydrate phases of DAS.
Structural Aspects
Growing suitable single crystals of DAS for structure determination proved challenging due to the propensity of both anhydrate and hydrate phases to form small crystals with extensive twinning and modest crystal quality; despite these challenges, we were able to determine the crystal structure for both hydrate and anhydrate phases for the first time. DAS anhydrate crystallizes in the monoclinic crystal system and solved in the space group P21/n, whereas the hydrate phase is orthorhombic in Pbca (Table 1). DAS molecules have a very high degree of torsional freedom. An overlay of the two symmetry independent molecules from the crystal structures show that they posses markedly different conformations (Figure 4).21, 22 Crystallographic disorder superimposing positions of −Cl and −Me group is detected in both the crystal structures. Figures throughout this paper present only the major conformer. Simulated PXRD patterns from these structures are in good agreement with the experimental powder patterns (Figure S2 and S3, supporting information).
Table 1.
Summary of crystallographic data for the hydrate and anhydrate form of DAS.
| Hydrate | Anhydrate | |
|---|---|---|
| Chemical Formula | C22H28N7O3ClS | C22H26N7O2ClS |
| Formula Weight | ||
| Crystal dimensions (mm) | 0.12×0.10×0.02 | 0.47×0.09×0.04 |
| Crystal system | Orthorhombic | Monoclinic |
| Space Group | Pbca | P21/n |
| a (Å) | 13.8657 (3) | 14.1400 (7) |
| b (Å) | 9.2077 (2) | 8.1804 (4) |
| c (Å) | 37.9347 (8) | 22.1356 (12) |
| α (°) | 90.00 | 90.00 |
| β (°) | 90.00 | 105.415(3) |
| γ (°) | 90.00 | 90.00 |
| V (Å3) | 4843.17 (18) | 2468.3 (2) |
| Z′ | 1 | 1 |
| Z | 8 | 4 |
| ρcald | 1.388 | 1.313 |
| GOF | 1.047 | 1.116 |
| R1 | 0.0905 | 0.0846 |
| wR2 [for (I) > 2σ(I)] | 0.2370 | 0.2413 |
| μ | 2.532 | 2.435 |
| Reflections | ||
| Measured | 22537 | 11928 |
| Independent | 4227 | 4437 |
| Observed | 2354 | 3763 |
Figure 4.

Overlay of unique molecules in the crystal structure of DAS hydrate (green) and anhydrate (red).
DAS anhydrate and hydrate display completely different packing motifs consistent with introduction of water molecules disrupting the hydrogen bonding interactions. The basic building block for DAS anhydrate is a dimer formed through N–H⋯N interactions of graph set R22(8) as shown in figure 5a. In DAS hydrate this dimer is different. Due to introduction of water, one DAS is shifted and two DAS molecules are held together by two water molecules acting as bridges (Figure 5b). This cluster can be considered as the basic building block for the hydrate packing. Both N–H⋯O and O–H⋯O hydrogen bonding are involved in formation of this cluster.
Figure 5.
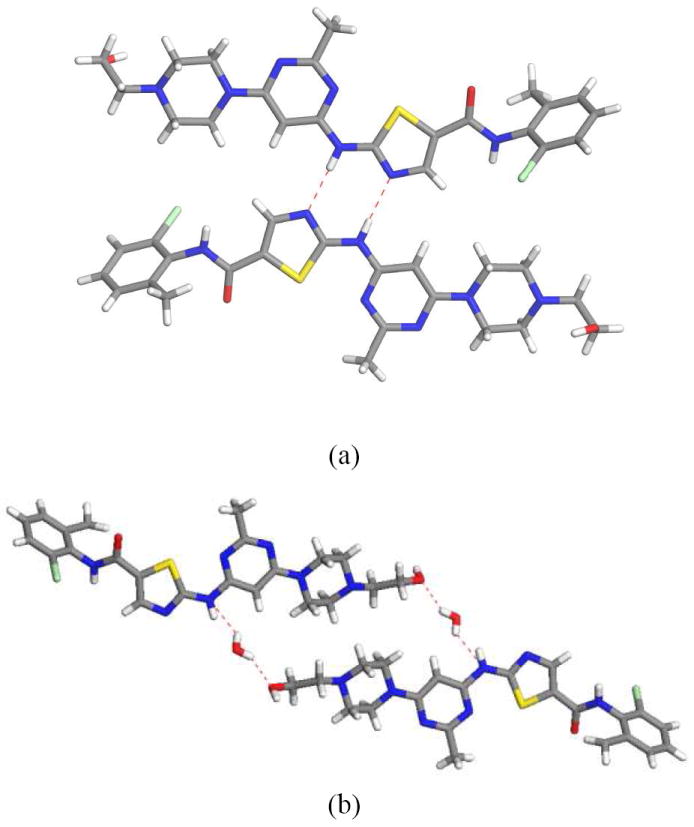
(a) Presence of N–H⋯N hydrogen bonding dimer R22(8) motif observed in anhydrate form. (b) Introduction of water molecules changes the hydrogen bonding in DAS hydrate. Both N–H⋯O and O–H⋯O hydrogen bonding are present in the hydrate form.
As expected from the basic building units, the three dimensional packing motifs of DAS hydrate and anhydrate are quite different. In DAS anhydrate dimers pack in a herringbone fashion (Figure 6a), whereas in the 3D packing of DAS hydrate, molecules arrange in layers along the ac plane and water molecules reside in the hydrophilic channels (Figure 6b). Water molecules are bound in between DAS molecules with N–H⋯O and O–H⋯O hydrogen bonding interactions. The percentage of void space in molecular crystal can be quantitatively measured through calculating packing coefficients.23 The density and packing efficiency of DAS hydrate is 5.3 % and 6.6 % more than the anhydrate form implying that hydrate has much more efficient packing (Table 1 and Figure 7). In this context it is interesting to note that computationally removing water from the hydrate phase, without allowing structural relaxation, yields a hypothetical anhydrate with a density of 1.338. Remarkably, this is more dense than the anhydrate phase (1.313) suggesting that reorganization to a less dense phase is favored by considerations beyond simple close packing.
Figure 6.
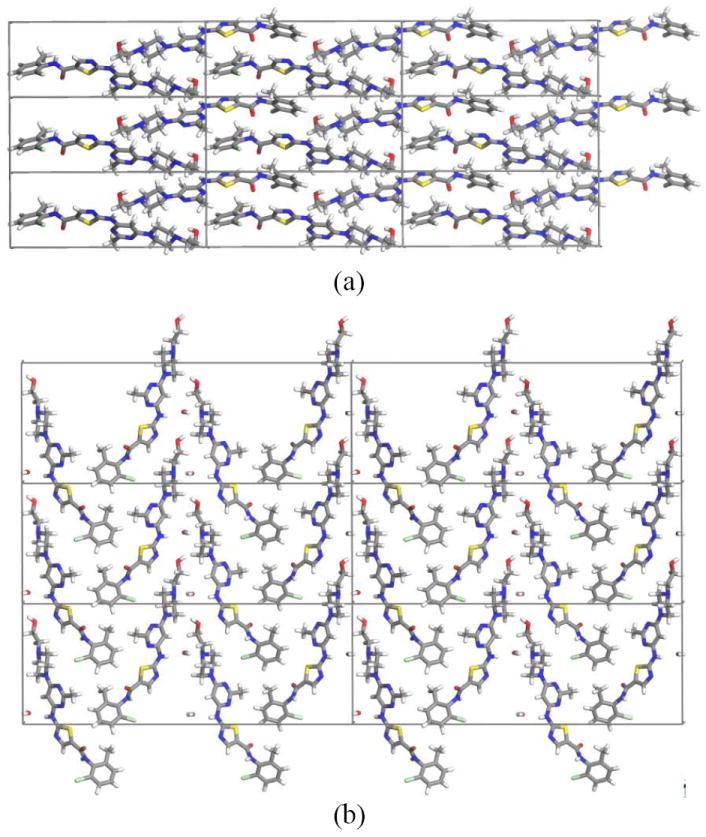
Three dimensional packing of (a) anhydrate phase view down a-axis and (b) hydrate phase view down b-axis.
Figure 7.
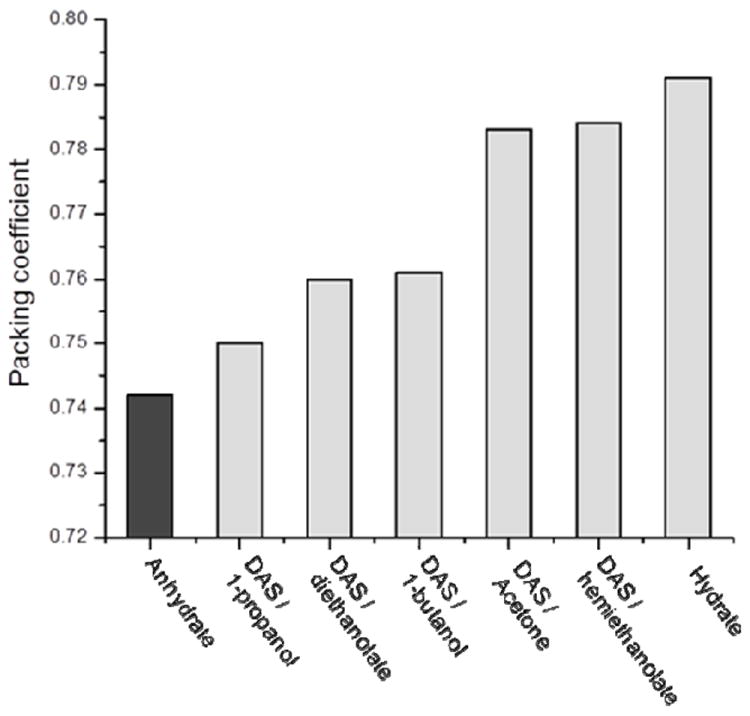
Comparison of packing coefficients of the DAS anhydrate, hydrate and solvates.
Crystallization experiments in different organic solvents confirmed DAS is promiscuous solvate former.24 Lattice parameter comparison of DAS solvates with the anhydrate (Table S3, supporting information) indicates that they are isostructural and is consistent with inclusion increasing packing efficiency (Figure 7). This observation fits a model for promiscuous solvate formers of inefficient packing of the pure form.24 Propensity towards solvate formation in DAS has been documented in several patents.17-20, 25-27 More than 45 solvates reported in recent patents are listed in Table S4 (supporting information).
Thermal Analysis
TGA analyses were performed on DAS hydrate and anhydrate phase from room temperature to 350 °C. The hydrate was found to lose water between 60-100 °C (Figure S4, supporting information). The mass change of 3.51% confirms the stoichiometric ratio of one mole water per mole DAS (theory: 3.56%, with respect to the mass of the monohydrate). DAS anhydrate does not show mass loss prior to melting.
Hydrate and anhydrate phases were analyzed by DSC (Figure 8). DAS hydrate displays two endothermic events upon heating. The first endothermic transition is observed between 90-130 °C and is associated with water loss whereas the second event is centered at 286 °C in accordance with melting. These events were also confirmed by hot stage microscopy and variable temperature Raman spectroscopy (Figure S5, supporting information). DAS hydrate completely transformed to anhydrate at 90-130 °C as evidenced by the Raman peak shifts upon heating. DSC analysis of DAS anhydrate reveals a single endothermic effect centered at 285 °C indicating the melting point; no other phase transformations were observed during heating either by DSC or through variable temperature Raman spectroscopy (Figure S6, supporting information).
Figure 8.
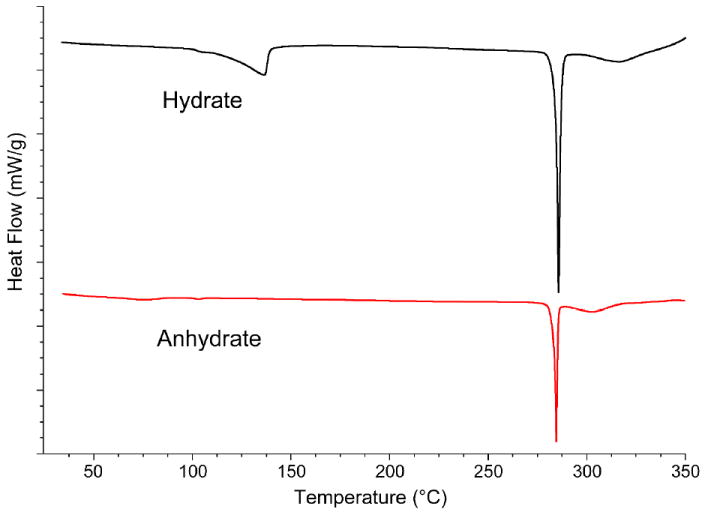
DSC profile of DAS hydrate showing water loss at 90-130 °C before melting at 286 °C. DAS anhydrate does not undergo any phase transition before melting.
Equilibrium Solubility Measurement
Since solubility and drug dissolution are related to drug absorption,28, 29, 30 a large number of studies have focused on the effect of hydrates/anhydrates on solubility and/or dissolution.2 Equilibrium solubility of DAS hydrate and anhydrate were analyzed in water at 23 ±1 °C. The anhydrate has better solubility in water than the hydrate phase (Figure 9). However, over a period of 24 hours DAS anhydrate slowly starts transforming to hydrate in water. Raman spectroscopy confirmed the identity of the residual solid, indicating transformations from anhydrate to hydrate during the experiment. The equilibrium solubility anhydrate/hydrate ratio was estimated to be ~2.4 with some uncertainty arising in this number due to variable kinetics of nucleation and growth for the hydrate (Figure 9). Measuring solubility differences in samples equilibrated by shaking led to much faster dissolution and differences is solubility that were more dramatic (> 3 fold) accompanied by more rapid transformation of the anhydrate to hydrate in both water and phosphate buffer saline (PBS pH 7.4) solution (Figure S7 and S8, supporting information). As the anhydrate form can produce much more concentrated solutions of DAS over sustained times, it may be a better candidate for formulation of this important drug than the currently used DAS hydrate.
Figure 9.
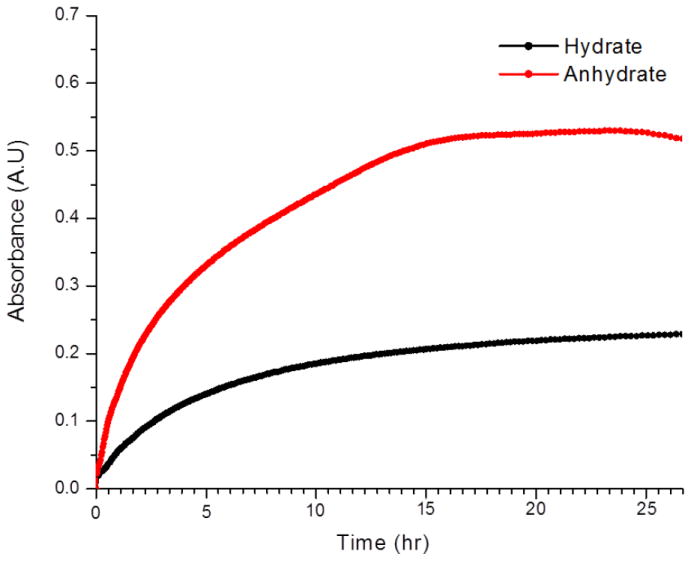
Equilibrium solubility of anhydrate and hydrate phase of DAS in shows anhydrate is 2.4 times more soluble than hydrate.
CONCLUSION
In the present study two modifications of DAS, a hydrate and an anhydrate, were characterized and their physiochemical relationships established. Moreover crystal structures of both modifications were determined. DAS readily incorporates water or organic solvents in its crystal lattice during processing or crystallization and this promiscuous solvation behavior is driven by close packing considerations. Bulk access to a pure and stable anhydrate modification of this compound was achieved through mixed solvent systems. DAS anhydrate obtained in our present study is stable and has major solubility advantages that may motivate using this form over the commercial hydrate modification in future formulations of this important oral anti-cancer agent.
EXPERIMENTAL
Materials
Commercial DAS monohydrate (> 99% purity, ChemieTek, Indianapolis, IN) was used as supplied.
Raman Spectroscopy
Raman spectra were recorded on a Renishaw in Via Raman Microscope equipped with a 20× objective and utilizing a 647 nm laser. The scan range was 100-3600 cm-1, using 5 scans of 60 seconds acquisition time each per spectrum. Samples were analyzed on an aluminum foil holder and a silicon standard was used for calibration of the instrument. Variable temperature Raman spectroscopy was performed using a Linkam LTS 350 hotstage equipped with a TMS 94 controller. Samples were analyzed using a 647 nm laser and a scan range 100-3600 cm-1. The heating rate was controlled using Renishaw Wire 2.0 software. The initial temperature was set at 30 °C and a spectrum was acquired every 5 °C with a heating rate of 2 °C/min up to 230 °C. All the spectra (40-45 acquisitions) acquired were plotted using Renishaw software.
Single Crystal X-ray Diffraction
The sample for single crystal X-ray diffraction of DAS anhydrate was obtained by dissolving DAS in a solvent combination of acetone/methanol (3:1) followed by evaporation under ambient conditions. DAS hydrate samples for single crystal X-ray diffraction were obtained by dissolving DAS in hot water/methanol followed by evaporation at room temperature.
Single crystal X-ray diffraction measurements were conducted on a Rigaku R-AXIS SPIDER diffractometer with an imaging plate area detector. Graphite monochromated Cu-Kα radiation (1.5406 Å) was used with data collection 95 K. The structures were solved by direct methods and expanded using Fourier techniques. An empirical absorption correction was applied to the structure. All calculations were performed using the CrystalStructure31 crystallographic software package except for refinement, which was performed using SHELXL-97.32 Additional refinement details are provided in supporting information.
Powder X-ray Diffraction
Powder X-ray diffraction (PXRD) patterns were collected at ambient temperature using a R-AXIS SPIDER diffractometer with an imaging plate area detector and graphite monochromated Cu-Kα radiation (1.5406 Å). Samples were mounted on a cryoloop and images were collected for five minutes while rotating the sample about the φ-axis at 10°/sec, oscillating ω between 120° and 180° at 1°/sec and Φ fixed at 45°. Images were integrated from 5° to 50° with a 0.05° step size using AreaMax software. Powder patterns were processed in Jade Plus to calculate peak positions and intensities.
Thermomicroscopy
A Mettler Toledo FP82HT hotstage using an FP 90 control processor was used for thermomicroscopy. The sample was observed under polarized light with a Leica DMLP microscope. Initially samples were heated from 30 to 300 °C at a rate of 5 °C/min. The transformation product was then identified using Raman and PXRD. The hotstage was calibrated using a caffeine standard.
Thermogravimetric Analysis (TGA)
TGA was performed on a TA Instruments Q50 TGA. Samples were heated at a rate of 10 °C/ min from room temperature to 350 °C. Calibration of the instrument was performed using nickel and alumel standards.
Differential Scanning Calorimetry (DSC)
DSC was performed on a TA Instruments DSC Q10. Samples were placed in hermetic aluminum pans and sealed using a TA crimper. The temperature range was 25-350 °C with a heating rate of 10 °C/min. The DSC was calibrated using an indium standard.
UV absorbance Measurements
The optical absorbance of DAS hydrate and anhydrate in water was monitored in situ over time using an Agilent 8453 UV-visible spectrometer at 23 ±1 °C. The wavelength of maximum absorbance (λmax) of DAS in water is 325 nm. A time-dependent absorbance curve was used to determine the absorbance at equilibrium. Sample equilibrated in water and phosphate buffer saline (PBS) solution by shaking on an orbital shaker with 130 strokes/min and sample allowed to settle before absorbance measurements.
Supplementary Material
Acknowledgments
This work was supported by National Institute of Health Grant Number GM072737.
Footnotes
Supporting Information. PXRD tabular data, analysis of lattice parameter of DAS solvates, Raman spectroscopy and variable temperature Raman spectroscopy, TGA, solubility experiments of DAS phases, simulated PXRD patterns, structure refinement details. are available in supporting information. This material is available free of charge via the Internet at http://pubs.acs.org.
References
- 1.Byrn SR, Pfeiffer RR, Stowell JG. Solid-State Chemistry of Drugs. SSCI; West Lafayette, IN: 1999. [Google Scholar]
- 2.Khankari RK, Grant DJW. Thermochim Acta. 1995;248:61–79. [Google Scholar]
- 3.Mafra L, Santos SM, Siegel R, Alves I, Almeida Paz FA, Dudenko D, Spiess HW. J Am Chem Soc. 2012;134(1):71–74. doi: 10.1021/ja208647n. [DOI] [PubMed] [Google Scholar]
- 4.Newman AW, Byrn SR. Drug Discovery Today. 2003;8(19):898–905. doi: 10.1016/s1359-6446(03)02832-0. [DOI] [PubMed] [Google Scholar]
- 5.Vogt FG, Brum J, Katrincic LM, Flach A, Socha JM, Goodman RM, Haltiwanger RC. Cryst Growth Des. 2006;6(10):2333–2354. [Google Scholar]
- 6.Vippaguntaa SR, Brittain HG, Grant DJW. Adv Drug Deliver Rev. 2001;48(1):3–26. doi: 10.1016/s0169-409x(01)00097-7. [DOI] [PubMed] [Google Scholar]
- 7.Feth MP, Nagel N, Baumgartner B, Brockelmann M, Rigal D, Otto B, Spitzenberg M, Schulz M, Becker B, Fischer F, Petzoldt C. Eur J Pharm Sci. 2011;42(1-2):116–129. doi: 10.1016/j.ejps.2010.11.001. [DOI] [PubMed] [Google Scholar]
- 8.Guidance for Industry. ANDAs: Pharmaceutical Solid Polymorphism. Chemistry, Manufacturing and Controls Information. U.S. Food and Drug Administration; Rockville, USA: 2007. [Google Scholar]
- 9.Wardrop J, Law D, Qiu Y, Engh K, Faitsch L, Ling C. J Pharm Sci. 2006;95(11):2380–2392. doi: 10.1002/jps.20679. [DOI] [PubMed] [Google Scholar]
- 10.Wikstroem H, Rantanen J, Gift AD, Taylor LS. Cryst Growth Des. 2008;8(8):2684–2693. [Google Scholar]
- 11.Lombardo LJ, Lee FY, Chen P, Norris D, Barrish JC, Behnia K, Castaneda S, Cornelius LAM, Das J, Doweyko AM, Fairchild C, Hunt JT, Inigo I, Johnston K, Kamath A, Kan D, Klei H, Marathe P, Pang SH, Peterson R, Pitt S, Schieven GL, Schmidt RJ, Tokarski J, Wen ML, Wityak J, Borzilleri RM. J Med Chem. 2004;47(27):6658–6661. doi: 10.1021/jm049486a. [DOI] [PubMed] [Google Scholar]
- 12.Das J, Chen P, Norris D, Padmanabha R, Lin J, Moquin RV, Shen ZQ, Cook LS, Doweyko AM, Pitt S, Pang SH, Shen DR, Fang Q, de Fex HF, McIntyre KW, Shuster DJ, Gillooly KM, Behnia K, Schieven GL, Wityak J, Barrish JC. J Med Chem. 2006;49(23):6819–6832. doi: 10.1021/jm060727j. [DOI] [PubMed] [Google Scholar]
- 13.Shah NP, Tran C, Lee FY, Chen P, Norris D, Sawyers CL. Science. 2004;305(5682):399–401. doi: 10.1126/science.1099480. [DOI] [PubMed] [Google Scholar]
- 14.Das J, Padmanabha R, Chen P, Norris DJ, Doweyko AMP, Barrish JC, Wityak J. 6596746 B2. US. 2003
- 15.http://www.accessdata.fda.gov/drugsatfda_docs/appletter/2006/021986s000ltr.pdf
- 16.http://www.ema.europa.eu/docs/en_GB/document_library/EPAR_-_Scientific_Discussion/human/000709/WC500056995.pdf
- 17.Chen B-C, Droghini R, Lajeunesse J, Dimarco JD, Galella M, Chidambaram R. 2005/0215795 A1. US. 2005
- 18.Parthasaradhi RB, Rathnakar RK, Raji RR, Muralidhara RD, Srinivasa RT. 2010/067374 A2. WO. 2010
- 19.Ondrej S, Jirí F, Alexandr M, Alexandr J, Ales G, Judith A, Pavel V, Tamás K, Jiri F, Roman G. 8067423 B2. US. 2011
- 20.Ye J, Huang C. 102030745. CN. 2011
- 21.Bernstein J. In: Organic Solid State Chemistry. Desiraju GR, editor. Elsevier; Amsterdam: 1987. pp. 471–518. [Google Scholar]
- 22.Nangia A. Acc Chem Res. 2008;41:595–604. doi: 10.1021/ar700203k. [DOI] [PubMed] [Google Scholar]
- 23.Packing coefficient is calculated by using the following equation: Ck=ZVmolVcell-1, where Vmol is the molecular volume (Å3), Vcell is the volume of the unit cell (Å3), and Z is the number of molecules in the unit cell. Molecular volume was calculated with Spartan ’10 (Wavefunction Inc.).
- 24.Price CP, Glick GD, Matzger AJ. Angew Chem Int Ed Engl. 2006;45(13):2062–2066. doi: 10.1002/anie.200503533. [DOI] [PubMed] [Google Scholar]
- 25.Rao DR, Kankan RN, Prabhu M, Naik S. 2009MU00846 A. IN. 2009
- 26.Gore VG, Patkar L, Bagul A, Vijaykar PSEM. 2010/139981 A2. WO. 2010
- 27.Ondrej S, Jirí F, Alexandr M, Alexandr J, Ales G, Judith A, Pavel V, Tamás K, Jirí F, Roman G. 7973045 B2. US. 2011
- 28.Aguiar AJ, Krc J, Kinkel AW, Samyn JC. J Pharm Sci. 1967;56(7):847–853. doi: 10.1002/jps.2600560712. [DOI] [PubMed] [Google Scholar]
- 29.Amidon GL, Lennernas H, Shah VP, Crison JR. Pharm Res. 1995;12(3):413–420. doi: 10.1023/a:1016212804288. [DOI] [PubMed] [Google Scholar]
- 30.Singhal D, Curatolo W. Adv Drug Deliver Rev. 2004;56(3):335–347. doi: 10.1016/j.addr.2003.10.008. [DOI] [PubMed] [Google Scholar]
- 31.CrystalStructure 3.7.0. Crystal Structure Analysis Package. Rigaku and Rigaku/MSC; The Woodlands TX 77381: 2000-2005. [Google Scholar]
- 32.Sheldrick GM. SHELXS97 and SHELXL97. University of Göttingen; Germany: 1997. [PubMed] [Google Scholar]
Associated Data
This section collects any data citations, data availability statements, or supplementary materials included in this article.


