

Abstract
Effective clinical application of antiviral immunotherapies necessitates enhancing the functional state of natural killer (NK) and CD8+ T cells. An important mechanism for the establishment of viral persistence in the liver is the activation of the PD-1/PD-L1 inhibitory pathway. To examine the role of hepatic myeloid PD-L1 expression during viral infection, we determined the magnitude and quality of antiviral immune responses by administering PD-L1 short-interfering RNA (siRNA) encapsulated in lipidoid nanoparticles (LNP) in mice. Our studies indicate that Kupffer cells (KC) preferentially engulfed PD-L1 LNP within a short period of time and silenced Pdl1 during adenovirus and MCMV infection leading to enhanced NK and CD8+ T cell intrahepatic accumulation, effector function (interferon (IFN)-γ and granzyme B (GrB) production), CD8+ T cell–mediated viral clearance, and memory. Our results demonstrate that PD-L1 knockdown on KCs is central in determining the outcome of liver viral infections, and they represent a new class of gene therapy.
Keywords: lipidoid nanoparticles, NK cells, nucleic acid therapeutics, PD-L1, T cells
Introduction
The liver maintains a tolerogenic environment from constant exposure to food-derived antigens and bacterial constituents such as lipopolysaccharide via portal blood. While the generation of immune responses including natural killer (NK) cell and CD8+ T cells clears virus, persistant viral infections such as those by hepatitis C virus often take advantage of hepatic tolerance inducing impaired NK and CD8+ T cell responses through activation of negative immunoregulatory pathways.1 As chronic liver infections including hepatitis C virus exploit tolerance and remain a worldwide health problem, investigation of these inhibitory pathways and development of novel therapeutic biotechnologies is warranted.2,3,4
PD-1, a CD28 family member, plays a critical role in suppressing NK and CD8+ T cell responses.5,6,7,8,9,10,11 PD-1−/− mice exhibit hyperactive immune responses and develop lymphoproliferative/autoimmune disorders including lupus-like syndrome, arthritis, dilated cardiomyopathy, gastritis, diabetes, hydronephrosis, and graft-versus-host-like disease.7,12,13,14 PD-1 signaling directly inhibits downstream T cell receptor signaling in T cells13,15,16 and activation of NK cells.8,10,17,18 Baseline expression of PD-1 ligand (PD-L1) is found on liver-resident KCs. After hepatic viral infection, high levels of PD-L1 expression on KCs, liver sinusoidal endothelial cells (LSEC), non-resident macrophages (Mø), dendritic cells (DC), NK cells, T cells, and low levels by hepatocytes are observed.19,20 Monoclonal antibodies are typically used to block PD-1/PD-L1 negative signaling, but antibodies that interfere with immune suppression sometimes cause off-target side effects seen in clinical trials where ongoing autoimmune diseases similar to those found in PD-1−/− mice are exacerbated.21,22
Since the discovery of RNA interference (RNAi) by Fire and Mello in 1998,23 short-interfering RNA (siRNA) technology is promising in the clinical setting as specific and potent degradation of mRNA target sequences has been achieved in vivo.24,25,26 Thus far, in vitro electroporation of naked PD-L1 siRNA in DCs has been shown to effectively boost their ability to prime T cell responses in a cancer model.27 Achieving activity in the in vivo setting has proven difficult because the use of siRNA as a drug violates the “Lipinski rules” due to its large size (over 13 kDa), high electrostatic charge (~40 anionic charges on the phosphodiester backbone), and short half-life due to nucleases.28 As a result, much effort has not only been dedicated to applying siRNA chemical modifications to prevent immunostimulation and increase stability and specificity but also delivery systems. In this study, we tested a novel strategy for controlling Pdl1 expression through delivery of PD-L1 siRNA encapsulated in a cationic lipidoid nanoparticle (LNP) as the vehicle targeting myeloid cells.29,30 Previous work with virally infected PD-1−/− mice showed the global absence of PD-1 signaling is characterized by improved immune responses, proliferation, and antigen clearance,20 but the major cell source of PD-L1 and timing of PD-1 signaling is controversial. In contrast, targeted silencing of Pdl1 in the major disease-causing cell type reduces off-target effects, and the transient nature of PD-L1 siRNA silencing over the use of PD-1−/− and PD-L1−/− mice eliminates the potential of overlapping hyperactive immune responses.
We hypothesized that in vivo PD-L1 siRNA-based therapy targeted to myeloid cells in the liver would improve NK and CD8+ T cell responses to localized viral infections. We demonstrate KCs preferentially engulf PD-L1 LNP and are the first to show Pdl1 silencing in the liver results in improved NK and CD8+ T cell responses, viral clearance, and CD8+ T cell memory. These data provide a promising NK and CD8+ T cell nucleic acid therapy applicable to ongoing liver-tropic viral infections and hepatocellular carcinoma, vaccine development, and may also be pertinent to other diseases outside the liver governed by similar pathways and cell types. Further, targeting PD-L1 for transient knockdown directly on the disease-causing cell type may be beneficial over monoclonal antibody usage.
Results
Administration of PD-L1 siRNA LNP abrogates PD-L1 expression by KCs
The nanoparticles in this study were optimized by in vitro selection from hundreds of compounds and formulated using C12-200 lipid, disteroylphosphatidyl choline, cholesterol, PEG-DMG, and siRNA at a lipid:siRNA weight ratio of 7:1.29 Due to the cationic nature of LNPs, we hypothesized that highly phagocytic Møs and DCs are key targets in vivo, which is supported by our recent study in uninfected rodents and nonhuman primates.30 Animals were intravenously (IV) injected with fluorochrome-labeled siRNA LNP at day 5 (D5) post-infection with adenovirus (a timepoint at which most immune cell types, innate and adaptive, are present), and uptake was determined in LSEC, KC, infiltrating monocyte/Mø, DC, CD4+ T cell, CD8+ T cell, and NK cell populations. KCs proficiently engulfed the siRNA LNP over all other cell types examined (Figure 1a). Further, only the KCs had internalized the siRNA LNP in perinuclear vesicles (Figure 1b) and had the highest fluorescent internalization score (data not shown).
Figure 1.

siRNA LNP is primarily engulfed in small vesicles by KCs within the mononuclear cell pool. At D5 after intravenous (IV) infection with 2.5 × 10⁷ IU Ad-Ova, C57BL/6 mice were IV injected with either Alexa Fluor (AF) 488- or 647-labeled siRNA LNP. (a) After 1.5 hours, fluorochrome-labeled siRNA LNP injection, liver mononuclear cells were isolated, and the percentage of nanoparticle uptake was assessed in LSEC (CD45−CD105+CD146+), KC (CD11bloF4/80hi), infiltrating monocyte/Mø (MHC IIloCD11bhiCD11clo), DC (MHC IIhiCD11bhiCD11chi), CD4+ T cell (Thy1.2+CD4+), CD8+ T cell (Thy1.2+CD8+), and NK cell (NK1.1+CD3−) populations. Filled histograms represent animals that received Luc LNP. (b) Representative images of cells captured by the Amnis ImagestreamX stained with a surface lineage marker (yellow), DAPI (blue), and siRNA LNP (red) are depicted (n = 3 per group). DAPI, 4′,6-diamidino-2-phenylindole; DC, dendritic cell; IU, infectious unit; KC, Kupffer cell; LNP, lipidoid nanoparticle; LSEC, liver sinusoidal endothelial cell; MHC, major histocompatibility complex; NK, natural killer cell; siRNA, short-interfering RNA.
The specific PD-L1 siRNA was selected from 30 candidate sequences, chemically modified to enhance specificity and potency, and formulated into LNPs (PD-L1 LNP). We delivered 0.5 mg/kg PD-L1 LNP IV every other day starting one day before infection as pharmacodynamics indicated that this was an appropriate dose for gene silencing.30 Pdl1 knockdown was initially confirmed from D5 to D7 in infected livers using luciferase LNP (Luc LNP) as a control (Figure 2a). Western blot analysis of total liver PD-L1 also revealed similar kinetics (Figure 2b).
Figure 2.
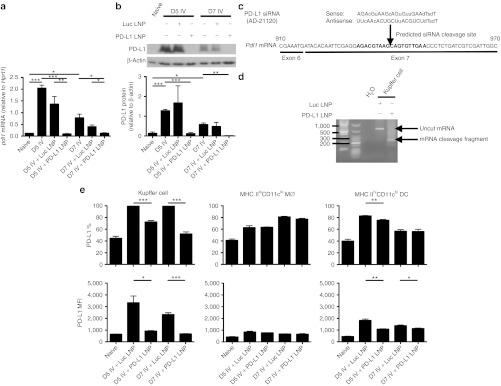
PD-L1 LNP silences Pdl1 mRNA expression via an RNAi mechanism in KCs leading to a decrease in PD-L1 protein expression. C57BL/6 mice were intravenously (IV) infected with 2.5 × 10⁷ IU Ad-Ova and received Luc LNP, PD-L1 LNP, or no drug treatment. Whole liver samples were taken at D5 and D7 post-infection. (a) Pdl1 mRNA expression was visualized by quantitative PCR (D5 P = 0.0002, D7 P = 0.0095, one-way ANOVA/Tukey's post-test; n = 3–8 per group), and (b) PD-L1 protein expression was assayed by western blotting and densitometry (D5 P = NS, D7 P = 0.0407, one-way ANOVA/Tukey's post-test; n = 3 per group). (c) The PD-L1 siRNA (AD-21120) sequence is depicted. (d) At D5 post-infection, C57BL/6 mice were IV injected with either Luc LNP or PD-L1 LNP. 5′-RACE PCR was performed on total RNA isolated from FACS-sorted KCs 4 hours after LNP injection, and the amplification products from a nested PCR were run on a 1.8% agarose gel. The predicted mRNA cleavage product derived from RNAi-mediated silencing is shown. (e) PD-L1 expression was assessed by FACS on KCs (CD11bloF4/80hi) (% D5 P = 0.0004, D7 P = 0.0002, MFI D5 P = 0.0134, D7 P = 0.0004), infiltrating monocytes/Mø (MHC IIloCD11bhiCD11clo) (P = NS), and DCs (MHC IIhiCD11bhiCD11chi) (% D5 P = 0.0092, D7 P = NS, MFI D5 P = 0.0035, D7 P = 0.0293) in naive animals and at D5 post-infection with PD-L1 LNP or control Luc LNP treatments. Filled histograms represent isotype controls and numbers indicate percentage (n = 3 per group). Mean ± SEM; *P < 0.05, **P < 0.01, and ***P < 0.001. ANOVA, analysis of variance; DC, dendritic cell; FACS, fluorescence-activated cell sorting; IU, infectious unit; KC, Kupffer cell; LNP, lipidoid nanoparticle; MFI, mean fluorescence intensity; MHC, major histocompatibility complex; NS, not significant; RNAi, RNA interference; siRNA, short-interfering RNA.
We next sought to determine whether Pdl1 silencing was occurring within KCs via an RNAi mechanism. The designed antisense PD-L1 siRNA strand binds positions 932-950 of exon 7 in Pdl1 with predicted cleavage occurring between positions 940-941 (Figure 2c). A 5′-rapid amplification of cDNA ends (5′-RACE) assay performed on total RNA isolated from FACS-sorted KCs established specific and potent silencing of Pdl1 was occurring via RNAi through detection of the ~250 bp Pdl1 cleavage product, confirmed by sequencing (Figure 2d). Enumeration of sequences revealed that PD-L1 LNP induced cleavage in 93.3% (14/15) of the clones. To determine whether direct silencing correlated with PD-L1 protein on the surface of antigen-presenting cells (APC), PD-L1 surface expression was analyzed on KC, infiltrating monocyte/Mø, and DC populations. Consistent with siRNA LNP uptake data, the most efficient knockdown was observed in KC populations. Similar to reduced uptake capacity by infiltrating monocytes/Møs and DCs, these cells showed modest or no PD-L1 knockdown. KCs had about a twofold higher level of surface PD-L1 per cell compared with other monocyte/Mø/DC populations (Figure 2e).
Imaging studies revealed that hepatocytes did not upregulate PD-L1 to any noticeable level post-infection as observed on F4/80+ (KCs) and CD105+ (LSECs) cells (Supplementary Figure S1). Though some PD-L1 knockdown was seen in LSECs, this appeared to be unrelated to direct Pdl1 silencing as the detectable biodistribution of siRNA LNP excluded these cell types (Figure 1). Perhaps microscopic techniques are not sensitive enough to detect low PD-L1 levels, which were observed directly ex vivo on non-KCs in these experiments and hepatocytes by Wahl et al.31 or after culture with interferon (IFN)-γ.32 Together, these data suggest that KCs primarily engulf PD-L1 LNP during viral infection. Unpackaging of PD-L1 siRNA leads to direct RNAi-mediated silencing of Pdl1 and downregulation of PD-L1 surface expression.
PD-L1 LNP treatment augments NK cell and antigen-specific CD8+ T cell accumulation, effector function, and memory
Since KCs play a role in initiating intrahepatic tolerance through PD-1/PD-L1,20,33 we hypothesized that CD8+ T cell effector function would be enhanced through downregulation of PD-L1. We also expanded our studies by examining NK cells as PD-1 expression on these cells correlates with human disease in chronic hepatitis C virus patients34 and other infectious and cancer models.8,10 Employing two different hepatic viruses expressing ovalbumin (adenovirus and MCMV), initial analysis of the liver homogenates revealed a significant increase in the number of mononuclear cells isolated following infection after PD-L1 LNP treatment (Supplementary Figure S2). NK cell absolute numbers peaked at D5 and displayed an enhanced kinetic profile after Pdl1 silencing with both viruses (Figure 3a) and produced more granzyme B (GrB) and PMA/ionomycin-induced IFN-γ (Figure 3b,c). Notably, improvements in NK cell function were limited to the Thy1.2+ subset. Gating on the entire NK cell population did not reveal any significant trends in effector function.
Figure 3.

NK cell function and accumulation are enhanced by full regimen PD-L1 LNP therapy in response to Ad-Ova and MCMV-Ova infection. C57BL/6 mice were intravenously (IV) infected with 2.5 × 10⁷ IU Ad-Ova or 1 × 10⁴ IU MCMV-Ova and either received Luc LNP or PD-L1 LNP at days −1, 1, and 3. (a) Liver mononuclear cells were collected, and NK cells (CD3−NK1.1+) were enumerated at days 0, 3, 5, and 7 (Ad-Ova D5 P = 0.0482; MCMV-Ova D5 P = 0.0263; n = 3–5 per group). NK cell IFN-γ was assessed after a 5-hour restimulation with 5 ng/ml PMA and 500 ng/ml ionomycin, and GrB was determined directly ex vivo for both (b) Ad-Ova (IFN-γ (%) P = 0.0443, MFI P = 0.0259; GrB (%) P = 0.0203, MFI P = 0.0496; n = 3–7 per group) and (c) MCMV-Ova (IFN-γ (%) P = 0.0491, MFI P = NS; GrB (%) P = 0.0183, MFI P = NS; n = 3–4 per group) at D5 post-infection. Numbers in the scatter plots represent percentages. Mean ± SEM; *P < 0.05 and **P < 0.01. IFN, interferon; IU, infectious unit; LNP, lipidoid nanoparticle; MFI, mean fluorescence intensity; NK, natural killer cell; NS, not significant.
Furthermore, Ova-specific CD8+ T cell absolute number peaked at D7 and enhanced accumulation to both infections was observed with PD-L1 LNP treatment (Figure 4a). Bulk CD8+ T cell GrB was statistically improved by D5 (data not shown) and continued into D7 where Ova-specific CD8+ T cell GrB was also elevated (Figure 4b,c). In contrast, there was no drastic increase in SIINFEKL peptide-induced IFN-γ by CD8+ T cells following PD-L1 LNP treatment (data not shown). Despite the incomplete acquirement of effector function, CD8+ T cells accumulated/expanded in the liver within distinct clusters of mononuclear cells. The number of foci was significantly higher after PD-L1 LNP treatment at D7 post-Ad-Ova infection, coinciding with the peak in T cell kinetics (Figure 5a). The CD8+ T cells in the clusters were associated with major histocompatibility complex (MHC) II+ cells, CD4+ T cells, B220+ B cells, and NKp46+ NK cells (Figure 5b). At D7 post-Ad-Ova infection, intrahepatic Ova-specific CD8+ T cells were proliferating greater in situ following PD-L1 LNP treatment as indicated by Ki-67 staining (Figure 5c). When infection was carried out to D40, more Ova Tet+CD8+ T cells accumulated in the liver and draining celiac lymph nodes but not the spleens and non-draining inguinal lymph nodes from PD-L1 LNP-treated animals (Figure 5d). The Ova Tet+CD8+ T cells in the D40 liver were notably CCR7−CD62L− (data not shown) and also underwent slightly more pronounced homeostatic cell division incorporating more BrdU (Figure 5e). Collectively, these data demonstrate that PD-L1 LNP treatment before and during the course of viral infection leads to a superior NK cell and antigen-specific CD8+ T cell response in the acute phase and greater CD8+ T cell memory at later stages.
Figure 4.
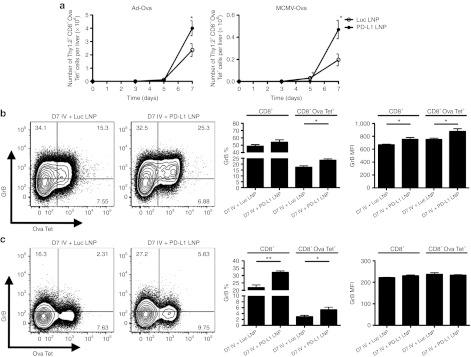
Ova-specific CD8+ T cell cytolytic function and accumulation are enhanced by full regimen PD-L1 LNP therapy in response to Ad-Ova and MCMV-Ova infection. C57BL/6 mice were intravenously (IV) infected with 1 × 10⁴ IU MCMV-Ova and either received Luc LNP or PD-L1 LNP at days −1, 1, 3, and 5. (a) Liver mononuclear cells were collected and the number of Ova-specific CD8+ T cells (Ova Tet+CD8+) was determined at days 0, 3, 5, and 7 (Ad-Ova D7 P = 0.0467, MCMV-Ova D7 P = 0.0326; n = 3–7 per group). GrB was determined directly ex vivo for both (b) Ad-Ova (CD8+ GrB (%) P = NS, MFI P = 0.0252; CD8+ Ova Tet+ GrB (%) P = 0.0177, MFI P = 0.0345; n = 3–4 per group) and (c) MCMV-Ova (CD8+ GrB (%) P = 0.0063, MFI P = 0.0344; CD8+ Ova Tet+ GrB (%) P = NS, MFI P = NS; n = 3–4 per group) infections. Numbers in the scatter plots represent percentages. Mean ± SEM; *P < 0.05 and **P < 0.01. IU, infectious unit; LNP, lipidoid nanoparticle; MFI, mean fluorescence intensity; NS, not significant.
Figure 5.

Full PD-L1 LNP treatment regimen boosts CD8+ T cell accumulation in clusters, acute proliferation, memory, and long-term homeostatic proliferation. C57BL/6 mice were intravenously (IV) infected with 2.5 × 10⁷ IU Ad-Ova and either received Luc LNP or PD-L1 LNP at days −1, 1, 3, and 5. (a) D7 liver sections from Ad-Ova–infected C57BL/6 mice were collected and stained with H&E. Arrows indicate discrete clusters. Bar, 200 µm. Inlay depicts lobular clusters in the D7 PD-L1 LNP-treated mice contained cells of mononuclear origin (n = 6 per group). Bar, 50 µm. (b) PLP-fixed/OCT-frozen liver cross-sections from D7 livers were stained with anti-MHC II (I-A/I-E) (blue), anti-CD4 (green), anti-CD8 (red), anti-B220 (magenta-upper panel), anti-NKp46 (magenta-lower panel) (n = 3 per group). Bar, 20 µm. (c) Ki-67 presence was determined through FACS analysis of Ova Tet+CD8+ T cells at D7 post-infection (P = 0.0080; n = 3 per group). (d) At D40 post-infection, the number and percentage of Ova Tet+CD8+ T cells were determined in the liver, spleen, C LN, and Ig LN (liver number P = 0.0492, % P = 0.0193; spleen P = NS; C LN number P = 0.0040, % P = 0.0134; Ig LN P = NS; n = 3–7 per group). (e) Seven days before a D40 harvest, 0.5 mg BrdU was administered intraperitoneally daily to mice. The number of Ova Tet+CD8+ T cells in G0/G1, S, and G2/M cell cycles was determined based on anti-BrdU/7-AAD staining (G0/G1 P = 0.0250; S P = 0.0392; G2/M P = NS; n = 3–4 per group). Numbers in the histograms and scatter plots represent percentages. Mean ± SEM; *P < 0.05 and **P < 0.01. C LN, celiac lymph node; DIC, differential interference contrast; FACS, fluorescence-activated cell sorting; H&E, hematoxylin and eosin; Ig LN, inguinal LN; IU, infectious unit; LNP, lipidoid nanoparticle; MHC, major histocompatibility complex; NS, not significant; OCT, optimal cutting temperature; PLP, paraformaldehyde fixative; siRNA, short-interfering RNA.
CD8+ T cell–dependent hepatic viral clearance is enhanced by PD-L1 pathway blockade
To test whether silencing of Pdl1 led to improved viral clearance, hepatocytes were labeled with anti-pancytokeratin (panCK) and anti-Ova antibodies. Virally infected hepatocytes (panCK+Ova+) could be detected out to D5 in Luc LNP treatment groups and were undetectable in PD-L1 LNP-treated animals (Figure 6a). When enumerating the number of infected hepatocytes per mm2 liver tissue, this difference was statistically significant (Figure 6b). Total RNA was also isolated, and Ova transcript in Luc LNP and PD-L1 LNP groups was compared at D5 post-infection confirming microscopy results (Figure 6c).
Figure 6.

PD-L1 LNP enhances CD8+ T cell–mediated viral clearance. PLP-fixed/OCT-frozen liver cross-sections were obtained from naive C57BL/6 mice or mice at D5 after intravenous (IV) infection with 2.5 × 10⁷ Ad-Ova that had received either full regimen Luc LNP or PD-L1 LNP. (a) Sections were stained with anti-panCK (green) signifying hepatocytes, anti-Ova (red) marking virally infected cells, anti-CD105 (magenta) for LSECs, and DAPI (blue) with a representative collection of images shown. Bar, 100 µm. (b) Hepatocytes that were virally infected (panCK+Ova+ cells) were enumerated per field of view D5 post-infection (P = 0.0147 one-way ANOVA/Tukey's post test; n = 3 per group). (c) Total RNA from D5 whole liver samples was collected and Ova mRNA was measured by quantitative PCR. To deplete CD8+ T cells, 300 µg anti-CD8 Ab was administered intraperitoneally to C57BL/6 mice 1 day before infection along with full regimen Luc or PD-L1 LNP (P = 0.0158 one-way ANOVA/Tukey's post-test; n = 4–9 per group). Mean ± SEM; *P < 0.05, **P < 0.01, and ***P < 0.001. Ab, antibody; ANOVA, analysis of variance; DAPI, 4′,6-diamidino-2-phenylindole; LNP, lipidoid nanoparticle; LSEC, liver sinusoidal endothelial cell; OCT, optimal cutting temperature; PLP, paraformaldehyde fixative.
NK cells and CD8+ T cells are largely responsible for clearing virally infected cells in various situations. As responses from these two populations were clearly enhanced by PD-L1 LNP, we next sought to dissect the role played by each cell type for viral clearance. To determine whether CD8+ T cells played a role in viral clearance in the liver, mice were given anti-CD8 antibody intraperitoneally (IP) (Supplementary Figure S3). Anti-CD8 antibody treatment had no effect on D5 viral clearance in Luc LNP-treated animals, but it significantly increased viral load in the PD-L1 LNP treatment group back to levels comparable to untreated or anti-CD8 antibody/Luc LNP-treated animals (Figure 6c). Presumably, any residual viral clearance mediated by NK cells was unrelated to siRNA LNP treatment as all enhanced viral clearance due to silencing PD-L1 could be accounted for by the depletion of CD8+ T cells. These results confirm that PD-L1 LNP, like anti-PD-L1 antibody, is able to hasten viral clearance in a CD8+ T cell–dependent manner.
Pdl1-silenced KCs directly improve CD8+ T cell expansion and effector function
We next examined whether Pdl1-silenced KCs directly affected CD8+ T cell effector function. Treatment with PD-L1 LNP was therefore conducted at D5 post-infection. D5 marks the point when NK cells reach their maximum influx in the liver and begin to decline (Figure 3a). As expected, when PD-L1 LNP was administered at D5, Ova Tet+CD8+ T cells increased in number for both infections (Figure 7a) and they produced significantly more IFN-γ and GrB (Figure 7b,c). Delayed PD-L1 LNP treatment still enhanced viral clearance at D7 (Supplementary Figure S4). Collectively, these data imply enhanced viral clearance due to PD-L1 LNP is CD8+ T cell-mediated.
Figure 7.

D5 PD-L1 LNP treatment enhances CD8+ T cell accumulation and full effector function. (a) C57BL/6 mice were intravenously (IV) infected with either 2.5 × 10⁷ IU Ad-Ova or 1 × 10⁴ IU MCMV-Ova, and the number of Ova Tet+CD8+ T cells was determined at D7 post-infection (Ad-Ova D7 P = 0.0063; MCMV-Ova D7 P = 0.0222; n = 4 per group). In all experimental groups, Luc LNP or PD-L1 LNP was injected at only D5, after the peak in NK cell presence. Antigen-specific CD8+ T cell IFN-γ was assessed after a 5-hour restimulation with 2 µg/ml SIINFEKL peptide, and GrB was determined directly ex vivo for both (b) Ad-Ova (IFN-γ (%) P = 0.0047, MFI P = 0.0094; CD8+ GrB (%) P = 0.0040, MFI P = 0.0167; CD8+ Ova Tet+ GrB (%) P = 0.0199, MFI P = NS; n = 4 per group) and (c) MCMV-Ova (IFN-γ (%) P = 0.0369, MFI P = NS; CD8+ GrB (%) P = 0.0002, MFI P = 0.0147; CD8+ Ova Tet+ GrB (%) P = 0.0336, MFI P = 0.0016; n = 4 per group) infections. Numbers in the scatter plots represent percentages. Mean ± SEM; *P < 0.05, **P < 0.01, and ***P < 0.001. IFN, interferon; IU, infectious unit; LNP, lipidoid nanoparticle; MFI, mean fluorescence intensity; NK, natural killer cell; NS, not significant.
In order to verify this phenotype was due to the presence of Pdl1-silenced KCs, clodronate liposomes were IV injected at D3 in order to specifically deplete this population before siRNA LNP delivery at D5. KCs were successfully depleted at a 55 mg/kg clodronate liposome dosage while other monocyte/Mø/DC populations remained unaffected (Supplementary Figure S5). Control liposomes had no effect on CD8+ T cell infiltrate, as a D5 PD-L1 LNP treatment was able to improve Ova-specific CD8+ T cell absolute number comparable to Figure 7a. In contrast, depletion of KCs at D3 post-infection with Ad-Ova, regardless of Luc or PD-L1 LNP treatment, resulted in a slight decrease of the Ova-specific CD8+ T cell percentage and absolute number (Figure 8a). Similar results were also observed in mice that received no siRNA LNP at D5 (data not shown), ruling out some unknown chemical reaction was occurring between the LNP coating containing the siRNA and liposomal membranes surrounding the clodronate. These data suggest KCs are involved in supporting the expansion of virus-specific CD8+ T cells.
Figure 8.

KCs are necessary for optimal expansion of CD8+ T cells and mediate their IFN-γ production. C57BL/6 mice were intravenously (IV) infected with 2.5 × 10⁷ IU Ad-Ova, IV injected with control or 55 mg/kg clodronate liposomes at D3 post-infection, and IV injected with Luc or PD-L1 LNP at D5 post-infection. (a) The number of Ova Tet+CD8+ T cells was calculated at D7 post-infection in each experimental group (P = 0.0003 one-way ANOVA/Tukey's post-test; n = 3 per group). (b) IFN-γ was assessed after a 5-hour restimulation with 2 µg/ml SIINFEKL peptide (IFN-γ (%) P = 0.0015, MFI P = NS one-way ANOVA/Tukey's post test; n = 3 per group). Numbers in the scatter plots represent percentages. Mean ± SEM; *P < 0.05, **P < 0.01, and ***P < 0.001. ANOVA, analysis of variance; IFN, interferon; IU, infectious unit; KC, Kupffer cell; LNP, lipidoid nanoparticle; MFI, mean fluorescence intensity.
In addition, we examined Ova-specific CD8+ T cell effector function in the liver during viral infection by analyzing the production of IFN-γ and GrB. After control liposome administration, IFN-γ production in the PD-L1 LNP group was significantly elevated compared with the Luc LNP group. Furthermore, depletion of KCs by clodronate treatment significantly improved Ova Tet+CD8+ T cell IFN-γ production by percentage regardless of Luc or PD-L1 LNP treatment. IFN-γ mean fluorescence intensity also followed a similar trend (Figure 8b). Ova Tet+CD8+ T cell GrB was not improved via clodronate-mediated KC depletion (data not shown). These results suggest that KCs are a major contributor to regulating CD8+ T cell effector function, in particular, the production of IFN-γ through PD-1/PD-L1 signaling.
Discussion
In this report, we demonstrate that the in vivo delivery of PD-L1 siRNA contained within LNPs resulted in specific and potent RNAi-mediated silencing of Pdl1 mRNA within KCs. Depending on the timing of siRNA LNP administration, either before or after the peak in NK cell accretion, Pdl1 silencing improved NK cell or virus-specific CD8+ T cell effector function. The optimal priming and expansion of CD8+ T cells required NK cell help (data not shown), but an enhanced, non-redundant role in viral clearance due to PD-L1 downregulation was highly dependent on CD8+ T cell presence. To our knowledge, this is the first successful application of in vivo siRNA delivery in modulating the immune response in the liver.
The critical role of the KC PD-L1 in impairing CD8+ T cell responses has been well established during hepatic viral infection20,35 and hepatocellular carcinoma.33 Notably, our studies demonstrate that viral infection-induced PD-L1 expression is at the highest level per cell on KCs, but low levels of PD-L1 were detected on the surface of LSECs, Møs, and DCs. The precise role of LSEC PD-L1 in antiviral responses still remains unclear because PD-L1 LNP does not achieve differential KC versus LSEC PD-L1 protein knockdown. A recent report by Mueller et al. indicated the contribution of hematopoietic versus non-hematopoietic PD-L1 expression to the generation of T cell responses against LCMV CL-13 infection. In the lungs and spleens of infected animals, hematopoietic cells from PD-L1−/− mice led to improvements in the magnitude and effector function of T cells, whereas non-hematopoietic cells from PD-L1−/− mice separately improved viral clearance. Interestingly, livers in these animals showed different results such that PD-L1−/− on hematopoietic cells was sufficient to improve both T cell responses and viral clearance. Although PD-L1−/− on non-hematopoietic cells seemed to slightly improve liver viral clearance, viral clearance was not optimal unless a global knockdown of PD-L1 was achieved.36 When KCs were selectively depleted with clodronate liposomes in these series of experiments, CD8+ T cell expansion was diminished, IFN-γ production was improved in Ova-specific CD8+ T cells responding to infection, and GrB was unaltered. Although, we cannot rule out the possibility that other cells including inflammatory monocytes/Møs/DCs play a role in boosting CD8+ T cell responses to viral infection in the liver via the PD-1/PD-L1 signaling pathway, these results suggest that KCs are a major contributor to regulating CD8+ T cell expansion and IFN-γ production. Combined, these findings favor the notion that PD-L1 expressed by KCs is central in regulating NK and T cell responses to viruses in the liver.
Prior research has also demonstrated that hepatocyte PD-L1 can directly dampen effector CD8+ T cell responses in vitro.31 Hepatocyte PD-L1 does not play a drastic role in dampening NK and CD8+ T cell responses to adenovirus and MCMV because we have tested another siRNA nanoparticle formulation whereby the PD-L1 siRNA was targeted for uptake specifically by hepatocytes (data not shown). In this case, the nanoparticles were designed to preferentially bind low-density lipoprotein in circulation, and through low-density lipoprotein receptor-mediated endocytosis, nanoparticles are internalized by interaction with apolipoprotein B100, a protein largely expressed by hepatocytes.37 Consistent with a low level or lack of PD-L1 expression by hepatocytes after Ad-Ova infection in mice (Supplementary Figure S1), this hepatocyte-specific targeting system did not result in enhanced absolute number or functional data pertaining to total mononuclear cells, NK cells, or T cells (data not shown). In lieu of research performed by Mueller et al., hepatocyte PD-L1 may dampen viral clearance, but it does not appear critical in preventing the priming or expansion of the immune response.
Our studies demonstrate that Pdl1 silencing in KC populations improves NK cell and CD8+ T cell accumulation and function. Upon Pdl1 silencing at the early phase of viral infection, NK cell functional improvements were limited to the Thy1.2+ population at D5. Interestingly, the Thy1 surface protein has been recently shown to be a NK cell memory marker where Gillard et al. find that Thy1+ NK cells protect mice from secondary vaccinia viral infection, are more functional in vitro, and expand better when transferred into congenic animals.38 Although the function of Thy1 has not been fully elucidated, it is believed to be involved with cell–cell interaction and extracellular matrix binding in T cells providing a TCR-independent activation signal.39
Potential mechanism(s) for superior CD8+ T cell responses by PD-L1 LNP treatment remains to be elucidated. It is likely that enhanced CD8+ T cell responses occur through their direct interaction with Pdl1-silenced KCs. However, NK cells40,41 or CD4+ T cells42 can play a role in shaping CD8+ T cell responses. It is possible that CD8+ T cell responses are enhanced indirectly via KC/NK cell cross-talk. In our studies, we observed that PD-L1 LNP-mediated silencing before viral infection failed to elicit CD8+ T cell responses when NK cells were depleted (J.S. Dolina and Y.S. Hahn, unpublished results) or induced poor CD8+ T cell responses incapable of producing IFN-γ in the presence of NK cells. These results support that Pdl1 silencing does not override a fundamental NK cell signal required for CD8+ T cell priming. Regarding the contribution of CD4+ T cell help, the analysis of bulk CD4+ T cells indicates that these cells did not significantly expand after viral infection with Ad-Ova nor displayed PD-L1 LNP-mediated functional improvements including IFN-γ (data not shown). This finding is consistent with a series of experiments performed by Wuensch et al. demonstrating that after direct intrahepatic infection with adenovirus, the endogenous CD8+ T cell response was not altered in MHC II−/− mice. In addition, after adoptive transfer of either OT-I CD8+ T cells or OT-II CD4+ T cells, only OT-I CD8+ T cells were capable of expanding in infected recipient mice.43 Further experimentation is needed to elucidate the immunostimulatory mechanism connecting Pdl1-silenced KCs with NK/CD8+ T cell function or the alteration of CD4+ T cell function. Nevertheless, when designing drug treatment protocols for the blockade of PD-1/PD-L1 signaling, it is favorable to delay PD-L1 LNP to a timepoint between the peaks in NK and T cell kinetics in order to favor optimal priming and prevent dampening of the polyfunctional CD8+ T cell response.
As CD8+ T cell–dependent viral clearance is observed from D5 to D7, the boosted NK and CD8+ T cell accumulation and function was also accompanied by an increase in serum alanine aminotransferase in infected animals at D7 (data not shown). Considering the balance between increased immunity and immunopathology, this is most likely transient as signs of hepatocyte regrowth are also apparent at D7 (data not shown) and no mortality was observed associated with hepatic injury up to D40 after treatment. In fact, elevated alanine aminotransferase at D7 is correlative evidence that CD8+ T cells are cytolytically killing infected hepatocytes at the peak in their kinetics.
The potential clinical impact of in vivo PD-L1 siRNA delivery is promising. siRNA has advantages over antibody- or small molecule inhibitor-based approaches since siRNA is easy to synthesize and lead identification and optimization to targets is rapid. The main challenge in siRNA drug development is targeting and efficaciously delivering the siRNA to the proper organs and disease-causing cell types. C12-200–based LNP can be used to block diseases mainly initiated by myeloid cells of the spleen, liver, and bone marrow due to its bioavailability after IV administration. This was established with LNP comprised of C12-200 lipid containing CCR2 siRNA.44 IP delivery of polyethylenimine-based nanoparticles, a different cationic moiety, containing PD-L1 siRNA was also demonstrated to elicit antitumor immunity in an ovarian tumor model, but polyethylenimine and other vehicles including viral delivery systems are often toxic and can stimulate immune responses themselves.45 Pdl1 silencing may also be applied to hepatocellular carcinoma because KC PD-L1 upregulation and CD8+ T cell dysfunction correlate with a worse prognosis in humans.33 Although siRNA technology is still in its infancy, the clinical potential continues beyond curing viral infection including cancer, heart disease, and diabetes.
These data are novel with clear demonstration that Pdl1 is effectively silenced in KCs via in vivo administration of PD-L1 siRNA. Silencing of Pdl1 effectively improves the NK cell and CD8+ T cell responses to hepatotropic viral infection. Polyfunctional CD8+ T cell responses that could directly clear virally infected cells were only observed if PD-L1 LNP was given after the wave of accumulating NK cells. It will be exciting in future studies to learn the extent of application of this novel biotechnology from vaccine development toward resolving chronic liver disease and diseases elsewhere controlled by similar mechanisms.
Materials and Methods
PD-L1 siRNA selection and LNP preparation. A total of 30 siRNAs with 100% homology with Mus musculus Pdl1 (sequence NM_021893.2) were selected using proprietary algorithms. Single-stranded RNAs were produced, annealed into duplexes,46 and transfected into BNL and NMuLi liver epithelial cell lines using Lipofectamine RNAiMAX transfection reagent (Invitrogen, Carlsbad, CA) at 0.1 and 10 nmol/l. mRNA levels were quantified 24 hours after transfection by quantitative PCR and normalized to Mus musculus Gapdh (Applied Biosystems, Foster City, CA). siRNA duplexes showing best knockdown were selected for 12-point dose-response ranging from 10 nmol/l to 0.01 pmol/l to determine the IC50 (half maximal inhibitory concentration) values. The most potent duplex with the sequence AGAcGuAAGcAGuGuuGAAdTsdT (sense), UUcAAcACUGCUuACGUCUdTsdT (antisense) was selected for scale up and LNP formulation. As a negative control a siRNA duplex for luciferase was used, with the sequence cuuAcGcuGAGuAcuucGAdTsdT (sense), UCGAAGuACUcAGCGuAAGdTsdT (antisense). Small case letters represent residues with 2′-OMe modifications. Deoxythymidine (dTdT) was added to 3′-ends to protect from exonuclease degradation. PD-L1 specific and control siRNAs were formulated into 70–80 nm LNPs with C12-200 as the primary cationic lipid as described.29
Animals, infections, and treatments. C57BL/6 mice were used in these experiments (Taconic Farms, Hudson, NY). Animals used were 6–10 weeks of age and housed in a pathogen-free facility under protocols approved by the Institutional Animal Care and Use Committee at the University of Virginia (Charlottesville, VA).
Replication-deficient type 5 adenovirus lacking the E1 and E3 genes and expressing the ovalbumin protein under the control of the human CMV promoter (Ad-Ova) was provided by Timothy L Ratliff (Iowa Gene Transfer Vector Core, University of Iowa, Iowa City, IA). Mouse cytomegalovirus expressing the ovalbumin protein fused to the transferrin receptor under the control of the HCMV IE1 promoter (MIEP) (MCMV-Ova) was provided by Ann B Hill (Oregon Health and Science University, Portland, OR). Mice were infected with 2.5 × 10⁷ infectious units Ad-Ova or 1 × 10⁴ infectious units MCMV-Ova via IV injection in the caudal vein.
Mice were IV injected with 0.5 mg/kg LNP containing luciferase siRNA (Luc LNP) or PD-L1 siRNA (PD-L1 LNP) at days −1, 1, 3, and 5 or only day 5 relative to day 0 infection. For siRNA LNP uptake experiments, mice were IV injected with 0.5 mg/kg AF488- or AF647-labeled siRNA LNP at day 5 post-infection, and liver mononuclear cells were harvested 1.5 hours later (Alnylam Pharmaceuticals, Cambridge, MA). For CD8+ T cell depletion, mice were IP injected with 300 µg anti-CD8 (2.43) (BioXCell, West Lebanon, NH) 1 day before infection. For KC depletion, mice were IV injected with control or clodronate liposomes (Encapsula NanoSciences, Nashville, TN) at day 3 post-infection. Clodronate liposomes were titrated prior to prevent an off-target effect, and a low concentration (55 mg/kg) achieved differential tissue KC and tissue/blood-borne/bone marrow monocyte/Mø/DC depletion.
Quantitative Reverse-transcription PCR. Total RNA was isolated using the Trizol method (Invitrogen), and reverse-transcribed using High Capacity RNA-to-cDNA Master Mix (Applied Biosystems). Quantitative PCR was performed using Fast SYBR Green Master Mix (Applied Biosystems) on an AB StepOne Plus Real-Time PCR System. QuantiTect primers for Gallus gallus Ova, Mus musculus Pdl1 (Qiagen, Valencia, CA), and self-designed primers for Mus musculus hypoxanthine phosphoribosyltransferase (Hprt1; forward, 5′-CTCCGCCGGCTTCCTCCTCA-3′ reverse, 5′-ACCTGGTT CATCATCGCTAATC-3′) were used for detection. Data were generated by the comparative threshold cycle (ΔCT) method by normalizing to Hprt1.
5′-RACE PCR. C57BL/6 mice were given 0.5 mg/kg Luc LNP or PD-L1 LNP IV, and KCs were isolated by FACS-sorting 4 hours later. Approximately 50 ng of RNA isolated from sorted cells using the GenElute Mammalian Total RNA Miniprep Kit (Sigma-Aldrich, St Louis, MO) was used for 5′-RACE PCR using the GeneRacer Kit (Invitrogen). Briefly, RNA was dephosphorylated for 1 hour at 50 °C with calf intestinal alkaline phosphatase, decapped for 1 hour at 37 °C with tobacco acid pyrophosphatase, and ligated to an RNA oligonucleotide for 1 hour at 37 °C with T4 RNA ligase. RNA was reverse-transcribed using a gene-specific primer (Pdl1; reverse, 5′-GACCTCTGTGTTCCCTGCTTG-3′) with SuperScript III RT (Invitrogen). Nested PCR was performed using Platinum Taq DNA Polymerase High Fidelity (Invitrogen) on a BioRad C1000 Thermal Cycler (BioRad, Hercules, CA). First round PCR primers (GeneRacer; forward, 5′-CGACTGGAGCACGAGGACACTGA-3′ Pdl1; reverse, 5′-ACGGAGGATGCTAAGCAGCAGTTG-3′) and nested PCR primers (GeneRacer; forward, 5′-GGACACTGACATGGAC TGAAGGAGTA-3′ Pdl1; reverse, 5′-CCCGGCACTGAGCAG AGGAAAAG-3′) were used for detection. PCR products were separated by electrophoresis on a 1.8% agarose gel. cDNA bands were excised, purified on S.N.A.P. columns, and incubated for 4 hours at 16 °C with pCR4-TOPO vector. TOP10 Escherichia coli chemically competent cells were transformed and plated overnight at 37 °C (Invitrogen). Ampicillin-resistant clones were expanded; plasmids were isolated using a QIAprep Spin Miniprep Kit (Qiagen) and sequenced on an AB 3730 DNA Analyzer using M13 reverse primers (Invitrogen).
Western blot. Whole liver sections were homogenized, protein concentration was determined using the Pierce BCA Protein Assay Kit (Thermo Scientific, Rochester, NY), and proteins were resolved by electrophoresis on 10% SDS-polyacrylamide gels and transferred to nitrocellulose membranes. Membranes were then incubated with biotinylated anti-PD-L1 pAb, biotinylated anti-β-actin (AC-15), and streptavidin-HRP (R&D Systems, Minneapolis, MN) followed by visualization with SuperSignal West Pico Chemiluminescent Substrate (Thermo Scientific). Optical densitometry was performed using ImageJ 1.38x software (NIH, Bethesda, MD).
Liver mononuclear cell isolation. Mononuclear cells were isolated from livers according to previous work.35,47,48 Briefly, livers were flushed via the portal vein with 0.05% collagenase IV (Sigma-Aldrich) in 1× phosphate-buffered saline (PBS) and washed with Iscove's modified Dulbecco's medium containing 10% newborn calf serum. Liver tissue was then homogenized and further digested with 0.05% collagenase IV in 1× PBS. Mononuclear cells were then isolated via Histodenz (Sigma-Aldrich) gradient centrifugation, and the number of viable cells was determined based on 0.1% Trypan blue (Sigma-Aldrich) exclusion.
Flow cytometry. The following monoclonal Abs were used for cell surface and intracellular staining: anti-CD4 PerCP-Cy5.5 (RM4-5), anti-CD11b PE-Cy7 (M1/70), anti-Ki-67 PE (B56) (BD Biosciences, Franklin Lakes, NJ), anti-CD105 AF647 (MJ7/18), anti-CD105 PE (MJ7/18), anti-CD146 AF488 (ME-9F1), anti-MHC II (I-A/I-E) AF680 (M5/114.15.2), anti-Thy1.2 AF594 (53-2.1) (BioLegend, San Diego, CA), anti-CD3ε PerCP-Cy5.5 (145-2C11), anti-CD8α APC-eF780 (53-6.7), anti-CD11c PerCP-Cy5.5 (N418), anti-CD45 eF450 (30-F11), anti-F4/80 APC (BM8), anti-F4/80 PE (BM8), anti-IFN-γ APC (XMG1.2), anti-MHC II (I-A/I-E) FITC (M5/114.15.2), anti-NK1.1 APC (PK136), anti-NK1.1 FITC (PK136), anti-PD-L1 PE (M1H5), anti-Thy1.2 eF450 (53-2.1) (eBioscience, San Diego, CA), and anti-granzyme B PE (GB12) (Invitrogen). H2-Kb Ova-tetramer (SIINFEKL) APC (MHC Tetramer Core Laboratory, Baylor College of Medicine, Houston, TX) was used to identify Ova-specific CD8+ T cells. Cell surface staining of 1.5 × 10⁶ mononuclear cells was performed by first blocking with anti-CD16/CD32 (2.4G2) (Lymphocyte Culture Center, University of Virginia, Charlottesville, VA) followed by specific antibody labeling for 15 minutes at 4 °C in FACS Buffer (1× PBS containing 2% fetal bovine serum and 0.1% NaN3). Cells were fixed in BD Cytofix/Cytoperm (BD Biosciences). For intracellular cytokine detection, cells were restimulated with 5 ng/ml PMA and 500 ng/ml ionomycin (Sigma-Aldrich) or 2 µg/ml SIINFEKL peptide (AnaSpec, Fremont, CA), blocked with 1 µl/ml GolgiPlug and 1 µl/ml GolgiStop, and permeabilized with BD Perm/Wash (BD Biosciences). For BrdU cell proliferation assays, 0.5 mg BrdU was administered IP daily to mice, and cells were stained with anti-BrdU FITC and 7-AAD using the BrdU Flow Kit (BD Biosciences). Data were collected on a BD FACS Canto II (BD Immunocytometry Systems, San Jose, CA) and analyzed using FlowJo 8.8.6 software (Tree Star, Ashland, OR). For analysis of PCR products, cells were sorted on an iCyt Reflection Cell Sorter (iCyt Mission Technology, Champaign, IL). For visualization of cells, images were captured on an Amnis ImagestreamX. Internalization scores were calculated using IDEAS 4.0 software (Amnis, Seattle, WA) by creating a cytoplasmic mask eroded 5 pixels in from the cell membrane defined by the brightfield image. The fraction of fluorescent pixels in the fluorochrome-labeled siRNA LNP channel was calculated as a ratio of pixels inside versus outside the mask.49
Microscopic studies. Livers were flushed with 1× PBS and periodate-lysine-paraformaldehyde fixative (PLP), excised, and then incubated in PLP for 3 hours at 4 °C according to previous work.50 After passage over a sucrose gradient, livers were frozen in OCT, sectioned at 5 µm thickness, blocked with 2.4G2 solution (2.4G2 media containing anti-CD16/32, 30% chicken/donkey/horse serum, and 0.1% NaN3), and stained with anti-Ova AF647 (pAb) (Antibodies-Online), anti-CD4 AF488 (RM4-5), anti-CD8α AF555 (53-6.7), anti-CD105 AF555 (MJ7/18), anti-CD105 AF647 (MJ7/18), anti-F4/80 AF488 (CI:A3-1), anti-MHC II (I-A/I-E) Pacific Blue (M5/114.15.2), anti-NKp46 AF647 (pAb) (BioLegend), anti-B220 APC (RA3-6B2) (eBioscience), anti-PD-L1 AF555 (pAb) (R&D Systems), DAPI (Roche, Indianapolis, IN), and anti-panCK AF488 (C-11) (Sigma-Aldrich). Confocal microscopy was performed on a Zeiss LSM-700 and the data were analyzed using Zen 2009 Light Edition software (Carl Zeiss MicroImaging, Jena, Germany). For hematoxylin and eosin staining, excised samples were incubated overnight in 10% buffered formalin acetate (Fisher Scientific, Pittsburgh, PA) at room temperature, washed with 1× PBS, and stored in 70% EtOH before paraffin embedding and sectioning. Brightfield microscopy was conducted on an Olympus BX51 (Olympus America, Center Valley, PA).
Statistical analysis. Significant differences between experimental groups were calculated using the two-tailed Student's t-test or one-way analysis of variance (with group comparisons ≥3). Data analysis was performed using Prism 5.0a software (GraphPad Software, La Jolla, CA). Values of P < 0.05 were regarded as being statistically significant and noted as * <0.05, ** <0.01, and *** <0.001.
SUPPLEMENTARY MATERIAL Figure S1. PD-L1 is preferentially downregulated on F4/80+ cells and CD105+ cells, but not hepatocytes, after PD-L1 LNP treatment. Figure S2. PD-L1 LNP augments liver mononuclear infiltrate. Figure S3. Anti-CD8 Ab effectively depletes CD8+ T cells. Figure S4. Enhanced viral clearance is observed during the D5 delay of PD-L1 LNP treatment. Figure S5. Clodronate liposomes effectively deplete Kupffer cells.
Acknowledgments
We thank Alnylam Pharmaceuticals siRNA synthesis and formulation groups for providing PD-L1 siRNA and lipidoid nanoparticles. This project was in part formed through a collaboration initiated by Antonin de Fougerolles, and we are grateful for a pilot grant on behalf of Alnylam Pharmaceuticals. We also give gratitude to Anna Borodovsky of Alnylam Pharmaceuticals for contributions to editing and experimental design. The University of Virginia Research Histology Core Facility and the University of Virginia Advanced Microscopy Facility kindly assisted in tissue preparation and confocal/brightfield imaging. Michael Solga and the University of Virginia Flow Cytometry Core Facility contributed to performing and outlining FACS-sorting and Amnis ImagestreamX experiments. National Institutes of Health grants DK063222, U19 AI083024, and Immunology Training Fellowship T32 AI07496 supported this publication. The authors declared no conflict of interest.
Supplementary Material
PD-L1 is preferentially downregulated on F4/80+ cells and CD105+ cells, but not hepatocytes, after PD-L1 LNP treatment.
PD-L1 LNP augments liver mononuclear infiltrate.
Anti-CD8 Ab effectively depletes CD8+ T cells.
Enhanced viral clearance is observed during the D5 delay of PD-L1 LNP treatment.
Clodronate liposomes effectively deplete Kupffer cells.
References
- Tiegs G., and, Lohse AW. Immune tolerance: what is unique about the liver. J Autoimmun. 2010;34:1–6. doi: 10.1016/j.jaut.2009.08.008. [DOI] [PubMed] [Google Scholar]
- Rehermann B., and, Nascimbeni M. Immunology of hepatitis B virus and hepatitis C virus infection. Nat Rev Immunol. 2005;5:215–229. doi: 10.1038/nri1573. [DOI] [PubMed] [Google Scholar]
- Neumann-Haefelin C, Blum HE, Chisari FV., and, Thimme R. T cell response in hepatitis C virus infection. J Clin Virol. 2005;32:75–85. doi: 10.1016/j.jcv.2004.05.008. [DOI] [PubMed] [Google Scholar]
- Callendret B., and, Walker C. A siege of hepatitis: immune boost for viral hepatitis. Nat Med. 2011;17:252–253. doi: 10.1038/nm0311-252. [DOI] [PMC free article] [PubMed] [Google Scholar]
- Keir ME, Freeman GJ., and, Sharpe AH. PD-1 regulates self-reactive CD8+ T cell responses to antigen in lymph nodes and tissues. J Immunol. 2007;179:5064–5070. doi: 10.4049/jimmunol.179.8.5064. [DOI] [PubMed] [Google Scholar]
- Dong H, Zhu G, Tamada K, Flies DB, van Deursen JM., and, Chen L. B7-H1 determines accumulation and deletion of intrahepatic CD8(+) T lymphocytes. Immunity. 2004;20:327–336. doi: 10.1016/s1074-7613(04)00050-0. [DOI] [PubMed] [Google Scholar]
- Carter L, Fouser LA, Jussif J, Fitz L, Deng B, Wood CR.et al. (2002PD-1:PD-L inhibitory pathway affects both CD4(+) and CD8(+) T cells and is overcome by IL-2 Eur J Immunol 32634–643. [DOI] [PubMed] [Google Scholar]
- Benson DM, Jr, Bakan CE, Mishra A, Hofmeister CC, Efebera Y, Becknell B.et al. (2010The PD-1/PD-L1 axis modulates the natural killer cell versus multiple myeloma effect: a therapeutic target for CT-011, a novel monoclonal anti-PD-1 antibody Blood 1162286–2294. [DOI] [PMC free article] [PubMed] [Google Scholar]
- Barber DL, Wherry EJ, Masopust D, Zhu B, Allison JP, Sharpe AH.et al. (2006Restoring function in exhausted CD8 T cells during chronic viral infection Nature 439682–687. [DOI] [PubMed] [Google Scholar]
- Alvarez IB, Pasquinelli V, Jurado JO, Abbate E, Musella RM, de la Barrera SS.et al. (2010Role played by the programmed death-1-programmed death ligand pathway during innate immunity against Mycobacterium tuberculosis J Infect Dis 202524–532. [DOI] [PubMed] [Google Scholar]
- Ishida Y, Agata Y, Shibahara K., and, Honjo T. Induced expression of PD-1, a novel member of the immunoglobulin gene superfamily, upon programmed cell death. EMBO J. 1992;11:3887–3895. doi: 10.1002/j.1460-2075.1992.tb05481.x. [DOI] [PMC free article] [PubMed] [Google Scholar]
- Chen Y, Wu S, Guo G, Fei L, Guo S, Yang C.et al. (2011Programmed death (PD)-1-deficient mice are extremely sensitive to murine hepatitis virus strain-3 (MHV-3) infection PLoS Pathog 7e1001347. [DOI] [PMC free article] [PubMed] [Google Scholar]
- Okazaki T., and, Honjo T. PD-1 and PD-1 ligands: from discovery to clinical application. Int Immunol. 2007;19:813–824. doi: 10.1093/intimm/dxm057. [DOI] [PubMed] [Google Scholar]
- Okazaki T., and, Honjo T. The PD-1-PD-L pathway in immunological tolerance. Trends Immunol. 2006;27:195–201. doi: 10.1016/j.it.2006.02.001. [DOI] [PubMed] [Google Scholar]
- Folkl A., and, Bienzle D. Structure and function of programmed death (PD) molecules. Vet Immunol Immunopathol. 2010;134:33–38. doi: 10.1016/j.vetimm.2009.10.006. [DOI] [PubMed] [Google Scholar]
- Fife BT, Pauken KE, Eagar TN, Obu T, Wu J, Tang Q.et al. (2009Interactions between PD-1 and PD-L1 promote tolerance by blocking the TCR-induced stop signal Nat Immunol 101185–1192. [DOI] [PMC free article] [PubMed] [Google Scholar]
- Krueger PD, Lassen MG, Qiao H., and, Hahn YS. Regulation of NK cell repertoire and function in the liver. Crit Rev Immunol. 2011;31:43–52. doi: 10.1615/critrevimmunol.v31.i1.40. [DOI] [PMC free article] [PubMed] [Google Scholar]
- Narni-Mancinelli E, Jaeger BN, Bernat C, Fenis A, Kung S, De Gassart A.et al. (2012Tuning of natural killer cell reactivity by NKp46 and Helios calibrates T cell responses Science 335344–348. [DOI] [PubMed] [Google Scholar]
- Loke P., and, Allison JP. PD-L1 and PD-L2 are differentially regulated by Th1 and Th2 cells. Proc Natl Acad Sci USA. 2003;100:5336–5341. doi: 10.1073/pnas.0931259100. [DOI] [PMC free article] [PubMed] [Google Scholar]
- Iwai Y, Terawaki S, Ikegawa M, Okazaki T., and, Honjo T. PD-1 inhibits antiviral immunity at the effector phase in the liver. J Exp Med. 2003;198:39–50. doi: 10.1084/jem.20022235. [DOI] [PMC free article] [PubMed] [Google Scholar]
- Zou W., and, Chen L. Inhibitory B7-family molecules in the tumour microenvironment. Nat Rev Immunol. 2008;8:467–477. doi: 10.1038/nri2326. [DOI] [PubMed] [Google Scholar]
- Melero I, Hervas-Stubbs S, Glennie M, Pardoll DM., and, Chen L. Immunostimulatory monoclonal antibodies for cancer therapy. Nat Rev Cancer. 2007;7:95–106. doi: 10.1038/nrc2051. [DOI] [PubMed] [Google Scholar]
- Fire A, Xu S, Montgomery MK, Kostas SA, Driver SE., and, Mello CC. Potent and specific genetic interference by double-stranded RNA in Caenorhabditis elegans. Nature. 1998;391:806–811. doi: 10.1038/35888. [DOI] [PubMed] [Google Scholar]
- Meade BR., and, Dowdy SF. The road to therapeutic RNA interference (RNAi): Tackling the 800 pound siRNA delivery gorilla. Discov Med. 2009;8:253–256. [PubMed] [Google Scholar]
- Novina CD., and, Sharp PA. The RNAi revolution. Nature. 2004;430:161–164. doi: 10.1038/430161a. [DOI] [PubMed] [Google Scholar]
- de Fougerolles A, Vornlocher HP, Maraganore J., and, Lieberman J. Interfering with disease: a progress report on siRNA-based therapeutics. Nat Rev Drug Discov. 2007;6:443–453. doi: 10.1038/nrd2310. [DOI] [PMC free article] [PubMed] [Google Scholar]
- Hobo W, Maas F, Adisty N, de Witte T, Schaap N, van der Voort R.et al. (2010siRNA silencing of PD-L1 and PD-L2 on dendritic cells augments expansion and function of minor histocompatibility antigen-specific CD8+ T cells Blood 1164501–4511. [DOI] [PubMed] [Google Scholar]
- Bumcrot D, Manoharan M, Koteliansky V., and, Sah DW. RNAi therapeutics: a potential new class of pharmaceutical drugs. Nat Chem Biol. 2006;2:711–719. doi: 10.1038/nchembio839. [DOI] [PMC free article] [PubMed] [Google Scholar]
- Love KT, Mahon KP, Levins CG, Whitehead KA, Querbes W, Dorkin JR.et al. (2010Lipid-like materials for low-dose, in vivo gene silencing Proc Natl Acad Sci USA 1071864–1869. [DOI] [PMC free article] [PubMed] [Google Scholar]
- Novobrantseva TI, Borodovsky A, Wong J, Klebanov B, Zafari M, Yucius K.et al. (2012Systemic RNAi-mediated gene silencing in nonhuman primate and rodent myeloid cells Mol Ther Nucleic Acids 1e4. [DOI] [PMC free article] [PubMed] [Google Scholar]
- Wahl C, Bochtler P, Chen L, Schirmbeck R., and, Reimann J. B7-H1 on hepatocytes facilitates priming of specific CD8 T cells but limits the specific recall of primed responses. Gastroenterology. 2008;135:980–988. doi: 10.1053/j.gastro.2008.05.076. [DOI] [PubMed] [Google Scholar]
- Kassel R, Cruise MW, Iezzoni JC, Taylor NA, Pruett TL., and, Hahn YS. Chronically inflamed livers up-regulate expression of inhibitory B7 family members. Hepatology. 2009;50:1625–1637. doi: 10.1002/hep.23173. [DOI] [PMC free article] [PubMed] [Google Scholar]
- Wu K, Kryczek I, Chen L, Zou W., and, Welling TH. Kupffer cell suppression of CD8+ T cells in human hepatocellular carcinoma is mediated by B7-H1/programmed death-1 interactions. Cancer Res. 2009;69:8067–8075. doi: 10.1158/0008-5472.CAN-09-0901. [DOI] [PMC free article] [PubMed] [Google Scholar]
- Golden-Mason L, Klarquist J, Wahed AS., and, Rosen HR. Cutting edge: programmed death-1 expression is increased on immunocytes in chronic hepatitis C virus and predicts failure of response to antiviral therapy: race-dependent differences. J Immunol. 2008;180:3637–3641. doi: 10.4049/jimmunol.180.6.3637. [DOI] [PubMed] [Google Scholar]
- Lukens JR, Cruise MW, Lassen MG., and, Hahn YS. Blockade of PD-1/B7-H1 interaction restores effector CD8+ T cell responses in a hepatitis C virus core murine model. J Immunol. 2008;180:4875–4884. doi: 10.4049/jimmunol.180.7.4875. [DOI] [PMC free article] [PubMed] [Google Scholar]
- Mueller SN, Vanguri VK, Ha SJ, West EE, Keir ME, Glickman JN.et al. (2010PD-L1 has distinct functions in hematopoietic and nonhematopoietic cells in regulating T cell responses during chronic infection in mice J Clin Invest 1202508–2515. [DOI] [PMC free article] [PubMed] [Google Scholar]
- Wolfrum C, Shi S, Jayaprakash KN, Jayaraman M, Wang G, Pandey RK.et al. (2007Mechanisms and optimization of in vivo delivery of lipophilic siRNAs Nat Biotechnol 251149–1157. [DOI] [PubMed] [Google Scholar]
- Gillard GO, Bivas-Benita M, Hovav AH, Grandpre LE, Panas MW, Seaman MS.et al. (2011Thy1+ NK [corrected] cells from vaccinia virus-primed mice confer protection against vaccinia virus challenge in the absence of adaptive lymphocytes PLoS Pathog 7e1002141. [DOI] [PMC free article] [PubMed] [Google Scholar]
- Haeryfar SM., and, Hoskin DW. Thy-1: more than a mouse pan-T cell marker. J Immunol. 2004;173:3581–3588. doi: 10.4049/jimmunol.173.6.3581. [DOI] [PubMed] [Google Scholar]
- Alter G., and, Altfeld M. Mutiny or scrutiny: NK cell modulation of DC function in HIV-1 infection. Trends Immunol. 2011;32:219–224. doi: 10.1016/j.it.2011.02.003. [DOI] [PMC free article] [PubMed] [Google Scholar]
- Liu ZX, Govindarajan S, Okamoto S., and, Dennert G. NK cells cause liver injury and facilitate the induction of T cell-mediated immunity to a viral liver infection. J Immunol. 2000;164:6480–6486. doi: 10.4049/jimmunol.164.12.6480. [DOI] [PubMed] [Google Scholar]
- Wiesel M., and, Oxenius A. From crucial to negligible: functional CD8+ T-cell responses and their dependence on CD4+ T-cell help. Eur J Immunol. 2012;42:1080–1088. doi: 10.1002/eji.201142205. [DOI] [PubMed] [Google Scholar]
- Wuensch SA, Spahn J., and, Crispe IN. Direct, help-independent priming of CD8+ T cells by adeno-associated virus-transduced hepatocytes. Hepatology. 2010;52:1068–1077. doi: 10.1002/hep.23745. [DOI] [PMC free article] [PubMed] [Google Scholar]
- Leuschner F, Dutta P, Gorbatov R, Novobrantseva TI, Donahoe JS, Courties G.et al. (2011Therapeutic siRNA silencing in inflammatory monocytes in mice Nat Biotechnol 291005–1010. [DOI] [PMC free article] [PubMed] [Google Scholar]
- Cubillos-Ruiz JR, Engle X, Scarlett UK, Martinez D, Barber A, Elgueta R.et al. (2009Polyethylenimine-based siRNA nanocomplexes reprogram tumor-associated dendritic cells via TLR5 to elicit therapeutic antitumor immunity J Clin Invest 1192231–2244. [DOI] [PMC free article] [PubMed] [Google Scholar]
- Frank-Kamenetsky M, Grefhorst A, Anderson NN, Racie TS, Bramlage B, Akinc A.et al. (2008Therapeutic RNAi targeting PCSK9 acutely lowers plasma cholesterol in rodents and LDL cholesterol in nonhuman primates Proc Natl Acad Sci USA 10511915–11920. [DOI] [PMC free article] [PubMed] [Google Scholar]
- Lukens JR, Dolina JS, Kim TS, Tacke RS., and, Hahn YS. Liver is able to activate naïve CD8+ T cells with dysfunctional anti-viral activity in the murine system. PLoS ONE. 2009;4:e7619. doi: 10.1371/journal.pone.0007619. [DOI] [PMC free article] [PubMed] [Google Scholar]
- Lassen MG, Lukens JR, Dolina JS, Brown MG., and, Hahn YS. Intrahepatic IL-10 maintains NKG2A+Ly49- liver NK cells in a functionally hyporesponsive state. J Immunol. 2010;184:2693–2701. doi: 10.4049/jimmunol.0901362. [DOI] [PMC free article] [PubMed] [Google Scholar]
- Ackerman ME, Moldt B, Wyatt RT, Dugast AS, McAndrew E, Tsoukas S.et al. (2011A robust, high-throughput assay to determine the phagocytic activity of clinical antibody samples J Immunol Methods 3668–19. [DOI] [PMC free article] [PubMed] [Google Scholar]
- McLean IW., and, Nakane PK. Periodate-lysine-paraformaldehyde fixative. A new fixation for immunoelectron microscopy. J Histochem Cytochem. 1974;22:1077–1083. doi: 10.1177/22.12.1077. [DOI] [PubMed] [Google Scholar]
Associated Data
This section collects any data citations, data availability statements, or supplementary materials included in this article.
Supplementary Materials
PD-L1 is preferentially downregulated on F4/80+ cells and CD105+ cells, but not hepatocytes, after PD-L1 LNP treatment.
PD-L1 LNP augments liver mononuclear infiltrate.
Anti-CD8 Ab effectively depletes CD8+ T cells.
Enhanced viral clearance is observed during the D5 delay of PD-L1 LNP treatment.
Clodronate liposomes effectively deplete Kupffer cells.