

Abstract
Objective
Obesity and decreased physical health are linked to deficits in several cognitive domains. The broad range of cognitive problems linked to obesity suggests a global mechanism that may interfere with multiple neural systems. We examined how variation in body mass index (BMI) is associated with the microstructural integrity of fiber connections in the human brain.
Methods
White matter structure was measured using diffusion tensor imaging in 28 participants (mean age = 30 years) with BMI scores ranging from normal weight to obese (19.5–45.7 kg/m2) based on standard BMI criteria.
Results
Using a whole-brain voxelwise analysis, we found that, across participants, the fractional anisotropy of white matter voxels parametrically decreased with increasing BMI (63% of white matter voxels). Midbrain and brainstem tracts were among the pathways most strongly associated with obesity (r = −0.18 to −0.33, df = 27, all p values < .05). We also observed a weaker overall diffusion signal in individuals with higher BMI than controls with normal weight (r = −0.14 to −0.71, df = 27, for 67% of fiber pathways tested, all p values < .05). After controlling for this decrease in general diffusivity, we found that decreases in fractional anisotropy stemmed from both a decrease in axial diffusivity (p < .05) and an increase in radial diffusivity (p < .05).
Conclusions
Our results show that increased BMI is globally associated with a reduction in white matter integrity throughout the brain, elucidating a potential mechanism by which changes in physical health may influence cognitive health.
Keywords: DTI, white matter, fractional anisotropy, body mass index, obesity
INTRODUCTION
More than a third of the US population is obese (1), and although this decrease in general physical health is usually not considered when assessing cognitive functions, a growing body of evidence suggests that increased obesity is associated with a variety of cognitive impairments. For example, obese individuals exhibit decreased inhibitory control (2–4), working memory (5), and executive control (6) as compared with otherwise healthy individuals. This reduction in cognitive abilities seems to be at least partially linked to cardiovascular health because improving physical health with aerobic exercise improves performance in a variety of cognitive domains such as inhibitory control, spatial memory, and task switching (7). Even in otherwise healthy adults, increased body mass index (BMI), a common quantification of general physical health, is associated with poorer performance on executive function tasks such as the Trail-Making Test and Stroop task (8).
This emerging evidence associating increased BMI with impairments in a variety of cognitive domains suggests a global mechanism by which physical health is related to altered neural functioning. However, most brain imaging studies examining the link between BMI and structural (e.g., gray matter volume) or functional (e.g., task-evoked responses) brain outcomes have focused on isolated cortical areas (9–18). One candidate mechanism by which increased BMI may be associated with neural processing is through the white matter that connects multiple brain regions. In this way, the local changes in the functional activity of cortical areas may be caused by fundamental changes in the axons that connect these regions. Indeed, it has recently been shown that increased BMI is associated with decreased white matter integrity in isolated sections of the corpus callosum and fornix fibers (16,19), with the former pathway being the principal interhemispheric connection for most major cortical areas.
The present study explores how increased BMI is associated with variation in the microstructure of white matter throughout the brain. Diffusion tensor imaging (DTI) was used to characterize the structure of white matter in a group of neurologically healthy individuals across the BMI spectrum. Using a whole-brain voxelwise regression approach, we set out to characterize how variation in BMI relates to the underlying fiber architecture across a distributed range of neural pathways.
MATERIALS AND METHODS
Participants
Neurologically healthy adults (N = 28; 17 females; mean age = 30 years; age range, 18–69 years) were recruited from the local Pittsburgh area. All participants were screened for contraindications to magnetic resonance imaging (MRI) and reported having no neurological conditions including prior head surgery, tumors, stroke, or disease (e.g., Parkinson disease, multiple sclerosis). Immediately before scanning, each participant’s BMI was determined by taking their height (H; in inches) and weight (W; in pounds) using a calibrated scale at the imaging facility and performing the following calculation:
| (Eq.1) |
A BMI value between 18.5 and 24.9 kg/m2 indicates normal weight, between 25 and 29.9 kg/m2 indicates overweight, and higher than 30 kg/m2 indicates obesity. These categories are used only for reference to standard criteria for obesity because BMI was used as a continuous variable in all data analyses reported here.
All testing was approved by the local institutional review board at the University of Pittsburgh. Written informed consent was obtained from all participants before experimentation.
Imaging Acquisition and Processing
Participants were scanned using a Siemens Allegra 3T MRI (Siemens Inc) located at the Brain Imaging Research Center at the University of Pittsburgh. White matter imaging was performed using a 50-direction DTI sequence (2.5-mm isotropic voxels; 40 slices; repetition time, 5500 milliseconds; echo time, 98 milliseconds; b = 1000 s/mm2). Each image is sensitive to the motion of underlying water molecules in a particular direction along a three-dimensional (3D) sphere. These are then used to estimate the structure of underlying water diffusion (see the next section). We also collected five b0 images that measure nondirectional water diffusion nested in the series to estimate head motion throughout the scan. This was followed by a structural T1 sequence (Magnetization Prepared Rapid Acquisition with Gradient Echo acquisition; 1-mm isotropic voxels; 256 slices; repetition time, 1400 milliseconds; echo time, 25 milliseconds) for anatomic comparisons.
All image data were reconstructed from k-space using in-house software and saved into the NIfTI image format (http://nifti.nimh.nih.gov/). It is well known that artifacts from eddy current (electric currents generated within the magnetic field due to parameters in the image acquisition process) and head motion can influence the quality of data on an individual participant basis (20). For both cases, rather than run correction algorithms, which can introduce unnecessary noise into the signal, we set up exclusion criteria for individuals who either presented with strong eddy-current artifacts (expressed as a white ring around the edge of the image and time-varying distortion across images) or head motion. A blind and independent observer, trained to identify eddy-current and fat signal artifacts, visually inspected each participant’s data. No eddy-current artifacts were present; however, this is not surprising given the speed of the gradients in the 3T Allegra scanner and the relatively low b-value used. Two participants (one with normal weight and the other who is overweight) contained detectible fat saturation artifacts that were visually determined to have minimal influence on overall results; therefore, they were included in the final analysis. For head motion, we estimated the translation and rotation movement components of five b0 images nested in the scan series (Images 1, 14, 27, 40, and 53) using standard motion estimation routines in SPM8 (Wellcome Trust Centre for Neuroimaging, London, UK). An exclusion criterion was set whereby if a participant’s head translated more than a single voxel in any given direction or was rotated more than 1 degree, then they would be excluded from analysis. No participant met these criteria (maximum translation, 1.63 mm; maximum rotation, 0.86 degree); therefore, all participants were included in the final analysis.
Initial reconstruction and analysis of the DTI data were performed with the standard diffusion tensor model using the Diffusion Toolkit software (http://trackvis.org/dtk/). This process estimates the eigenvalues (λ1, λ2, and λ3) for water diffusion in each voxel along three orthogonal directions. The first eigenvalue (λ1) reflects the strongest degree of directional diffusion. The next two eigenvalues (λ2 and λ3) estimate the diffusion in the plane orthogonal to the first component. From these values, we could then calculate three standard measures of white matter integrity: fractional anisotropy (FA), axial diffusivity (λ||), and radial diffusivity (λ⊥). These were calculated as follows:
| (Eq.2) |
| (Eq.3) |
| (Eq.4) |
where λ̂ is the trace of the eigenvalues, also known as the mean diffusivity. Figure 1 shows a graphical illustration of what each measure represents. FA is the most common white matter measure from DTI and represents the shape of the underlying water diffusion in each voxel (Fig. 1). Because barriers, such as the walls of axons, restrict water movement, its diffusion becomes more anisotropic. An FA value of 0 indicates perfectly spherical diffusion (i.e., no axons), whereas an FA value of 1 indicates water that moves in a perfect line (i.e., all water is contained in a single set of axons). In this way, larger FA values are assumed to reflect greater density and volume of underlying white matter. However, there are multiple ways in which FA may decrease. First, diffusion along the principal axon direction might drop, resulting in a corresponding reduction in λ||. Second, diffusivity in the orthogonal direction could increase, reflected as an increase in λ⊥. Variation in diffusion along the axial or radial diffusion plane reflects different types of changes to underlying axon structure (see Discussion). These values can also change independently of the degree of overall water diffusion (e.g., λ̂), which is independent of the overall shape of the underlying diffusion patterns. In the Diffusion Toolkit, FA is estimated using an ordinary least squares regression model. Along with the diffusion vectors, the Diffusion Toolkit also returns the apparent diffusion coefficient (ADC), which we used in subsequent analysis. ADC is a more traditional estimate of the energy of water diffusion and highly correlates with λ̂. Given the normalized nature of the FA calculation, changes in the overall degree of water diffusion (i.e., ADC) should have minimal impact on resulting voxel values; however, when assessing component changes in λ|| and λ⊥, global changes in ADC may significantly bias the resulting output. Therefore, ADC was used as both a secondary, global measure of white matter integrity and a control factor for exploring component changes in underlying water diffusion (see the next section).
Figure 1.
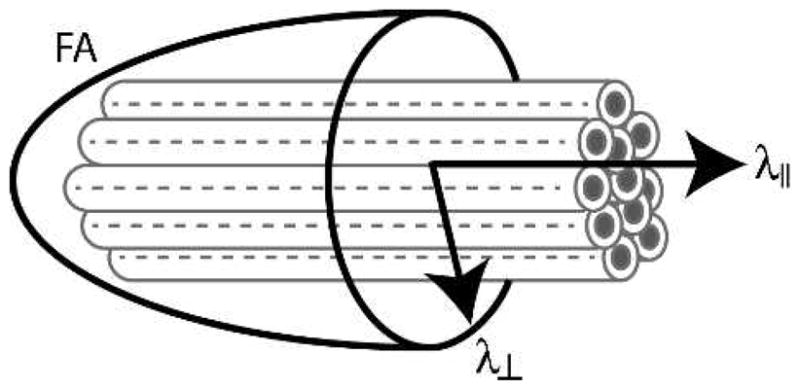
Modeling white matter structure with diffusion tensor imaging. Gray tubes represent axon bundles within a given voxel. Axial diffusivity (λ||) measures the degree of water diffusion in the principal direction of these fibers. Radial diffusivity (λ⊥) reflects diffusion in the orthogonal plane. Fractional anisotropy (FA) measures the relative anisotropy of water within the voxel (i.e., the standard deviation of the λ|| and λ⊥ measures).
For each participant, these measures of diffusivity were recorded for every voxel within the brain and then transformed into Montreal Neurological Institute template space using a nonlinear normalization routine in SPM8 (International Consortium for Brain Mapping space template regularization, 16 nonlinear iterations, 1-mm3 FA Montreal Neurological Institute template; FMRIB58_FA_1mm.nii) based on each participant’s FA map. A second alignment step was then performed using an affine linear registration method to manually adjust each participant’s normalized FA map to the group mean FA map. For this, all maps were thresholded at an FA of more than 0.2. This second registration step has been found to minimize cross-participant variance because of the suboptimal nature of the normalization process for diffusion imaging data (21). We then applied this registration to other statistical maps (i.e., λ||, λ⊥, ADC) to put all images into the same 3D space for group-level analyses. No image scaling was performed to preserve the total amount of signal in the normalized images because our pilot analysis found that this scaling parameter positively correlated with BMI and thus inflated any BMI-related effects observed in the underlying images. All normalized images were then smoothed with a 3D gaussian kernel (full width at half maximum, 4 mm) before the data analysis procedures described in the next section.
Data Analysis
We first set out to determine how FA varies as a function of BMI. For this, we identified all white matter voxels in the brain by thresholding the mean FA map to a value of more than 0.2. At each voxel within this mask, we performed an iterative sample-with-replacement permutation test (22). We chose to use this “bootstrapping” approach, instead of traditional asymptotic methods, to maximize our analytical sensitivity given the relatively small sample size. First, the voxel FA values were z-scored across participants. Next, we used an ordinary least squares regression model to remove any effects of age or sex. The residual FA values from this regression were then correlated against the group BMI scores using a nonparametric Spearman rank-order correlation (rS). To estimate the probability of observing a larger correlation by chance (i.e., P value), we repeated this process 500 times with the BMI and z-scored FA values randomly reassigned across participants. The gray dashed line distribution in Figure 2A shows the average bootstrap-generated chance distribution across all white matter voxels. A bias-corrected and accelerated bootstrap test was used to estimate statistical significance for each voxel (23).
Figure 2.

Global changes in white matter with body mass index (BMI) after controlling for age and sex. A, The distribution of voxel correlations between fractional anisotropy (FA) and BMI compared with the estimated chance distribution computed using permutation statistics (black dashed line). Significant negative (blue) and positive (red) correlations are highlighted (based on bootstrap p < .025). B, Distribution of voxels with significant negative correlations between BMI and FA when controlling for age and sex. Voxels were thresholded at r < −0.33, family-wise error adjusted p < .05. C, The distribution of voxel correlations between apparent diffusion coefficient (ADC) and BMI, after controlling for age and sex, as compared with the estimated chance distribution computed using permutation statistics (black dashed line). Same plotting conventions as Panel A. D, Distribution of voxels with significant positive correlations between BMI and FA when controlling for age and sex. Voxels were thresholded as in Panel B.
After the bootstrap correlation test, we identified clusters of voxels with significant correlations between FA and BMI. For this analysis, we first applied a threshold for all uncorrected significant voxels (rS < ±0.33, p < .025). Clusters of connected voxels within these maps were then automatically identified using edge-based connectivity criteria (24) in SPM8. Clusters with less than 20 connected voxels were discarded from subsequent analysis (i.e., k = 20). Within each remaining cluster, we identified significant voxels by adjusting the statistical threshold to account for multiple comparisons using a family-wise error correction (false discovery rate of 0.05 (25)). Voxels that survived this threshold are shown in Figures 2B and D.
After whole-brain cluster analysis, we then set out to identify the specific pathways where FA values correlated with BMI and to determine the underlying nature of the FA variations. To do this, we used an established atlas of a priori, anatomically defined white matter regions of interest (ROIs) (26). This atlas identifies 48 segments of core white matter pathways in both hemispheres. To simplify the analysis, we collapsed results across the hemispheres in bilateral pathways. A list of the final 27 ROIs is shown in Table 1.
TABLE 1.
Spearman Correlations Between Body Mass Index and Fractional Anisotropy in 27 A Priori Regions of Interest From a White Matter Atlas
| Region of Interest | Total No. Voxels | Negatively Correlated Voxels, % | Positively Correlated Voxels, % | Total Significant Voxels, % | Mean rS | 95% Confidence Interval |
|---|---|---|---|---|---|---|
| Pontine crossing tract | 183 | 32.2 | 1.1 | 33.3 | −0.33 | −0.35 to −0.31 |
| Corpus callosum (genu) | 1131 | 2.2 | 0.3 | 2.5 | −0.07 | −0.09 to −0.06 |
| Corpus callosum (body) | 1727 | 5.1 | 0.0 | 5.1 | −0.12 | −0.13 to −0.11 |
| Corpus callosum (splenium) | 1543 | 1.9 | 5.8 | 7.6 | 0.00 | −0.02 to 0.01 |
| Fornix (main) | 81 | 4.9 | 0.0 | 4.9 | −0.22 | −0.25 to −0.18 |
| Fornix (stria terminalis) | 284 | 1.1 | 2.1 | 3.2 | −0.10 | −0.13 to −0.08 |
| Corticospinal | 339 | 37.2 | 19.8 | 56.9 | −0.28 | −0.31 to −0.25 |
| Medial lemniscus | 169 | 45.6 | 19.5 | 65.1 | −0.31 | −0.35 to −0.27 |
| Inferior cerebellar peduncle | 208 | 16.3 | 43.3 | 59.6 | −0.18 | −0.22 to −0.14 |
| Middle cerebellar peduncle | 1898 | 26.0 | 46.0 | 72.0 | −0.18 | −0.19 to −0.16 |
| Superior cerebellar peduncle | 244 | 12.3 | 9.0 | 21.3 | −0.12 | −0.17 to −0.07 |
| Cerebral peduncle | 531 | 17.9 | 1.7 | 19.6 | −0.14 | −0.18 to −0.11 |
| Internal capsule (anterior limb) | 799 | 7.9 | 0.0 | 7.9 | −0.14 | −0.15 to −0.12 |
| Internal capsule (posterior limb) | 978 | 4.8 | 0.0 | 4.8 | −0.16 | −0.18 to −0.15 |
| Internal capsule (retrolenticular) | 627 | 1.0 | 0.2 | 1.1 | −0.06 | −0.08 to −0.04 |
| External capsule | 1421 | 1.9 | 0.5 | 2.4 | −0.08 | −0.09 to −0.07 |
| Corona radiata (anterior) | 1721 | 2.7 | 0.0 | 2.7 | −0.10 | −0.11 to −0.08 |
| Corona radiata (superior) | 1844 | 7.7 | 0.1 | 7.8 | −0.14 | −0.15 to −0.13 |
| Corona radiata (posterior) | 898 | 2.9 | 0.0 | 2.9 | −0.06 | −0.07 to −0.04 |
| Thalamic radiation (posterior) | 965 | 3.8 | 0.0 | 3.8 | −0.10 | −0.11 to −0.08 |
| Sagittal stratum | 574 | 0.0 | 1.0 | 1.0 | 0.02 | 0.00 to 0.04 |
| Cingulum (cingulate gyrus) | 631 | 0.2 | 1.3 | 1.4 | −0.02 | −0.04 to 0.00 |
| Cingulum (hippocampus) | 284 | 12.3 | 8.5 | 20.8 | −0.13 | −0.16 to −0.09 |
| Superior longitudinal fasciculus | 1640 | 4.4 | 0.2 | 4.6 | −0.09 | −0.10 to −0.08 |
| Superior fronto-occipital fasciculus | 114 | 19.3 | 0.0 | 19.3 | −0.27 | −0.31 to −0.24 |
| Uncinate fasciculus | 96 | 0.0 | 1.0 | 1.0 | 0.07 | 0.05 to 0.10 |
| Tapetum | 149 | 0.0 | 0.0 | 0.0 | 0.03 | 0.00 to 0.06 |
Our first pass analysis on the atlas-based ROIs used all voxels within each region mask. For this, we determined the percentage of voxels with either a significant negative or positive FA correlation with BMI (p < .025; one tailed, uncorrected), the mean correlation value, and the upper and lower bounds of a Bonferroni-corrected 95% confidence interval, determined as follows:
| (Eq.5) |
In Equation 5, μ is the mean correlation across voxels, σ is the variance, NROIs is the number of ROIs in the set (i.e., 27), Nvoxels is the number of voxels within the ROI mask, and α = 0.05. Because of the high variance in FA values, we used Grubb’s (27) test to identify outlier participants at each ROI who were excluded from the final analysis (maximum exclusion, 2 participants).
We then identified a subset of ROIs with more than 5% of voxels having a significant FA and BMI correlation (p < .025; one tailed, uncorrected). This threshold is twice the expectations of random chance, that is, 2.5%. Within each selected ROI mask, we determined the mean FA, ADC, λ||, and λ⊥ for all suprathreshold voxels and all participants. The correlation between FA and ADC was first estimated with a Spearman correlation coefficient. Next, the relationship between FA and the two component diffusion parameters (λ|| and λ⊥) was estimated using ordinary least squares regression model after controlling for age, sex, and ADC. In both cases, the adjusted 95% confidence interval of the correlation was determined as shown in Equation 5, with μ = rS, σ estimated from the bootstrap distribution, and NROIs = 12. These results are presented in Table 2.
TABLE 2.
Water Diffusion Component Relationships Estimated Using a Bootstrapped Regression Method for the Regions of Interest in Table 1 With More Than 5% of Voxels Having a Significant FA-BMI Relationship
| Region of Interest | No. Voxels | FA and ADC
|
FA and AD
|
FA and RD
|
|||
|---|---|---|---|---|---|---|---|
| rS | 95% Confidence Interval | β | 95% Confidence Interval | β | 95% Confidence Interval | ||
| Pontine crossing tract | 59 | −0.14 | −0.23 to −0.05 | 517 | 305 to 729 | −1584 | −2318 to −850 |
| Corpus callosum (body) | 88 | 0.01 | −0.04 to 0.07 | 1351 | 103 to 2598 | −2701 | −5196 to −206 |
| Corticospinal | 126 | −0.18 | −0.24 to −0.12 | 653 | 607 to 698 | −1334 | −1384 to −1285 |
| Medial lemniscus | 77 | −0.34 | −0.43 to −0.26 | 460 | 184 to 736 | −1052 | −1389 to −715 |
| Inferior cerebellar peduncle | 34 | −0.38 | −0.50 to −0.26 | 717 | 566 to 868 | −1483 | −1728 to −1238 |
| Middle cerebellar peduncle | 494 | −0.45 | −0.49 to −0.42 | 459 | 423 to 495 | −984 | −1036 to −932 |
| Superior cerebellar peduncle | 30 | −0.32 | −0.46 to −0.18 | 928 | 12 to 1844 | −1855 | −3687 to −23 |
| Cerebral peduncle | 95 | −0.72 | −0.80 to −0.63 | 402 | 246 to 558 | −752 | −1142 to −362 |
| Internal capsule (anterior limb) | 63 | 0.00 | −0.10 to 0.10 | 1857 | −505 to 4218 | −3779 | −8498 to 939 |
| Corona radiata (superior) | 142 | −0.11 | −0.16 to −0.06 | 1537 | 547 to 2528 | −3074 | −5055 to −1093 |
| Cingulum (hippocampus) | 35 | 0.08 | −0.22 to 0.05 | 801 | 157 to 1444 | −920 | −1597 to −244 |
| Superior fronto-occipital fasciculus | 22 | −0.25 | −0.45 to −0.06 | 2039 | −2082 to 6159 | −4077 | −12318 to 4164 |
FA = fractional anisotropy; ADC = apparent diffusion coefficient; AD = axial diffusivity; RD = radial diffusivity.
Means and 95% confidence intervals are displayed for Spearman correlations (rS) between FA and ADC. Ordinary least squares regression, controlling for ADC, was used to estimate the relationship between FA and both RD and AD in separate regression models. Parameter estimates (β) and 95% confidence intervals are reported.
RESULTS
BMI scores in our participant sample ranged from 19.6 to 45.7 kg/m2, with a mean (standard deviation) of 26.8 (6.5) kg/m2 (median = 24.3 kg/m2). Thus, our sample reflected a representative range of body sizes, covering the span of normal weight, overweight, and obese. To ensure that our sample was large enough to make valid statistical comparisons, we performed a power analysis based on the effect sizes reported in a recent study (see Table 1 in Mueller et al. (19)). Our analysis, assuming a bivariate normal distribution, showed that a sample of 19 to 27 participants was sufficient to reliably reject a null hypothesis with an α of 0.05. In this sample, we did not detect a significant correlation between age and BMI (rS = 0.24, p = .12), and there was no significant difference in BMI scores between men and women (independent sample t < 1, df = 26, p = .52).
A voxelwise nonparametric correlation analysis between FA and BMI, after controlling for age and sex, found that FA was negatively correlated with BMI across most (63.3%) white matter voxels in the brain (Fig. 2A). There was a clear distribution shift from the expectations of random chance (dashed black line in Fig. 2A). Correlations ranged from−0.73 to 0.74, with a mean (standard deviation) of −0.05 (0.18) and a median of −0.06.
Of the isolated clusters of voxels for which the correlations were statistically significant (p < .025; blue and red bars in Fig. 2A), most were negative (6.5% significant negative correlations versus 1.6% positive). Although at first, this number may seem small, it is important to put it into context. The number of significant voxels negatively correlated with BMI is well above the 2.5% expectations of chance (based on a one-tailed p = .025). Given the number of voxels tested (80,777), this means that 5250 voxels passed this stringent threshold, spanning 1050 mm3 of tissue.
After controlling for multiple comparisons, we identified several pathways with a significant negative relationship between FA and BMI (Fig. 2B). Subcortically, the middle and superior cerebellar peduncles showed strong BMI effects. Clusters were also present bilaterally in the medial lemniscus regions of the midbrain, in the infundibulum that connects the hypothalamus to the pituitary, along portions of the anterior limb of the internal capsule, and in perithalamic white matter. We found that several pathways containing cortical-cortical or cortical-subcortical projections were also negatively correlated with BMI, including regions of the cingulum, the semioval (i.e., corona radiata), and perihippocampal white matter in the temporal lobe.
The clusters shown in Figure 2B are labeled based on an approximate visual identification of gross anatomic landmarks. Based on an atlas of a priori defined anatomic ROIs (26), we found a consistent trend for stronger negative associations between BMI and FA (Table 1). In most cases, there were many more voxels with significant (p < .025, one tailed) negative correlations than positive. The percentage of voxels with significant negative correlations was well above chance expectations in 12 pathways (shown in Table 2). However, in all but four tracts, the mean correlation across voxels was negative, and the adjusted 95% confidence interval of the correlation value did not include 0. This suggests that, even in pathways with relatively few suprathreshold voxels, the trend across the entire white matter tract was for a consistently negative association with BMI.
So far, our analysis has demonstrated a consistent negative relationship between BMI and FA across white matter pathways in the brain. As mentioned previously, FA can decrease from either a decrease in λ|| or increase in λ⊥. Of course, these are not mutually exclusive possibilities, meaning that FA can also vary because of altered diffusivity in both planes. However, we first need to ascertain whether BMI is correlated with the magnitude of the diffusion signal itself (i.e., the energy of diffusion in the underlying voxels). To determine this, we used a similar whole-brain correlation analysis to look at how ADC correlated with changes in BMI. Similar to FA, we found that, in white matter voxels, the ADC was generally negatively correlated with BMI (Fig. 2C).
At first glance, this global correlation of BMI with overall energy in the diffusion signal may also seem to explain the relationship with FA. However, FA is a measure of shape, not overall diffusion magnitude, and changes in overall diffusion can occur symmetrically to all components that go into the FA calculation, resulting in little change to the actual FA value (Eq. 2). To get a quantitative estimate of the relationship between FA and ADC, we identified the voxels with significant negative BMI and FA correlations within the 12 fiber tracts with the strongest BMI effects. In 8 of 12 ROIs tested, we found a significant negative relationship between FA and ADC (Table 2). This suggests that the variation in the energy of the diffusion signal is not expressed symmetrically for all components of the FA equation.
To determine how much of the variance in the original FA and BMI correlation is explained by ADC effects, we used a nested regression analysis to measure how the FA-BMI relationship changes after accounting for ADC. For this analysis, we took the average FA values from voxels in the 12 ROIs shown in Table 2, which were negatively correlated with BMI (p < .025, one tailed). In one regression model, we correlated the influence of BMI, age, and sex on the average FA. We then compared coefficients from this to those from a model that also included ADC as a covariate. As expected, the regression coefficients for BMI on FA were negative in the first regression model without controlling for ADC across the 12 ROIs tested (−0.005 ± 0.0021 [standard error]). Including the ADC term in the second model reduced the magnitude of this BMI coefficient on an average of 8.06% (±12.18%) across all 12 ROIs to a value of −0.0036 (±0.0014). For comparison, we repeated the second controlled regression model except with the ADC term replaced with a random noise parameter with the same mean and variance as the ADC values at each ROI. With this random regressor, we observed a slight but not substantial drop in the BMI coefficient magnitude (−0.0048 ± 0.0021). Thus, accounting for ADC generally reduced the magnitude of the relationship between BMI and FA by 8%.
Because overall diffusivity decreased with increased BMI and this also has an influence on the overall FA-BMI relationship, we included ADC as a covariate in our analysis to determine whether our BMI association with FA reflected a change in λ|| or λ⊥ or both. Table 2 shows the results of this analysis for affected voxels in the 12 fiber pathways with the strongest negative BMI-FA effects. After controlling for ADC, we found that diffusivity in the axial direction was positively correlated with FA in all but two of the regions. In addition, we found that FA negatively correlated with diffusivity in the radial plane for the same 10 pathways. The only two fiber tracts that did not show this pattern were the anterior limb of the internal capsule and the superior fronto-occipital fasciculus. This suggests that, in most pathways, the BMI-related reduction in FA is associated with both a decrease in λ|| and an increase in λ⊥. We discuss this in more detail in the next section.
Although we were more than four times more likely to see a negative relationship between BMI and FA than a positive correlation, there were still several clusters with strong positive relationships (Fig. 2D; see also red section of the distribution in Fig. 2A). These clusters were also located primarily in subcortical and brainstem regions, particularly the middle cerebellar peduncle and the fiber pathways near the colliculus. In most cases, fiber tracts with a large number of significant positive correlations also had a substantial, if not greater, number of negatively correlated voxels (Table 1). Of the 27 ROIs tested, only the splenium of the corpus callosum did not share this collinear pattern. Therefore, in most regions where positive associations between BMI and FA were observed, this relationship might be explained by the inefficiency of the standard tensor model to resolve complex fiber crossings (28). We discuss this in more detail in the next section.
DISCUSSION
We have shown that, in a group of otherwise neurologically healthy adults, increased BMI is associated with a global decrease in the microstructural integrity of white matter pathways. Within the voxels correlated with BMI, we found evidence for a multifaceted association between obesity and white matter. Individuals with higher BMI exhibited a decrease in overall, directionally nonspecific water diffusivity, as assessed using the ADC. After accounting for this influence on overall diffusion signal, we found that the negative BMI correlations with FA were associated with two directionally-dependent changes in the diffusion signal. First, FA was positively correlated with decreases in diffusivity along the predominant fiber direction (i.e., λ||). Second, FA was negatively correlated with diffusivity in the orthogonal plane to the principal fiber direction (i.e., λ⊥). Taken together, our results suggest that obesity and axonal integrity may have a global, whole-brain relationship that is particularly strong in brainstem sensory and motor pathways. Because these effects seem to originate from altered diffusivity in the axial and radial planes, there may be multiple mechanisms by which increased BMI is associated with white matter.
These findings build on a growing body of literature on brain differences associated with increased BMI. Stanek and colleagues (16) recently used an ROI-based approach to show how the FA of voxels in the corpus callosum and fornix decreased with higher BMI. This was recently validated by a similar analysis on tract-based white matter segments, also focusing primarily on the corpus callosum, by Mueller and colleagues (19). In addition to the BMI-FA relationship, Mueller and colleagues (19) also found a specific relationship between decreased FA and λ||, along with an increase in λ⊥ in women but not in men. Additional support of our findings comes from Yau and colleagues (29), who recently reported decreased integrity of cerebral white matter in adolescents with Type 2 diabetes, an obesity-associated disease. In fact, obesity combined with Type 2 diabetes is associated with elevated rates of atrophy of multiple brain areas (10,11,15–17). More recently, adults having Type 2 diabetes have been shown to have less overall gray matter than healthy controls (30). Although we did not test for insulin resistance in the present study, it may be a possible mechanism for the changes in white matter integrity, which were observed.
Our work extends on these previous findings in several ways. First, we show how increased BMI is associated with a global decrease in white matter integrity throughout the brain. If BMI only related to isolated clusters or specific pathways, then the global distribution of correlations would be slightly skewed or contain heavy tails but with a mean overlapping the null distribution. Instead, we found that the distribution of correlations had a similar shape as what would be expected by chance (i.e., normally distributed), based on bootstrapping tests, but shifted in the negative direction. This global expression may also explain the heterogeneity in the location of significant negative clusters between research samples (compare our results to those reported by Stanek et al. (16) and Mueller et al. (19)). If the mechanisms by which obesity influences axonal structure were nonspecific, then different samples of participants would exhibit different patterns of significant clusters. Thus, adopting a whole-brain distribution approach such as that shown in Figures 2A and C may be the best way to compare findings across studies.
Second, we found a consistent association between BMI and FA in subcortical brainstem pathways that were not reported in these previous studies. The location and bilateral expression of many of these clusters validates that these are not simply the expression of random noise. Many of these pathways are linked to sensory and motor functions. For example, we found that both input (middle and inferior peduncle) and output (superior peduncle) pathways to the cerebellum correlate with BMI. If replicated, these findings would suggest that obese individuals might express errors in control and coordination of motor behaviors consistent with cerebellar dysfunction. We also found that the integrity of a major sensory input pathway to the primary somatosensory cortex, the medial lemniscus, was negatively associated with increasing BMI. This suggests that participants with high BMI may experience deficits in fine tactile sensation, including proprioception or vibrotactile experience (see Willis (31) for review of this system). Alternatively, these effects may simply reflect the consequences of an increased sedentary life-style in obese individuals (32) rather than the result of changes to physiological systems.
We also showed that increased BMI was associated with the energy in the overall diffusion signal itself. Indeed, approximately 8% of the variance in the BMI-FA relationship could be explained by a reduction in the energy of the diffusion signal. Variations in ADC could result from differences in body temperature or physiological noise in individuals with higher BMI or might reflect true changes to underlying axonal structure. ADC is, in fact, often used as a measure of white matter integrity itself, and it is highly correlated with mean diffusivity, calculated as the mean of the three eigenvectors used in the FA calculation (see Materials and Methods). Conceptually, the association between BMI and both FA and ADC suggests a multifaceted relationship where both the shape and magnitude of axonal integrity might decrease with increased obesity. Future studies using high angular resolution imaging approaches, combined with orientation diffusion function reconstructions, such as high angular resolution imaging and diffusion spectrum imaging (see Hagmann et al. (28) for review), might be able to dissociate these two effects on underlying white matter structure. More importantly, however, this finding suggests that any interpretation of DTI results in relation to obesity, which do not include a control for changes in the diffusion signal, may be biased or provide incomplete characterizations of neuroanatomic changes.
Our finding that BMI-linked variation in FA was positively correlated with λ|| and negatively correlated with λ⊥ is generally consistent with recent findings using a larger sample of participants (19). Although in this earlier study, only female participants demonstrated correlations with both changes in axial and radial diffusions, whereas obese male participants only exhibited changes in λ||. It is likely that our limited sample size precludes our ability to disentangle sex-related differences in these systems. Neuroanatomically, these different signals provide some indications as to the structure of the underlying white matter itself. Animal models of white matter degeneration have shown that decreased λ|| correlates with atrophy of axonal fibers (33–34), whereas increased λ⊥ corresponds to demyelination (35–36). This bimodal change in the shape of the diffusion signal suggests that there are likely multiple mechanisms contributing to the relationship between BMI and FA. However, this relationship between FA, λ||, and λ⊥ only holds in voxels containing uncrossed fiber tracts (e.g., corpus callosum, internal capsule (37)). The limited resolution of the diffusion tensor model at resolving fiber crossings means that these presumed relationships break down in regions with more complex fiber patterns (e.g., corona radiata, superior longitudinal fasciculus). Future work should take this into account when exploring the nature of white matter variations associated with increased obesity.
Obesity itself is associated with a range of general physiological changes, including increased inflammation; changes in glucose and insulin systems, which can result in Type 2 diabetes; and increases in cholesterol and hypertension (38–39). Therefore, it is possible that several of these physiological comorbidities with obesity may also mediate the association between BMI and white matter. For example, a small functional MRI study showed that obesity was associated with reductions in brain activity during the performance of a demanding working memory task and that the strongest predictor of reduced activation was not higher BMI but lower insulin sensitivity (18). In addition, inflammatory pathways have been implicated in white matter atrophy in both humans (40) and animal models (41) and also increase with obesity. Neuropsychological studies have suggested that some cognitive domains supported by these same brain areas are compromised in obesity (e.g., planning and mental flexibility, problem solving, memory, psychomotor speed (42–45)). Unfortunately, because those studies have inconsistently and incompletely measured both cognitive outcomes and physiological predictors, and often use small, nonrepresentative samples, it is not possible to draw strong conclusions about physiological-cognitive-neurological relationships. Only further studies, on larger sample sizes with physiological markers, can begin to address these mechanistic questions.
Of course, cardiovascular changes could also play a critical role in mediating the relationship between obesity and white matter. A recent study found that increased mean arterial blood pressure was associated with a reduction in white matter integrity, assessed using DTI, in the corpus callosumin a sample of African American adults (38). Cortically, increased blood pressure was also associated with a reduction in gray matter thickness in frontal, parietal, and temporal association cortices (46). These findings suggest that increased blood pressure might mediate obesity-related effects on white matter and neurocognitive performance. However, it should be pointed out that the previous studies associating blood pressure with brain morphology failed to include measures of body weight or obesity, so this relationship has not yet been directly tested. In addition, a more recent study found that variation in blood pressure did not significantly mediate the relationship between white matter changes and cognitive performance in a sample of healthy older adults (39). However, neuroanatomic measures of hypertension (reflected as white matter signal abnormalities) did mediate the relationship between white matter integrity and cognition. Despite this ambiguity on the role of cardiovascular integrity in neurocognitive relationships, these results suggest that future studies should include measures of cardiovascular integrity when exploring the mediating pathways linking obesity to neural morphology metrics.
One potential limitation of the present study is the small sample size used; however, we believe that this is not a significant limitation for several reasons. First, in statistical theory, sample size and effect size interact when determining the power of any statistical inference. In a previous study, Mueller and colleagues (19) reported correlations between BMI and FA in the corpus callosum, depending on group and location, which ranged from −0.779 to −0.673 (see Table 1 in Mueller et al. (19)). A power analysis on these effect sizes indicates that a sample size ranging from 19 to 27 participants is sufficient to adequately reject the null hypothesis. Therefore, our sample is not underpowered. Second, if the sample size was causing low power in our analysis, then the likelihood of a false positive would be equal to that of a false negative. Our distribution analysis clearly shows a symmetrical distribution but with a greater likelihood of negative correlations than positive (Fig. 2A). This suggests that the within-sample noise was small enough to allow for any underlying effects to be visible. Third, as mentioned previously, our findings are similar to recent reports in restricted ROIs (16,19), further validating our observed effects. Finally, the use of both nonparametric and permutation statistics reduces the influence of outliers on the final outcome. The conservative nature of these tests reduces the possibility of Type I errors. Nonetheless, studies with larger sample sizes are necessary before making conclusive arguments about the impact of BMI on brain health.
Another major limitation is that we cannot determine whether the white matter correlations with BMI are associated with body weight changes or due to secondary disorders linked to obesity. For example, as mentioned previously, obesity is associated with increase prevalence of Type 2 diabetes (see Kahn et al. (47)). It is possible that increased insulin resistance in our overweight and obese participants may be the fundamental molecular mechanism that mediates changes in white matter structure. Unfortunately, this experiment represents a pilot study that was intended to define the scope of future research. Therefore, ancillary measures of obesity such as waist circumference or the hip-to-waist ratio and measures underlying physiological systems such as inflammatory markers, cholesterol levels, or insulin and glucose levels were not collected in this sample. Future studies should collect more information of both physical health and physiological systems to isolate the root mechanisms underlying the relationship between obesity and white matter.
However, BMI can serve as a useful “umbrella” measure that encompasses this broader range of underlying mechanisms for both scientific and public health purposes. If a direct relationship between BMI and white matter structure is confirmed, then intervention studies should be conducted to determine whether reducing BMI within an individual improves the integrity of white matter. Recently, exercise interventions have been shown to attenuate age-related declines in both cognitive function (48) and brain volume (49–51). Perhaps similar interventions would show promise in attenuating the effect of BMI in similar cognitive and neural systems.
So far, we have worked under the presumption that certain underlying systems linked to obesity drive changes in white matter pathways. However, because our analysis is strictly correlational in nature, it does not explicitly preclude other possible explanations for this relationship. One possibility is that an unknown third variable is concurrently driving both changes in white matter and obesity, such as a genetic condition that both decreases white matter and makes individuals more susceptible to obesity. Another possibility is that individual differences in baseline white matter integrity may influence behavioral patterns and, in turn, increase obesity. For example, persons with innately lower white matter integrity, for example in inhibitory control pathways, may be more likely to exhibit hedonic overeating. Given the observations that exercise interventions can preserve other brain morphology measures (50), we believe that this inherent differences hypothesis is highly unlikely. However, it is possible that changes in white matter may subsequently lead to further increased BMI, resulting in a positive-feedback loop between white matter and obesity. Only targeted intervention studies can determine if such cycles occur.
Nonetheless, our findings provide several important contributions to the existing literature. We independently validate the relationship between BMI and white matter integrity reported in two recently published studies (16,19). We also extend these findings by showing that the association of BMI with white matter integrity is a globally distributed phenomenon and not limited to a select group of major white matter pathways such as the corpus callosum. We show that individuals with high BMI have an overall weaker diffusion signal and this accounts for part of the relationship between BMI and FA. Finally, we demonstrate that, after accounting for this signal difference, BMI-related FA changes are linked to changes in both the axial and radial diffusion directions. The degree and scope of BMI-related white matter changes and its distributed influence throughout the brain should be of concern to both clinical and basic science researchers alike.
Acknowledgments
T.D.V. and W.W.S. were supported by a Defense Advanced Research Projects Agency contract (NBCHC070104). K.I.E. was supported by a Junior Scholar Award from the Pittsburgh Claude D. Pepper Older Americans Independence Center (P30 AG024827) and the University of Pittsburgh Alzheimer’s Disease Research Center (P50 AG005133). A.M.W. was supported by Award Number T32GM081760 from the National Institute of General Medical Sciences. The content is solely the responsibility of the authors and does not necessarily represent the official views of the Defense Advanced Research Projects Agency, the National Institute of General Medical Sciences, or the National Institutes of Health.
Glossary
- DTI
diffusion tensor imaging
- FA
fractional anisotropy
- ADC
apparent diffusion coefficient
- λ||
axial diffusivity
- λ⊥
radial diffusivity
- BMI
body mass index
- MRI
magnetic resonance imaging
- ROI
region of interest
Footnotes
None of the authors report any conflicts of interest.
References
- 1.Odgen CL, Carroll MD. Prevalence of Overweight, Obesity, and Extreme Obesity Among Adults: United States, Trends 1976–1980 Through 2007–2008. Hyattsville, MD: Centers for Disease Control and Prevention; 2010. [Google Scholar]
- 2.Nederkoorn C, Braet C, Van Eijs Y, Tanghe A, Jansen A. Why obese children cannot resist food: the role of impulsivity. Eat Behav. 2006;7:315–22. doi: 10.1016/j.eatbeh.2005.11.005. [DOI] [PubMed] [Google Scholar]
- 3.Brogan A, Hevey D, Pignatti R. Anorexia, bulimia, and obesity: shared decision making deficits on the Iowa Gambling Task (IGT) J Int Neuropsychol Soc. 2010;16:711–5. doi: 10.1017/S1355617710000354. [DOI] [PubMed] [Google Scholar]
- 4.Weller RE, Cook EW, 3rd, Avsar KB, Cox JE. Obese women show greater delay discounting than healthy-weight women. Appetite. 2008;51:563–9. doi: 10.1016/j.appet.2008.04.010. [DOI] [PubMed] [Google Scholar]
- 5.Elias MF, Elias PK, Sullivan LM, Wolf PA, D’Agostino RB. Lower cognitive function in the presence of obesity and hypertension: the Framingham heart study. Int J Obes Relat Metab Disord. 2003;27:260–8. doi: 10.1038/sj.ijo.802225. [DOI] [PubMed] [Google Scholar]
- 6.Brogan A, Hevey D, O’Callaghan G, Yoder R, O’Shea D. Impaired decision making among morbidly obese adults. J Psychosom Res. 2011;70:189–96. doi: 10.1016/j.jpsychores.2010.07.012. [DOI] [PubMed] [Google Scholar]
- 7.Hillman CH, Erickson K, Kramer AF. Be smart, exercise your heart: exercise effects on brain and cognition. Nat Rev Neurosci. 2008;9:58–65. doi: 10.1038/nrn2298. [DOI] [PubMed] [Google Scholar]
- 8.Gunstad J, Paul RH, Cohen RA, Tate DF, Spitznagel MB, Gordon E. Elevated body mass index is associated with executive dysfunction in otherwise healthy adults. Compr Psychiatry. 2007;48:57–61. doi: 10.1016/j.comppsych.2006.05.001. [DOI] [PubMed] [Google Scholar]
- 9.Batterink L, Yokum S, Stice E. Body mass correlates inversely with inhibitory control in response to food among adolescent girls: an fMRI study. Neuroimage. 2010;52:1696–703. doi: 10.1016/j.neuroimage.2010.05.059. [DOI] [PMC free article] [PubMed] [Google Scholar]
- 10.Gunstad J, Paul RH, Cohen RA, Tate DF, Spitznagel MB, Grieve S, Gordon E. Relationship between body mass index and brain volume in healthy adults. Int J Neuroscience. 2008;118:1582–93. doi: 10.1080/00207450701392282. [DOI] [PubMed] [Google Scholar]
- 11.Pannacciulli N, Del Parigi A, Chen K, Le DS, Reiman EM, Tataranni PA. Brain abnormalities in human obesity: a voxel-based morphometric study. Neuroimage. 2006;31:1419–25. doi: 10.1016/j.neuroimage.2006.01.047. [DOI] [PubMed] [Google Scholar]
- 12.Stice E, Spoor S, Bohon C, Veldhuizen MG, Small DM. Relation of reward from food intake and anticipated food intake to obesity: a functional magnetic resonance imaging study. J Abnorm Psychol. 2008;117:924–35. doi: 10.1037/a0013600. [DOI] [PMC free article] [PubMed] [Google Scholar]
- 13.Stice E, Spoor S, Bohon C, Small DM. Relation between obesity and blunted striatal response to food is moderated by TaqIA A1 allele. Science. 2008;322:449–52. doi: 10.1126/science.1161550. [DOI] [PMC free article] [PubMed] [Google Scholar]
- 14.Stoeckel LE, Weller RE, Cook EW, 3rd, Twieg DB, Knowlton RC, Cox JE. Widespread reward-system activation in obese women in response to pictures of high-calorie foods. Neuroimage. 2008;41:636–47. doi: 10.1016/j.neuroimage.2008.02.031. [DOI] [PubMed] [Google Scholar]
- 15.Raji CA, Ho AJ, Parikshak NN, Becker JT, Lopez OL, Kuller LH, Hua X, Leow AD, Toga AW, Thompson PM. Brain structure and obesity. Hum Brain Mapp. 2010;31:353–64. doi: 10.1002/hbm.20870. [DOI] [PMC free article] [PubMed] [Google Scholar]
- 16.Stanek KM, Grieve SM, Brickman AM, Korgaonkar MS, Paul RH, Cohen RA, Gunstad JJ. Obesity is associated with reduced white matter integrity in otherwise healthy adults. Obesity (Silver Spring) 2011;19:500–4. doi: 10.1038/oby.2010.312. [DOI] [PubMed] [Google Scholar]
- 17.Taki Y, Kinomura S, Sato K, Inoue K, Goto R, Okada K, Uchida S, Kawashima R, Fukuda H. Relationship between body mass index and gray matter volume in 1,428 healthy individuals. Obesity (Silver Spring) 2008;16:119–24. doi: 10.1038/oby.2007.4. [DOI] [PubMed] [Google Scholar]
- 18.Gonzales MM, Tarumi T, Miles SC, Tanaka H, Shah F, Haley AP. Insulin sensitivity as a mediator of the relationship between BMI and working memory-related brain activation. Obesity (Silver Spring) 2010;18:2131–7. doi: 10.1038/oby.2010.183. [DOI] [PubMed] [Google Scholar]
- 19.Mueller K, Anwander A, Möller HE, Horstmann A, Lepsien J, Busse F, Mohammadi S, Schroeter ML, Stumvoll M, Villringer A, Pleger B. Sex-dependent influences of obesity on cerebral white matter investigated by diffusion-tensor imaging. PLoS One. 2011;6:e18544. doi: 10.1371/journal.pone.0018544. [DOI] [PMC free article] [PubMed] [Google Scholar]
- 20.Jones DK, Cercignani M. Twenty-five pitfalls in the analysis of diffusion MRI data. NMR Biomed. 2010;23:803–20. doi: 10.1002/nbm.1543. [DOI] [PubMed] [Google Scholar]
- 21.Smith S, Jenkinson M, Johansen-Berg H, Rueckert D, Nichols T, Mackay C, Watkins K, Ciccarelli O, Cader M, Matthews P, Behrens T. Tract-based spatial statistics: voxelwise analysis of multi-subject diffusion data. Neuroimage. 2006;31:1487–505. doi: 10.1016/j.neuroimage.2006.02.024. [DOI] [PubMed] [Google Scholar]
- 22.Manly B. Randomization, Bootstrap and Monte Carlo Methods in Biology. 2. New York, NY: Chapman and Hall; 1997. [Google Scholar]
- 23.DiCiccio T, Efron B. Bootstrap confidence intervals. Stat Sci. 1996;11:189–228. [Google Scholar]
- 24.Thurfjell L, Bengtsson E, Nordin B. A new three-dimensional connected components labeling algorithm with simultaneous object feature extraction capability. CVGIP-Graph Model Image Process. 1992;54:357–64. [Google Scholar]
- 25.Genovese R, Lazar NA, Nichols TE. Thresholding of statistical maps in functional neuroimaging using the false discovery rate. Neuroimage. 2002;15:870–8. doi: 10.1006/nimg.2001.1037. [DOI] [PubMed] [Google Scholar]
- 26.Mori S, Wakana S, Van Zijl PCM. MRI Atlas of Human White Matter. 1. Elsevier; 2005. [Google Scholar]
- 27.Grubbs F. Sample criteria for testing outlying observations. Ann Math Stat. 1950;21:27–58. [Google Scholar]
- 28.Hagmann P, Jonasson L, Maeder P, Thiran JP, Wedeen VJ, Meuli R. Understanding diffusion MR imaging techniques: from scalar diffusion-weighted imaging to diffusion tensor imaging and beyond. Radiographics. 2006;26(suppl 1):S205–23. doi: 10.1148/rg.26si065510. [DOI] [PubMed] [Google Scholar]
- 29.Yau PL, Javier DC, Ryan CM, Tsui WH, Ardekani BA, Ten S, Convit A. Preliminary evidence for brain complications in obese adolescents with Type 2 diabetes mellitus. Diabetologia. 2010;53:2298–306. doi: 10.1007/s00125-010-1857-y. [DOI] [PMC free article] [PubMed] [Google Scholar]
- 30.Kumar A, Haroon E, Darwin C, Pham D, Ajilore O, Rodriguez G, Mintz J. Gray matter prefrontal changes in Type 2 diabetes detected using MRI. J Magn Reson Imaging. 2008;27:14–9. doi: 10.1002/jmri.21224. [DOI] [PubMed] [Google Scholar]
- 31.Willis WD. The somatosensory system, with emphasis on structures important for pain. Brain Res Rev. 2007;55:297–313. doi: 10.1016/j.brainresrev.2007.05.010. [DOI] [PubMed] [Google Scholar]
- 32.Bonomi AG, Westerterp KR. Advances in physical activity monitoring and lifestyle interventions in obesity: a review. Int J Obes (Lond) doi: 10.1038/ijo.2011.99. In press. [DOI] [PubMed] [Google Scholar]
- 33.Budde MD, Kim JH, Liang HF, Russell JH, Cross AH, Song SK. Axonal injury detected by in vivo diffusion tensor imaging correlates with neurological disability in a mouse model of multiple sclerosis. NMR Biomed. 2008;21:589–97. doi: 10.1002/nbm.1229. [DOI] [PMC free article] [PubMed] [Google Scholar]
- 34.Budde MD, Xie M, Cross AH, Song SK. Axial diffusivity is the primary correlate of axonal injury in the experimental autoimmune encephalomyelitis spinal cord: a quantitative pixelwise analysis. J Neurosci. 2009;29:2805–13. doi: 10.1523/JNEUROSCI.4605-08.2009. [DOI] [PMC free article] [PubMed] [Google Scholar]
- 35.Song SK, Yoshino J, Le TQ, Lin SJ, Sun SW, Cross AH, Armstrong RC. Demyelination increases radial diffusivity in corpus callosum of mouse brain. Neuroimage. 2005;26:132–40. doi: 10.1016/j.neuroimage.2005.01.028. [DOI] [PubMed] [Google Scholar]
- 36.Klawiter EC, Schmidt RE, Trinkaus K, Liang HF, Budde MD, Naismith RT, Song SK, Cross AH, Benzinger TL. Radial diffusivity predicts demyelination in ex vivo multiple sclerosis spinal cords. Neuroimage. 2011;55:1454–60. doi: 10.1016/j.neuroimage.2011.01.007. [DOI] [PMC free article] [PubMed] [Google Scholar]
- 37.Wheeler-Kingshott CA, Cercignani M. About “axial” and “radial” diffusivities. Magn Reson Med. 2009;61:1255–60. doi: 10.1002/mrm.21965. [DOI] [PubMed] [Google Scholar]
- 38.Leritz EC, Salat DH, Milberg WP, Williams VJ, Chapman CE, Grande LJ, Rudolph JL, Schnyer DM, Barber CE, Lipsitz LA, McGlinchey RE. Variation in blood pressure is associated with white matter microstructure but not cognition in African Americans. Neuropsychology. 2010;24:199–208. doi: 10.1037/a0018108. [DOI] [PMC free article] [PubMed] [Google Scholar]
- 39.Jacobs HI, Leritz EC, Williams VJ, Van Boxtel MP, Elst WV, Jolles J, Verhey FR, McGlinchey RE, Milberg WP, Salat DH. Association between white matter microstructure, executive functions, and processing speed in older adults: the impact of vascular health. Hum Brain Mapp. doi: 10.1002/hbm.21412. In press. [DOI] [PMC free article] [PubMed] [Google Scholar]
- 40.Miralbell J, Soriano JJ, Spulber G, López-Cancio E, Arenillas JF, Bargalló N, GalánA Barrios MT, Cáceres C, Alzamora MT, Pera G, Kivipelto M, Wahlund LO, Dávalos A, Mataró M. Structural brain changes and cognition in relation to markers of vascular dysfunction. Neurobiol Aging. 2012;33:1003.e9, 17. doi: 10.1016/j.neurobiolaging.2011.09.020. [DOI] [PubMed] [Google Scholar]
- 41.Mueggler T, Pohl H, Baltes C, Riethmacher D, Suter U, Rudin M. MRI signature in a novel mouse model of genetically induced adult oligodendrocyte cell death. Neuroimage. 2012;59:1028–36. doi: 10.1016/j.neuroimage.2011.09.001. [DOI] [PubMed] [Google Scholar]
- 42.Waldstein SR, Katzel LI. Interactive relations of central versus total obesity and blood pressure to cognitive function. Int J Obes (Lond) 2006;30:201–7. doi: 10.1038/sj.ijo.0803114. [DOI] [PubMed] [Google Scholar]
- 43.Boeka AG, Lokken KL. Neuropsychological performance of a clinical sample of extremely obese individuals. Arch Clin Neuropsychol. 2008;23:467–74. doi: 10.1016/j.acn.2008.03.003. [DOI] [PubMed] [Google Scholar]
- 44.Fergenbaum JH, Bruce S, Lou W, Hanley AJ, Greenwood C, Young TK. Obesity and lowered cognitive performance in a Canadian First Nations population. Obesity (Silver Spring) 2009;17:1957–63. doi: 10.1038/oby.2009.161. [DOI] [PubMed] [Google Scholar]
- 45.Gunstad J, Lhotsky A, Wendell CR, Ferrucci L, Zonderman AB. Longitudinal examination of obesity and cognitive function: results from the Baltimore Longitudinal Study of Aging. Neuroepidemiology. 2010;34:222–9. doi: 10.1159/000297742. [DOI] [PMC free article] [PubMed] [Google Scholar]
- 46.Leritz EC, Salat DH, Williams VJ, Schnyer DM, Rudolph JL, Lipsitz L, Fischl B, McGlinchey RE, Milberg WP. Thickness of the human cerebral cortex is associated with metrics of cerebrovascular health in a normative sample of community dwelling older adults. Neuroimage. 2011;54:2659–71. doi: 10.1016/j.neuroimage.2010.10.050. [DOI] [PMC free article] [PubMed] [Google Scholar]
- 47.Kahn SE, Hull RL, Utzschneider KM. Mechanisms linking obesity to insulin resistance and Type 2 diabetes. Nature. 2006;444:840–6. doi: 10.1038/nature05482. [DOI] [PubMed] [Google Scholar]
- 48.Smith PJ, Blumenthal JA, Hoffman BM, Cooper H, Strauman TA, Welsh-Bohmer K, Browndyke JN, Sherwood A. Aerobic exercise and neurocognitive performance: a meta-analytic review of randomized controlled trials. Psychosom Med. 2010;72:239–52. doi: 10.1097/PSY.0b013e3181d14633. [DOI] [PMC free article] [PubMed] [Google Scholar]
- 49.Colcombe SJ, Erickson KI, Scalf PE, Kim JS, Prakash R, McAuley E, Elavsky S, Marquez DX, Hu L, Kramer AF. Aerobic exercise training increases brain volume in aging humans. J Gerontol A Biol Sci Med Sci. 2006;61:1166–70. doi: 10.1093/gerona/61.11.1166. [DOI] [PubMed] [Google Scholar]
- 50.Erickson KI, Voss MW, Prakash RS, Basak C, Szabo A, Chaddock L, Kim JS, Heo S, Alves H, White SM, Wojcicki TR, Mailey E, Vieira VJ, Martin SA, Pence BD, Woods JA, McAuley E, Kramer AF. Exercise training increases size of hippocampus and improves memory. Proc Natl Acad Sci U S A. 2011;108:3017–22. doi: 10.1073/pnas.1015950108. [DOI] [PMC free article] [PubMed] [Google Scholar]
- 51.Erickson KI, Prakash RS, Voss MW, Chaddock L, Hu L, Morris KS, White SM, Wójcicki TR, McAuley E, Kramer AF. Aerobic fitness is associated with hippocampal volume in elderly humans. Hippocampus. 2009;19:1030–9. doi: 10.1002/hipo.20547. [DOI] [PMC free article] [PubMed] [Google Scholar]