Abstract
Objectives: To evaluate brain activation using functional magnetic resonance imaging (fMRI) and specifically, activation changes across time associated with practice‐related cognitive control during eye movement tasks. Experimental design: Participants were engaged in antisaccade performance (generating a glance away from a cue) while fMR images were acquired during two separate test sessions: (1) at pre‐test before any exposure to the task and (2) at post‐test, after 1 week of daily practice on antisaccades, prosaccades (glancing toward a target), or fixation (maintaining gaze on a target). Principal observations: The three practice groups were compared across the two test sessions, and analyses were conducted via the application of a model‐free clustering technique based on wavelet analysis. This series of procedures was developed to avoid analysis problems inherent in fMRI data and was composed of several steps: detrending, data aggregation, wavelet transform and thresholding, no trend test, principal component analysis (PCA), and K‐means clustering. The main clustering algorithm was built in the wavelet domain to account for temporal correlation. We applied a no trend test based on wavelets to significantly reduce the high dimension of the data. We clustered the thresholded wavelet coefficients of the remaining voxels using PCA K‐means clustering. Conclusion: Over the series of analyses, we found that the antisaccade practice group was the only group to show decreased activation from pre‐test to post‐test in saccadic circuitry, particularly evident in supplementary eye field, frontal eye fields, superior parietal lobe, and cuneus. Hum Brain Mapp 34:2276–2291, 2012. © 2012 Wiley Periodicals, Inc.
Keywords: antisaccades, bootstrap, clustering, fMRI, plasticity, principal component analysis, saccades, wavelets
INTRODUCTION
Cognitive control mediates the process through which tasks transition from new or unfamiliar to learned or skilled. With practice, a task becomes less effortful, resulting in improved performance and a reduced need for cognitive control [e.g., Chein and Schneider, 2005; Jansma et al., 2001; Schneider and Chein, 2003; Schneider and Shiffrin, 1977]. Modifications in the neural circuitry supporting task performance also occur following practice [e.g., see Chein and Schneider, 2005; Kelly and Garavan, 2005 for reviews]. These changes in brain activation likely include changes in the specific neural circuitry supporting the response of interest as well as general changes reflecting a decreased need for cognitive control.
In this study, changes in brain activation across time were examined before and after daily exposure to a set of eye movement tasks. Among eye movements, saccades rapidly redirect gaze to a location of interest. “Prosaccades” are more reflexive, as a person simply redirects gaze to a newly appearing visual stimulus. “Antisaccades” are more complex and volitional, as a person redirects gaze to the mirror image location (same amplitude, opposite side) of a newly appearing peripheral visual cue. As such, a correct antisaccade response requires the inhibition of a glance toward the cue and generation of a voluntary saccade to an unmarked location in the opposite visual field.
Saccadic performance is supported by a network of subcortical and cortical regions, as identified via neuroimaging and other techniques [Camchong et al., 2008; Dyckman et al., 2007; Ford et al., 2005; Keedy et al., 2006; McDowell et al., 2008; Muri et al., 1998; O'Driscoll et al., 1995; Paus, 1996; Raemaekers et al., 2002, Sweeney et al., 2007]. Although the basic circuitry is the same for prosaccades and antisaccades, the increased complexity of antisaccades is supported by increased activation of existing circuitry and/or the recruitment of additional neural regions into the circuitry. As such, the saccade circuitry provides a specific, well‐studied system for understanding changes in brain activation associated with cognitive control and practice.
This study used functional magnetic resonance imaging (fMRI) to evaluate the changes across time in neural system activation after participants practiced either specific or nonspecific eye movement tasks. Participants were engaged in antisaccade performance during fMR image acquisition at two test sessions: (1) at pre‐test before any exposure to the task and (2) at post‐test after 1 week of daily practice on eye movement tasks. Each participant practiced a single type of eye movement only: (a) antisaccades, (b) prosaccades, or (c) fixation (maintaining gaze on a target). It was hypothesized that participants who had task‐consistent practice (i.e., the antisaccade practice group) would show changes in neural circuitry (as measured by the blood oxygenation level‐dependent (BOLD) signal) not observed in the two task‐inconsistent practice groups (the prosaccade and fixation groups) who practiced eye movement control tasks generally, but not antisaccades specifically. It was further hypothesized that (i) for saccade tasks, saccade‐related circuitry would show decreased BOLD signal over time as a result of the circuitry becoming more efficient and (ii) in the antisaccade practice group only, prefrontal cortex (PFC), frontal eye fields (FEFs), and striatum would show decreased BOLD signal due to decreased need for higher level cognitive control [Camchong et al., 2008, Munoz and Everling, 2004, Raemaekers et al., 2002].
The comparison of practice groups across test sessions was conducted using a combination of statistical techniques that were selected specifically to circumvent commonly acknowledged methodological problems that are associated with the structure of the data generated via fMRI and/or the model‐based general linear model (GLM) analyses as they are typically applied. Features of fMRI data that present difficulties for analysis include the accurate modeling of the BOLD response, massive‐sized data that are ill‐balanced, and the influence of spatial and temporal correlations in the data. These statistical challenges have been addressed in the past using a variety of methods that fall into two broad categories: model‐based and model‐free analyses.
A typical model‐based analysis is to build activation maps by testing each voxel separately using a statistical model (e.g., a general linear model). Under the specified model, a P‐value is calculated and used to determine whether the corresponding voxel is activated [see, e.g., Worsley and Friston, 1995 for early work in this direction]. The flexibility of the linear model allows for easy incorporation of temporal correlation via specification of an appropriate error structure. However, this approach (including the standard GLM‐type analysis) may not be optimal. It is prone to the multiple testing problem as inference is performed at the voxel level [Forman et al., 1995; Genovese et al., 2002; Worsley, 2003]. The number of true signals (active voxels) is typically small compared with the number tested, which exacerbates the detection issue. Furthermore, model misspecification, especially of the dependence structure of the fMRI time series, is a potentially serious issue. If the error structure is incorrect, estimated standard errors are also incorrect and inference will be severely impacted.
As an alternative, wavelet approaches have been applied to build brain activation maps. Şendur et al. [ 2005] pointed out that the wavelet transform increases the signal‐to‐noise ratio (SNR) and substantially decreases the serial correlation in the data. Van De Ville and Unser [ 2008] constructed a statistical parametric map by applying wavelets to both time and space domains and adapted the false discovery rate [FDR; Benjamini and Hochberg, 1995] method to address the multiple testing problem. By contrast, a standard model‐free approach such as clustering [e.g., Balslev et al., 2002; Fadili et al., 2000; Goutte et al, 1999; Windischberger et al., 2003] groups together voxels with similar activation profiles without assuming any particular model or functional form in advance. There have been fewer attempts in model‐free clustering, however, that account for the temporal correlation inherent in these data. One example is Ye et al. [ 2009], who took a geostatistical approach and clustered fMRI time series by comparing their correlation structures. Finally, compromises between a massively univariate model‐based analysis and model‐free clustering are possible. Heller et al. [ 2006], for instance, proposed a cluster‐based thresholding approach, which creates groups of contiguous voxels and tests at the cluster, rather than at the individual, level.
The large number of task‐irrelevant voxels poses challenges for both categories of analysis. In the model‐based approaches, the multiplicity problem is greatly exacerbated by the presence of these voxels. Hence, an increasingly common first step is to estimate the number of “true nulls” (see Benjamini and Hochberg, 2000; Turkheimer et al., 2001 for early work in this area; much research on this problem has been carried out in both neuroimaging and genetics contexts) and test only those voxels that are retained after that initial screening. For clustering methods, so‐called “ill‐balanced data”, wherein one class is much more prevalent than the others, are problematic, because many techniques will tend in this situation to cluster all cases into the dominant class. It is, therefore, a common practice before clustering to reduce the data size and to solve the ill‐balanced data problem. For instance, Fadili et al. [ 2000] used a priori anatomical information and reduced the number of voxels by testing the temporal autocorrelation in each voxel's time series and considering the spatial distribution of the activated regions. Balslev et al. [ 2002] used an F test to discard voxels with no overall effect.
Our approach to treating these issues was based on the application of clustering routines used in correspondence with wavelet analysis. Transforming to the wavelet domain accounts for the temporal correlation in the voxel time series. We also used a wavelet‐based test to detect task‐irrelevant voxels, thereby mitigating the ill‐balanced nature of the data. Our analysis was composed of several notable steps, including detrending, data aggregation, decorrelation, no trend test [Park et al., 2011], principal component analysis [PCA, Jolliffe, 2002], and K‐means clustering [Hartigan and Wong, 1979]. We performed an analysis of variance (ANOVA) test to evaluate the main effects of group and time as well as their interaction. Furthermore, using regions of interest (ROIs) we identified regions that showed statistical differences between the groups and test sessions based on the bootstrap method.
Importantly, the strategies presented above eliminated the need to create an a priori model of the “expected” activation across time, reduced the massive, ill‐balanced data set, and accounted for temporal autocorrelations. As such, the differences between practice groups across time were tested in a rigorous manner. These analyses enhanced our ability to evaluate practice‐related brain activity changes across time.
METHODS
Participants
Data were collected from 37 right‐handed undergraduate women (mean age = 19.5 years and standard deviation (SD) = 1.8) recruited from the Undergraduate Research Pool at the University of Georgia (UGA) or via flyers posted on campus. All participants were free (by self‐report) of psychiatric illness, history of head injury, and drug and alcohol abuse. Participants provided written informed consent before the study, which was approved by the UGA Institutional Review Board.
Procedure
fMRI data during antisaccade task performance were acquired at two test sessions: (1) pre‐test (before any task exposure) and (2) post‐test. Between pre‐test and post‐test fMRI sessions, participants practiced one type of randomly assigned eye movement daily for 1 week: (1) antisaccades (glances away from a cue, N = 12), (2) prosaccades (glances toward a cue, N = 14), or (3) fixation (maintains gaze at a central target, N = 11). All participants completed both test sessions.
fMRI test sessions
fMRI data were collected using a 1.5 T GE Signal Horizon LX Scanner (GE Medical Systems, Waukesha, WI). Task instructions were given before entering the scan room. Once in the room, a participant was positioned on a gurney with her head stabilized with foam padding and a restraint strap across her forehead. A mirror placed over the participant's head allowed her to view the stimuli on a rear‐projection screen placed near her feet. Eye movements were recorded using an fMRI compatible iView X System (SensoMotoric Instrument; 60‐Hz sampling rate) eye tracking system.
Two localizer images were taken at the beginning of the session to ensure optimal brain coverage for each participant. A high‐resolution image was then obtained (spoiled gradient recalled (SPGR) protocol: sagittal, 2 number of excitations (NEX) 0.9375 × 0.9375 × 1.5 mm3, 124 slices, echo time (TE) = 2.8 ms, repetition time (TR) = 10.8 ms, flip angle = 20°, and scan time = 5 min 41 s). After this structural image was acquired, functional imaging was conducted (spiral scan with two interleaves, 24 continuous axial slices, 3.75 × 3.75 × 4 mm3, TE = 40 ms, TR = 1,912 ms, flip angle = 77°, and scan time = 5 min 1 s).
The functional run consisted of 13 blocks (22.4 s each) alternating between fixation and antisaccade trials. Stimuli consisted of 1° circles filled with different colors. A fixation block was indicated by a purple stimulus at the central location, and participants were instructed to fixate on the target for the duration of the block. An antisaccade block consisted of seven individual trials, each of which started with a blue stimulus at the central location (2,000 ms). The stimulus was extinguished and 200 ms later a cue was presented 5° to the left or the right (half in each visual field) on the horizontal axis (1,000 ms). Participants were instructed to look at the blue stimulus only when it was in the middle of the screen, and when it was presented in the periphery, to look to the mirror image of that stimulus (opposite direction, same amplitude) as quickly and accurately as possible.
Behavioral practice sessions
After the fMRI pre‐test, each participant practiced her assigned task (antisaccade, prosaccade, or fixation) in the laboratory each of 4 days (weekends were excluded). Practice sessions were conducted using a hand‐held device with an LCD screen known as “Fix‐Train” that was designed for the purpose of providing practice with eye movement tasks [see Fischer et al., 2000]. For each task, the goal of the participant was to determine the orientation of a “T” symbol and to press the corresponding arrow key. The bottom leg of the “T” symbol could be facing up, down, left, or right. This manual task served as a proxy for measuring eye movements because the location and duration of the “T” presentation were designed so that the participant must execute the correct eye movement to see the stimulus and discern its orientation.
For fixation training, the symbol remained in the center of the screen and changed direction two to five times before disappearing. Subjects pressed the arrow key corresponding to the final orientation of the symbol before it disappeared from the screen. For prosaccade training, the task was identical except that the symbol jumped to one side after changing orientation in the middle, and participants pressed the arrow key corresponding to the orientation of the symbol once it jumped to the periphery. For antisaccade training, a star appeared in the center of the screen to provide a fixation target. Then, the star jumped to one side of the screen and the “T” symbol appeared 70 ms later on the opposite side of the screen. Participants were instructed to look to the opposite side of the star and press the arrow key that corresponded to the orientation of the symbol. If participants made a saccade toward the star before looking away from it, they would miss the symbol as it was only visible for 100 ms. Prosaccade and antisaccade training consisted of an equal number of trials to the left and right. Each participant completed 200 trials a day of her specific task (fixation, prosaccade, or antisaccade) and her data were recorded on the device. The number of correct trials and the mean reaction time for each practice session were recorded by the Fix‐Train and downloaded to a computer for further analysis.
ANALYSES
Behavioral Data From Practice and Test Sessions
We analyzed all behavioral data using repeated‐measures ANOVA with between‐subjects factor practice group (antisaccade, prosaccade, and fixation). The practice data had the within‐subjects factor of days (1–4), whereas the test data were analyzed with the within‐subjects factor of test session (pre‐ and post‐).
Practice data consisted of percent correct (number of correct identifications of the direction of the symbol/number of total trials) and reaction time (how long it took the participant to press the button after the disappearance of the symbol). Although these measures were of hand movements rather than eye movements, they were an adequate proxy because the participant had to have her eyes in the correct location to see the symbol orientation (see Fischer et al., 2000 for a similar report).
Test session data consisted of eye movements recorded while the participants were engaged in antisaccade tasks. Data were analyzed using MATLAB (The Mathworks, Natick, MA) as described in previous manuscripts [Dyckman et al., 2007]. Briefly, trials with blinks and trials with no saccades were eliminated. Saccades were scored for direction and reaction time. “Percent correct” antisaccade performance was calculated by dividing the number of trials made in the correct direction by the total number of scoreable trials and multiplying by 100.
fMRI Data
The data analysis consisted of standard fMRI preprocessing steps before the novel application of our combination of statistical techniques: detrending and data aggregation, decorrelation, no trend test, and clustering the processed voxel BOLD time series using PCA and K‐means. The resulting clustered maps between the two scan test points (pre‐test and post‐test) and across the three practice groups (antisaccade, prosaccade, and fixation) were then compared.
Preprocessing
We preprocessed the data using standard methods in AFNI [Cox, 1996] including motion correction, slice timing correction, head motion correction, spatial and temporal filtering, and normalization into Talairach space [Talairach and Tournoux, 1988].
Detrending and data aggregation
All 37 participants had data from 38 slices (40 × 48 voxels in size) covering the full brain. Voxels outside of the brain were masked by applying a predetermined threshold value. Visual inspection showed that activation occured predominantly in the 11th–34th slices (Talairach z = −20 to +72); therefore, we selected this subset of the full volume for the remaining analyses. We excluded the first five time points from the analysis to allow for stabilization of the magnetization. Thus, the final data set contained 37 participants, each with data from 24 slices and 70 time points. Linear and quadratic trends in the voxel time series were removed from all subject data before any further analysis.
Current software is not capable of clustering massive data sets such as the one we obtained from this study [37 subjects; 40 × 48 × 24 voxels; Mumford and Poldrack, 2007, Wanga et al., 2007]. To make clustering more manageable, it was therefore necessary to first reduce the size of the data. This is not without precedent in the literature. For example, Balslev et al. [ 2002] averaged together the results of 18 subjects before clustering. To validate the aggregation of the 37 subjects, we evaluated two center measures (mean and median) and three variation measures (standard deviation, range, and interquartile range) at each voxel for each subject. The distributions of these measures across all subjects were similar. Therefore, we combined the subjects for each group at each voxel and each time point separately using a representative value, in this case the median, and then clustered the combined brain. In what follows, we present results from the median; note, however, that the clustering results (as seen, for example, in Figs. 3 and 4) are similar with the other summary measures. An advantage of the median was that it reduced the effect of heavy outliers found in some voxels. Another advantage of this aggregating approach was that it increased the SNR, hence it produced sharper clustering brain maps. After aggregation we have a single image per group (40 × 48 × 24 voxels in size) for each of the 70 time points.
Figure 3.
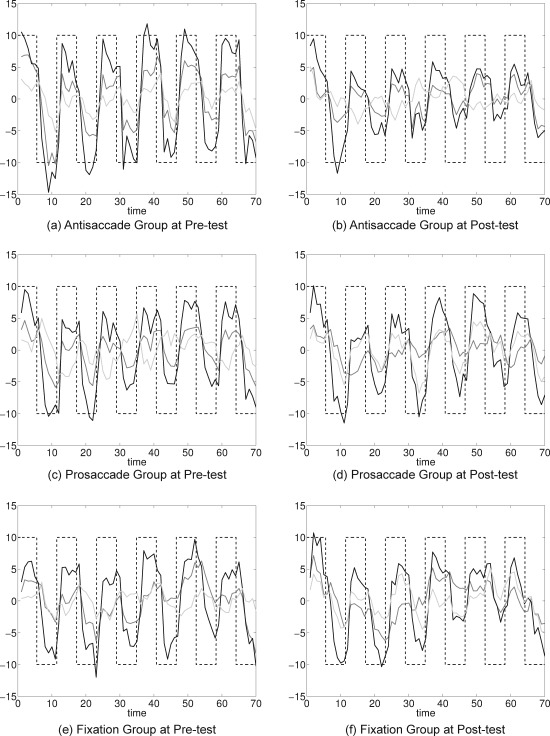
Three clusters (cluster 1 is shown in black, cluster 2 is shown in dark gray, and cluster 3 is shown in light gray) for pre‐test and post‐test for antisaccade (a, b), prosaccade (c, d), and fixation groups (e, f). Black dashed lines represent the stimulus timing with values on the x‐axis being the number of whole‐brain collections (TRs) across time.
Figure 4.
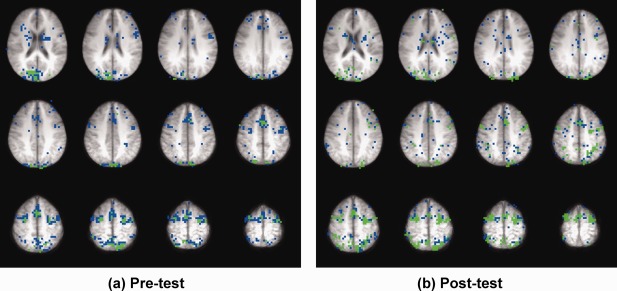
Brain maps of pre‐test and post‐test for the antisaccade practice group with two primary clusters. Voxels shown in green represent cluster 1 and those shown in blue represent cluster 2. The slices were arranged starting from inferior (Talairach z = 20, upper left) and moving superior (z = 64, lower right).
Decorrelation of fMRI time series
The existence of temporal correlation is inherent in fMRI time series and has been evaluated using different types of time series models ranging from autoregressive of low order [see, for example, Gautama and Van Hulle, 2005; Luo and Nichols, 2003; Woolrich et al., 2001] to long‐range dependence [see, for example, Bullmore et al., 2003; Park et al., 2010]. This dependence structure makes clustering analysis more challenging and should be accounted for because it is nontrivial to distinguish deterministic patterns from dependence artifacts in fMRI time series. A typical approach to address this issue in clustering analysis is to assume a temporal model for characterizing the dependence structure in fMRI time series [e.g. Worsley, 2003]. Instead of modeling the temporal correlation explicitly, we used the (model‐free) wavelet transformation to take advantage of its decorrelation and denoising properties.
Let ψ be a wavelet function with vanishing moment L [Daubechies, 1992], that is,
and
, be a shifted and scaled version of ψ. If we denote a fMRI time series by Y t at time t, then the wavelet transformation at scale j and time location k is defined as
and the βj,ks are called the wavelet coefficients of Y t.
One critically important advantage of using the wavelet transformation in fMRI analysis is that it removes the temporal correlation so that the transformed data have less serial correlation in the wavelet domain for large L [for example, see Stoev et al., 2005]. If we then cluster the voxels in the wavelet domain rather than in the time domain, the time correlation effect inherent in fMRI data is reduced. Veitch and Abry [ 1999] pointed out, however, that the theoretical improvement with large L is balanced by an increase in the number of wavelet coefficients influenced by the boundary effect, because of the finite length of the time series. They used L = 3 for internet traffic data to reduce strong serial correlation and also remove possible linear and quadratic trends in the data. In our analysis, as we removed those trends in advance, we used a Daubechies wavelet function [Daubechies, 1992] with L = 2, which would increase the number of available wavelet coefficients, and applied the wavelet transformation to each (median‐valued) voxel. We also compared clustering maps to check significant changes from L = 2 to 4 and found them similar to each other.
In addition, we applied a wavelet hard thresholding technique to obtain a sparse representation of a signal by setting the wavelet coefficients less than the threshold suggested by Donoho and Johnstone [ 1994] to zero. This denoising process amplifies important signals and removes noise in the observed data. We used the Wavelab package, available at http://stat.stanford.edu/~wavelab/, for wavelet analysis.
No trend test
For ill‐balanced data in which there is a severe lack of balance between the different classes of voxels, clustering techniques generally do not perform well as the identified clusters tend to be dominated by the one large class. Because the minority of voxels is task related in fMRI studies, clustering results can be dominated by the majority of nontask‐related voxels. Goutte et al. [ 1999] applied a loose statistical test such as F‐test as a reduction tool. Fadili et al. [ 2000] removed white noise voxels and further reduced the number of voxels by considering only the gray matter.
We performed a no trend test based on wavelets, which is more rigorous than a simple F‐test as it accounts for temporal correlation. Park et al. [ 2011] proposed the adaptive pivot test based on wavelets to detect any kind of trend in a time series. The key idea was to convert the problem of testing a trend of a function into high‐dimensional normal mean inference in the wavelet domain. We conducted this test at each voxel to identify voxels with no trend (i.e., voxels that were nontask related). Details of this procedure are provided in the Appendix. Because each voxel was tested using this approach, adjustment for multiple testing was necessary and we applied the FDR with q = 0.15. This was a relatively generous threshold, to help ensure that truly interesting voxels were not removed from the rest of the analysis.
For each session and each group, we started with 46,080 (40 × 48 × 24) voxels. After the masking procedure, 14,743–15,319 voxels were categorized as brain. Application of the no trend test with FDR for multiplicity retained 1,852–3,329 voxels that were categorized as antisaccade task related, categorizing the other voxels as nontask related.
Clustering methods
We clustered the wavelet coefficients of the remaining voxels after applying the no trend test using both K‐means and PCA K‐means clustering. The K‐means method starts from specification of the number of clusters, K, in advance and assigns each voxel to the cluster with the nearest centroid as follows [Johnson and Wichern, 2002]:
Partition each wavelet‐transformed voxel arbitrarily into K initial clusters and calculate the cluster centroids.
Reassign each voxel into the nearest cluster based on its distance from the K centroids.
Update the cluster centroid and reassign each voxel into the nearest cluster by recalculating the distance of each voxel from the updated centroids.
Repeat Step 3 until there is no more reassignment.
There are various choices for a distance metric including the Euclidean, Minkowski, Mahalanobis, and correlation. Because the data are suitably standardized by detrending and are approximately independent by the wavelet transformation, we use the Euclidean metric for computing the distance between points and cluster centroids, which is a typical choice for K‐means clustering analysis.
PCA [Jolliffe, 2002] is widely used as a data dimension reduction technique. The basic idea is that if linear relationships exist between variables, analyses will be effective if only a smaller number M of uncorrelated variables, called principal components (PC), are used. The clustering procedure for PCA K‐means is as follows:
For wavelet‐transformed voxels, obtain the complete set of PCs via PCA.
Draw the scree plot in which the horizontal axis contains the PCs sorted by decreasing fraction of total variance explained and identify the M most important PC scores.
Apply K‐means clustering to the M selected PC scores of the wavelet‐transformed voxels.
On the basis of the scree plots for pre‐test and post‐test for the three groups (Fig. 1), we selected 15 PCs. The 15 components explained at least 80% of the total variance for each test session and each practice group. The results for the three groups were similar to each other so that they were indistinguishable at each time point (pre‐test and post‐test).
Figure 1.
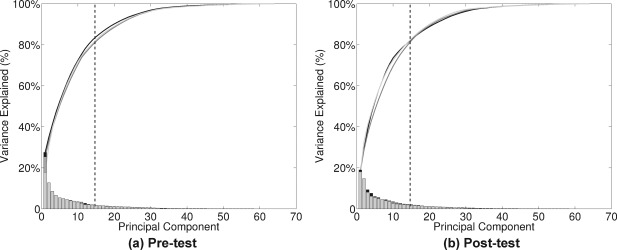
Scree plots of PCA for each test session [(a) pre‐test and (b) post‐test] and each practice group. Each curve represents one of the practice groups (antisaccade, prosaccade, or fixation), and the heights of the vertical bars on the bottom represent the contributions of each PC for that group. Note that there are little differences across the groups so that lines are indistinguishable. On the basis of these plots, we selected 15 PCs (dashed vertical line) because they explained at least 80% of the total variance.
In both methods, the choice of K is an important issue. It can be determined using criteria such as silhouette values [Ye, 2003], a likelihood approach with cross validation [Balslev et al., 2002], a hierarchical approach [Stanberry et al., 2003], or unsupervised fuzzy c‐means analysis [Fadili et al., 2000]. In our analysis, we considered different numbers of clusters, K = 3, 4, 5, and 7, and chose K = 3 because the larger numbers of clusters only broke the noise cluster into multiple clusters and did not provide additional information. Another issue in K‐means clustering is that initial partitions can affect the final clusters. We therefore ran the clustering algorithm multiple times for the same number of clusters and obtained similar clustering results to those presented in Figures 3 and 4.
In what follows, we summarize the data analysis strategy:
Preprocessing.
Masking, linear and quadratic detrending, and data aggregation using median.
Wavelet transformation of the aggregated voxels for decorrelation and wavelet thresholding for denoising.
No trend test and multiple testing adjustments using FDR to remove nontask‐related voxels.
PCA analysis to find important PC scores of the wavelet coefficients obtained from Step 3 in the remaining voxels after Step 4.
K‐means clustering analysis of the PC scores selected from Step 5.
RESULTS
Behavioral Data From Practice and Test Sessions
Practice sessions
Practice data obtained from the Fix‐Train consisted of (a) the mean percentage correct and (b) reaction time values for each group across the four practice days for the specific practice task assigned (Fig. 2).
Figure 2.
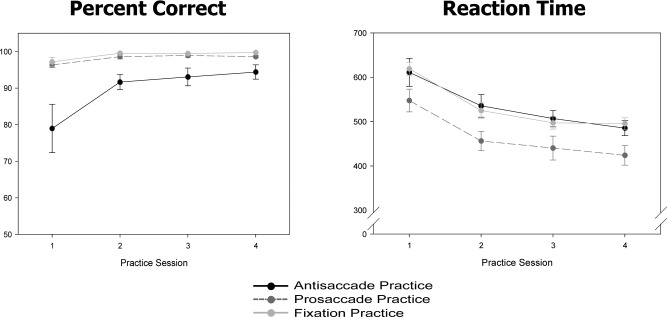
Behavioral data (percent correct and reaction time) from each groups' practice sessions. Black lines represent the antisaccade practice group, dark gray lines represent the prosaccade practice group, and light gray lines represent the fixation practice group.
For percentage correct, we found a main effect of group [F(2,30) = 8.7, P = 0.001], a main effect of time [F(3,88) = 9.84, P < 0.0001], and a significant group × time interaction [F(6,88) = 3.8, P = 0.002]. The antisaccade practice group showed more correct antisaccades across practice days, whereas the prosaccade and fixation groups remained at the same (high) level of performance across time.
For reaction time, there were main effects of group [F(2,31) = 4.44, P = 0.02] and time [F(3,91) = 79.32, P < 0.001], but no significant group × time interaction [F(6,91) = 0.39, P = 0.89]. All three groups decreased their reaction times in their assigned task across practice days.
Test sessions
Eye tracking data during fMR imaging (pre‐test and post‐test days) were available from 86% of the participants. Data from five participants (two in the antisaccade and fixation practice groups and one in the prosaccade practice group) were not recorded because of technical limitations. On antisaccade measures, there were no significant main effects of group or test session and no group × test session interaction (P‐values > 0.18). The mean percent correct for all participants over both days was 82% (SD = 11.3).
fMRI Data From Clustering Analysis
The clustering results by the two methods (K‐means and PCA K‐means) were similar, and the results from PCA K‐means clustering with K = 3 are presented for purposes of demonstration. For each group and each test session (pre‐ and post‐), the brain was partitioned into three clusters (Fig. 3) and compared with the behaviorally based reference wave. For each plot at least one cluster displays this shape, suggesting the presence of antisaccade task‐related voxels. Note that the amplitude of this primary cluster looks attenuated at post‐test compared with pre‐test, especially for the antisaccade group.
To evaluate where in the brain the task‐related clusters were located and to determine whether amplitude change occurred between pre‐test and post‐test in regions associated with saccadic performance, the voxels making up the two clusters showing greatest task‐related activation were plotted in the brain map (Fig. 4). These data for the antisaccade practice group clearly identified the well‐known circuitry supporting saccadic performance that includes FEFs, supplementary eye fields (SEFs), and posterior parietal cortex (PPC).
Next, we considered in more detail the four superior slices (Talairach coordinates z = 52, 56, 60, and 64) that clearly contained the well‐known saccadic circuitry to more specifically investigate changes from pre‐test to post‐test within and between practice groups. The locations of voxels at each time point were color coded to identify those showing antisaccade‐related activity at pre‐test only, at both pre‐test and post‐test, or at post‐test only (Fig. 5). The numbers of voxels in each category in the four slices were tabulated (Table 1). The number of voxels activated at post‐test was smaller for the antisaccade practice group compared with the other groups. This is consistent with the observation in Figure 3b that the box‐car shaped time series is attenuated for the antisaccade group at post‐test.
Figure 5.
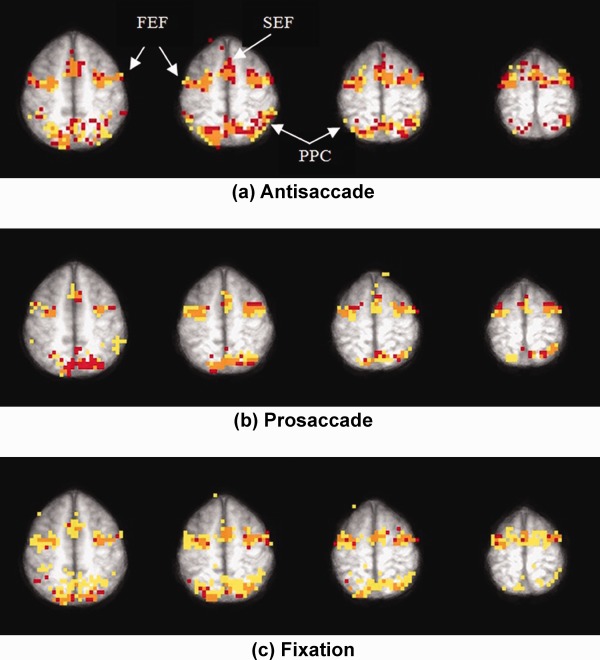
Overlay plots for (a) antisaccade, (b) prosaccade, and (c) fixation groups for four slices inferior to superior (Talairach z = 52, 56, 60, and 64). Voxels in red are activated at pre‐test but not at post‐test, those shown in orange are activated at both pre‐test and post‐test, and those shown in yellow are activated only at post‐test. Activation is observed in typical saccadic circuitry at this level of the brain, which includes bilateral FEFs, SEF at the midline, and bilateral PPC.
Table 1.
Number of activated voxels by slice for pre‐test only (red), both pre‐test and post‐test (orange), and post‐test only (yellow) for the three practice groups: antisaccade (Anti), prosaccade (Pro), and fixation (Fix) corresponding to Figure 5
| Slice | Pre‐test only (red) | Pre‐test and post‐test (orange) | Post‐test only (yellow) | ||||||
|---|---|---|---|---|---|---|---|---|---|
| Anti | Pro | Fix | Anti | Pro | Fix | Anti | Pro | Fix | |
| 29 | 43 | 41 | 16 | 51 | 16 | 31 | 39 | 33 | 92 |
| 30 | 57 | 15 | 16 | 61 | 46 | 41 | 29 | 34 | 83 |
| 31 | 38 | 16 | 9 | 43 | 22 | 33 | 33 | 40 | 63 |
| 32 | 34 | 16 | 6 | 24 | 18 | 14 | 15 | 22 | 54 |
| Total | 172 | 88 | 47 | 179 | 102 | 119 | 116 | 129 | 292 |
To evaluate the visual observations from the cluster analysis, we performed an ANOVA using the proportion of activated voxels based on Table 1 as the response variable, test session (pre‐test and post‐test), and practice condition (antisaccade, prosaccade, and fixation) as factors, location (after dividing the brain into five regions based on Fig. 5) as a block variable, and slice (z = 52, 56, 60, and 64) as replications. There was a main effect of day [F(1,98) = 5.06, P = 0.027] that showed more activated voxels at post‐test, but practice condition [F(2,98) = 1.29, P = 0.281] and location [F(4,98) = 1.68, P = 0.162] were not statistically significant. There was, however, a significant interaction between day and practice condition [F(2,98) = 50.44, P < 0.0001]. Post hoc testing showed that the antisaccade group had fewer activated voxels at post‐test than at pre‐test, whereas the other groups had more. Only the antisaccade group had a decreased proportion of activation at post‐test (Fig. 6).
Figure 6.
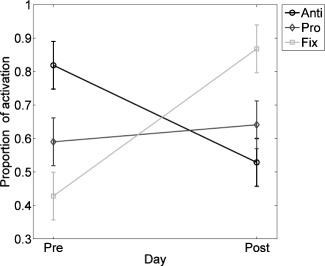
Interaction plot with 95% error bars between test session (pre‐test and post‐test) and proportion of activated voxels (i.e., the number of activated voxels/total number of voxels in a slice) by practice group: Antisaccade in black, prosaccade in dark gray, and fixation in light gray.
ROI Analysis
The previous ANOVA revealed an attenuation at post‐test for the antisaccade practice group in the saccade circuitry constrained to superior cortex (slices z = 52, 56, 60, and 64). This analysis, however, did not provide information about how specific neural regions within whole‐brain saccadic circuitry may have been differentially affected. Therefore, we conducted an additional analysis using 11 neural ROIs previously identified [Dyckman et al., 2007] including SEF, bilateral FEF, left and right PFC, right inferior frontal cortex (IFC), bilateral superior parietal lobe (SPL), bilateral cuneus, bilateral inferior parietal lobe (IPL), bilateral middle occipital gyrus (MOG), bilateral striatum, and bilateral thalamus.
To identify the specific ROIs that showed attenuation at post‐test for the antisaccade group, we performed a bootstrap resampling [Efron, 1979]‐based test by building a 95% confidence band for the difference of pre‐test and post‐test. More specifically,
For a given ROI and a given practice group, obtain the difference between pre‐test and post‐test time courses for each subject.
Obtain a bootstrap sample of the difference curves with the size corresponding to the number of subjects of the given practice group and calculate the average curve.
Repeat Step 2 1,000 times.
Use the 1,000 average curves from Step 3 to construct a 95% confidence band.
Repeat Steps 1–4 for each practice group and each ROI.
If pre‐test and post‐test for an ROI showed similar activation patterns, the confidence band for the difference curve would be expected to include 0 for most time points. If attenuation occurred at post‐test the confidence bands would miss 0 at peaks (with a positive sign) and valleys (with a negative sign). Application of this bootstrap approach suggested that four ROIs showed a strong attenuation at post‐test for the antisaccade practice group only: SEF, FEF, SPL, and cuneus (see Figs. 7, 8, 9, 10 and Supporting Information for the plots for the entire group of ROIs). The time course for each ROI and each practice group is shown as solid lines for pre‐test and dashed lines for post‐test. Time points where statistically significant attenuations occurred at post‐test are identified by dark gray bands. Visual inspection of these four ROIs showed that attenuation at post‐test was characteristic in these regions only for the antisaccade practice group.
Figure 7.
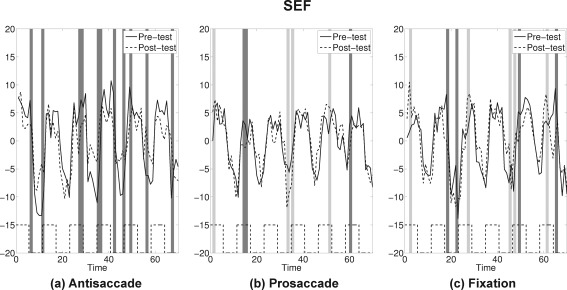
SEF: The average time series plots for pre‐test (solid) and post‐test (dashed) are drawn for the three practice groups. Black dashed lines at the bottom show the timing of antisaccade task blocks. Dark gray bands represent time points where attenuations at post‐test were statistically significant, and light gray bands represent time points where amplifications at post‐test were statistically significant by the bootstrap resampling method.
Figure 8.
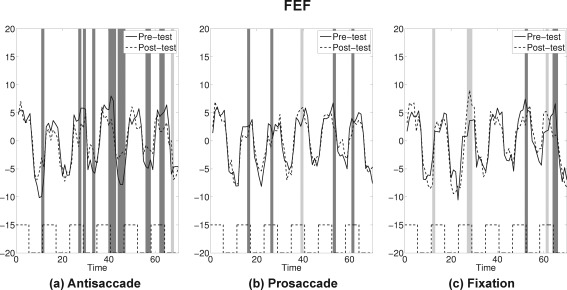
FEF: The average time series plots for pre‐test (solid) and post‐test (dashed) are drawn for the three practice groups. Black dashed lines at the bottom show the timing of antisaccade task blocks. Dark gray bands represent time points where attenuations at post‐test were statistically significant, and light gray bands represent time points where amplifications at post‐test were statistically significant by the bootstrap resampling method.
Figure 9.
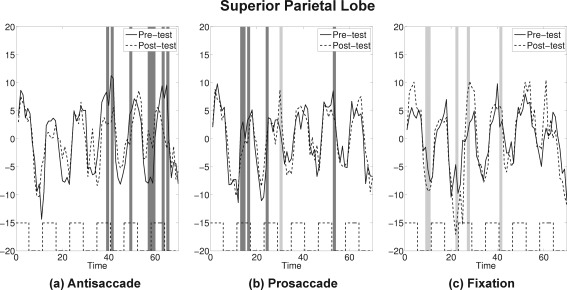
SPL: The average time series plots for pre‐test (solid) and post‐test (dashed) are drawn for the three practice groups. Black dashed lines at the bottom show the timing of antisaccade task blocks. Dark gray bands represent time points where attenuations at post‐test were statistically significant, and light gray bands represent time points where amplifications at post‐test were statistically significant by the bootstrap resampling method.
Figure 10.
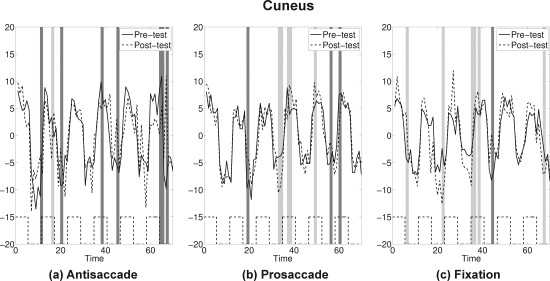
Cuneus: The average time series plots for pre‐test (solid) and post‐test (dashed) are drawn for the three practice groups. Black dashed lines at the bottom show the timing of antisaccade task blocks. Dark gray bands represent time points where attenuations at post‐test were statistically significant, and light gray bands represent time points where amplifications at post‐test were statistically significant by the bootstrap resampling method.
The converse of attenuation at post‐test was also possible and such an amplification effect was indicated by confidence bands that would miss 0 at peaks (with a negative sign) and valleys (with a positive sign). Time points that show statistically significant amplification at post‐test are identified by light gray bands in the plots (Figs. 7, 8, 9, 10 and Supporting Information). Although the prosaccade and fixation practice groups showed some periods of amplification, there was little evidence of amplification in the antisaccade group at post‐test.
The findings from this ROI analysis are summarized in Table 2. The values indicate differences between the proportion of time points (out of 70) that had significant attenuations (dark gray bands) and the proportion of time points showing amplification (light gray bands) for each practice group at each ROI. A general pattern emerged showing that in the ROIs identified a priori as saccadic circuitry [Dyckman et al., 2007] there was a general attenuation (positive values showing less activation at post‐test) associated with task‐specific practice (i.e., the antisaccade group). There appeared to be little dramatic change in either direction in the prosaccade practice group. The only group that showed evidence of consistent amplification (negative values showing more activation at post‐test) across time was the fixation practice group. This pattern replicates that shown in Figure 6 but with increased specificity and improved ability to evaluate which regions of the circuitry may be crucial for practice‐related changes in performance.
Table 2.
Differences of the proportions of statistically significant attenuations (positive values) and amplifications (negative values) for the three groups at each ROI
| ROI | Anti | Pro | Fix |
|---|---|---|---|
| SEF | 0.16 | −0.01 | −0.01 |
| FEF | 0.19 | 0.04 | −0.01 |
| SPL | 0.11 | 0.06 | −0.07 |
| Cuneus | 0.09 | −0.03 | −0.07 |
| Thalamus | 0.04 | 0.03 | −0.09 |
| IPL | −0.03 | 0.00 | −0.14 |
| PFC—L | −0.04 | 0.07 | 0.00 |
| PFC—R | 0.04 | −0.01 | −0.01 |
| Striatum | 0.06 | 0.04 | −0.01 |
| MOG | −0.01 | −0.01 | 0.01 |
| IFC | 0.01 | 0.03 | 0.00 |
These values are calculated as: [(proportion of time points attenuated (i.e., number of time points significantly decreased at post‐test) − proportion of time points amplified (i.e., number of time points significantly increased at post‐test))/70]. Values greater than or equal to 0.07 are boldfaced. [SEF (Talairach x = 0, y = 1, z = 56); FEF (LH −34, 5, 53; RH 34, 7, 52); SPL (LH −22, −59, 55; RH 15, −60, 55); cuneus (LH −14, −79, 7; RH 10, −78, 7); thalamus (LH −13, −13, 12; RH 10, −13, 14); IPL (LH −47, −31, 25; RH 54, −42, 23); PFC (LH −34, 34, 38; RH 36, 43, 26); striatum (LH −18, 1, 17; RH 15, 2, 18); MOG (LH −29, −85, 4; RH 24, −87, 4); and IFC (RH 37, 32, 1)].
CONCLUSIONS
This study evaluated brain activation associated with practice‐related cognitive control during eye movement tasks. All participants were tested on antisaccade performance at pre‐test and post‐test while fMRI data were acquired. In between pre‐test and post‐test, participants engaged in daily practice of one assigned eye movement task, antisaccade, prosaccade, or fixation. Over the series of analyses conducted, task‐consistent practice was associated with decreased activation from pre‐test to post‐test. The antisaccade practice group was the only group to show consistently decreased antisaccade‐related activation in saccadic circuitry, particularly evident in FEF, SEF, SPL, and cuneus. This pattern may be associated with increased efficiency such that fewer neural resources were necessary to support the response due to task‐specific practice. A similar pattern has been reported in numerous studies showing decreased activity associated with learning [Garavan et al., 2000, Jansma et al., 2001, Koch et al., 2006, Poldrack et al., 2005].
A distinctly different pattern of neural activation response was demonstrated by the two groups who practiced test‐inconsistent tasks (prosaccade and fixation). The prosaccade practice group was most likely to show unchanged activation levels between pre‐test and post‐test. Regional analyses suggested some minor decreases in activation at post‐test, but they were neither as widespread nor as strong as those observed in the antisaccade practice group. Thus, the brain activation across time in the prosaccade group was relatively stable. The fixation practice group was the only one that demonstrated generally increased activation at post‐test. The persistent increases in the fixation group may suggest strengthening of the neural circuitry that inhibits rapid responses away from the fixation target [Leigh and Zee, 2006]. Although both prosaccade and fixation practice groups constituted control conditions, their different task requirements would predict different brain activation patterns.
In summary, these data demonstrated that changes in brain activation patterns of the well‐identified [McDowell et al., 2008, Munoz and Everling, 2004, Sweeney et al., 2007] neural circuitry supporting antisaccade performance differed between task‐specific and task‐irrelevant practice. The changes in brain activation were observed despite no quantifiable differences in antisaccade performance at post‐test, which may imply that brain activation patterns are more sensitive than behavioral measures as indications of plasticity. Of course, this intervention was merely 1 week in duration. It may take longer for changes in the behavioral component of the task to be manifest if they are a less sensitive measure of changes in brain function.
A notable component of this study was the application of a novel combination of statistical techniques selected specifically to circumvent typically acknowledged methodological problems associated with the structure of the data generated via fMRI and/or the model‐based GLM analyses as they are commonly applied to fMRI data. These problems include massive‐sized data that are ill‐balanced and influenced by temporal autocorrelations, which we successfully moderated via the integration and application of clustering routines and wavelet analyses. The difficulties inherent in accurate modeling of the BOLD response, which is standard in GLM analyses, was likewise avoided in this article by using a data‐driven technique. This improved analysis successfully identified the well‐known brain activation patterns known to support antisaccade performance. Not only was the circuitry identified but also the analysis of practice‐related changes could be evaluated with greater confidence because these methods were more resistant to common problems. As such, the differences between practice groups across time were tested in a rigorous manner and revealed task‐specific brain activation changes in cognitive control across time.
Supporting information
Supporting Information Figure 1
Supporting Information
Acknowledgments
The authors thank Jazmin Camchong for help with data collection. They also thank the referees for helpful comments. The Franklin Research Seed Grant, UGA Psychology Department.
NO TREND TEST
We summarize the no trend test proposed by Park et al. [ 2011]. Let Y it denote the BOLD signal value at the ith voxel and the tth time point. Then, we can set up a regression model as follows. Suppose that
where f i is a trend function in the ith voxel, n is the total number of time points, and εit is the error term in the ith voxel time series with mean 0 and standard deviation σ. Our interest is to test H 0 : f i = 0 for each i, which implies that the corresponding voxel is not active. The proposed approach transforms this null hypothesis to the wavelet domain. To simplify notation, we drop i from here on.
Let φ and ψ denote scaling and wavelet functions, respectively, and define their dilated and translated versions as
where j and k represent the scale and location, respectively. Assume that a trend function f∊L 2[0,1], then one can expand f with the wavelet basis functions:
where J 0 is a positive integer, , and denote the inner product in L 2[0,1]. In practice, the series is truncated based on the sample size . In our analysis, we choose J 0 = 3 and J 1 = 6 by binning the data to avoid boundary effects. The wavelet coefficients can be estimated as follows:
Denoting the null hypothesis we test becomes , i.e., all the wavelet coefficients are 0.The standard deviation of the error can be estimated using the wavelet coefficient estimates
where . Ωε consider the soft thresholding estimators to increase the power of the test. Define , where sgn( . Here, indicates that the negative pieces are set to zero. For λ, one can use either the universal threshold, , or the levelwise SureShrink rule [Donoho and Johnstone, 1995], which minimizes
where
Under , Genovese and Wasserman [ 2005] showed that
which leads to the rejection region
where stands for the percentile of the standard normal distribution.
REFERENCES
- Balslev D, Nielsen F, Frutiger S, Sidtis J, Christiansen T, Svarer C, Strother S, Rottenberg D, Hansen L, Paulson O, Law I (2002):Cluster analysis of activity‐time series in motor learning.Hum Brain Mapp 15:135–145. [DOI] [PMC free article] [PubMed] [Google Scholar]
- Benjamini Y, Hochberg Y (1995):Controlling the false discovery rate: A practical and powerful approach to multiple testing.J R Stat Soc Ser B 57:289–300. [Google Scholar]
- Benjamini Y, Hochberg Y (2000):On the adaptive control of the false discovery rate in multiple testing with independent statistics.J Educ Behav Stat 25:60–83. [Google Scholar]
- Bullmore ET, Suckling J, Zelaya F, Long C, Honey GD, Routledge C, Ng V, Fletcher PC, Brown J, Williams SCR (2003):Wavelets and statistical analysis of functional magnetic resonance images of the human brain.Stat Methods Med Res 12:375–399. [DOI] [PubMed] [Google Scholar]
- Camchong J, Dyckman K, Austin B, Clementz B, McDowell J (2008):Common neural circuitry supporting volitional saccades and its disruption in schizophrenia patients and relatives.Biol Psychiatry 64:1042–1050. [DOI] [PMC free article] [PubMed] [Google Scholar]
- Chein JM, Schneider W (2005):Neuroimaging studies of practice‐related change: fMRI and meta‐analytic evidence of a domain‐general control network for learning.Cogn Brain Res 25:607–623. [DOI] [PubMed] [Google Scholar]
- Cox RW (1996):AFNI: Software for analysis and visualization of functional magnetic resonance neuroimages.Comput Biomed Res 29:162–173. [DOI] [PubMed] [Google Scholar]
- Daubechies I (1992):Ten Lectures on Wavelets.Philadelphia:Society for Industrial and Applied Mathematics. [Google Scholar]
- Donoho D, Johnstone J (1994):Ideal spatial adaptation by wavelet shrinkage.Biometrika 81:425–455. [Google Scholar]
- Donoho D, Johnstone J (1995):Adapting to unknown smoothness via wavelet shrinkage.J Am Stat Assoc 90:1200–1224. [Google Scholar]
- Dyckman K, Camchong J, Clementz B, McDowell J (2007):An effect of context on saccade‐related behavior and brain activity.Neuroimage 36:774–784. [DOI] [PubMed] [Google Scholar]
- Efron B (1979):Bootstrap methods: Another look at the jackknife.Ann Stat 7:1–26. [Google Scholar]
- Fadili M, Ruan S, Bloyet D, Mazoyer B (2000):A multistep unsupervised fuzzy clustering analysis of fMRI time series.Hum Brain Mapp 10:160–178. [DOI] [PMC free article] [PubMed] [Google Scholar]
- Fischer B, Hartnegg K, Mokler A (2000):Dynamic visual perception of dyslexic children.Perception 29:523–530. [DOI] [PubMed] [Google Scholar]
- Ford A, Goltz C, Brown G, Everling S (2005):Neural processes associated with antisaccade task performance investigated with event‐related fMRI.J Neurophysiol 94:429–440. [DOI] [PubMed] [Google Scholar]
- Forman SD, Cohen JD, Fitzgerald M, Eddy WF, Mintun MA, Noll, DC (1995):Improved assessment of significant activation in functional magnetic resonance imaging (fMRI): Use of a cluster‐size threshold.Magn Reson Med 33:636–647. [DOI] [PubMed] [Google Scholar]
- Garavan H, Kelley D, Rosen A, Rao SM, Stein EA (2000):Practice‐related functional activation changes in a working memory task.Microsc Res Tech 51:54–63. [DOI] [PubMed] [Google Scholar]
- Gautama T, Van Hulle MM (2005):Estimating the global order of the fMRI noise model.Neuroimage 26:1211–1217. [DOI] [PubMed] [Google Scholar]
- Genovese CR, Wasserman L (2005):Confidence sets for nonparametric wavelet regression.Ann Stat 33:698–729. [Google Scholar]
- Genovese CR, Lazar NA, Nichols TE (2002):Thresholding of statistical maps in functional neuroimaging using the false discovery rate.Neuroimage 15:870–878. [DOI] [PubMed] [Google Scholar]
- Goutte C, Toft P, Rostrup E, Nielsen F, Hansen L (1999):On clustering fMRI time series.Neuroimage 9:298–310. [DOI] [PubMed] [Google Scholar]
- Hartigan A, Wong A (1979):Algorithm AS 136: A K‐means clustering algorithm.J R Stat Soc Ser C 28:100–108. [Google Scholar]
- Heller R, Stanley D, Yekutieli D, Rubin N, Benjamini Y (2006):Cluster based analysis of fMRI data.Neuroimage 33:599–608. [DOI] [PubMed] [Google Scholar]
- Jansma J, Ramsey N, Slagter H, Kahn RS (2001):Functional anatomical correlates of controlled and automatic processing.J Cogn Neurosci 13:730–743. [DOI] [PubMed] [Google Scholar]
- Johnson A, Wichern W (2002):Applied Multivariate Statistical Analysis, 5th edNew York:Prentice‐Hall. [Google Scholar]
- Jolliffe T (2002):Principal Component Analysis, 2nd edNew York:Springer. [Google Scholar]
- Keedy SK, Ebens CL, Keshavan MS, Sweeney JA (2006):Functional magnetic resonance imaging studies of eye movements in first episode schizophrenia: Smooth pursuit, visually guided saccades and the oculomotor delayed response task.Psychiatry Res 146:199–211. [DOI] [PubMed] [Google Scholar]
- Kelly A, Garavan H (2005):Human functional neuroimaging of brain changes associated with practice.Cereb Cortex 15:1089–1102. [DOI] [PubMed] [Google Scholar]
- Koch K, Wagner G, von Consbruch K, Nenadic I, Schultz C, Ehle C, Reichenbach J, Sauer H, Schlosser R (2006):Temporal changes in neural activation during practice of information retrieval from short‐term memory: An fMRI study.Brain Res 1107:140–150. [DOI] [PubMed] [Google Scholar]
- Leigh J, Zee D (2006):The Neurology of Eye Movements.New York:Oxford University Press. [Google Scholar]
- Luo W, Nichols T (2003):Diagnosis and exploration of massively univariate neuroimaging models.Neuroimage 19:1014–1032. [DOI] [PubMed] [Google Scholar]
- McDowell J, Dyckman K, Austin B, Clementz A (2008):Neurophysiology and neuroanatomy of reflexive and volitional saccades: Evidence from studies of humans.Brain Cogn 38:255–270. [DOI] [PMC free article] [PubMed] [Google Scholar]
- Mumford JA, Poldrack RA (2007):Modeling group fMRI data.Soc Cogn Affect Neurosci 2:251–257. [DOI] [PMC free article] [PubMed] [Google Scholar]
- Munoz P, Everling S (2004):Look away: The anti‐saccade task and the voluntary control of eye movement.Nat Rev Neurosci 5:218–228. [DOI] [PubMed] [Google Scholar]
- Muri RM, Heid O, Nirkko AC, Ozdoba C, Felblinger J, Schroth G, Hess CW (1998):Functional organisation of saccades and antisaccades in the frontal lobe in humans: A study with echo planar functional magnetic resonance imaging.J Neurol Neurosurg Psychiatry 65:374–377. [DOI] [PMC free article] [PubMed] [Google Scholar]
- O'Driscoll A, Alpert M, Matthysse W, Levy L, Rauch L, Holzman S (1995):Functional neuroanatomy of antisaccade eye movements investigated with positron emission tomography.Proc Natl Acad Sci USA 92:925–929. [DOI] [PMC free article] [PubMed] [Google Scholar]
- Park C, Lazar NA, Ahn J, Sornborger (2010):A multiscale analysis of the temporal characteristics of resting‐state fMRI data.J Neurosci Methods 193:1407–1433. [DOI] [PubMed] [Google Scholar]
- Park C, Ahn J, Hendry M, Jang W (2011):Analysis of long period variable stars with nonparametric tests for trend detection.J Am Stat Assoc 106:832–845. [Google Scholar]
- Paus T (1996):Location and function of the human frontal eye field: A selective review.Neuropsychologia 34:475–483. [DOI] [PubMed] [Google Scholar]
- Poldrack RA, Sabb FW, Foerde K, Tom SM, Asarnow RF, Bookheimer SY, Knowlton BJ (2005):The neural correlates of motor skill automaticity.J Neurosci 25:5356–5364. [DOI] [PMC free article] [PubMed] [Google Scholar]
- Raemaekers M, Jansma JMJ, Cahn W, Van der Geest JN, Van der Linden JA, Kahn RS, Ramsey NF (2002):Neuronal substrate of the saccadic inhibition deficit in schizophrenia investigated with 3‐dimensional event‐related functional magnetic resonance imaging.Arch Gen Psychiatry 59:313–320. [DOI] [PubMed] [Google Scholar]
- Schneider W, Chein J (2003):Controlled and automatic processing: Behavior, theory and biology.Cogn Sci 27:525–559. [Google Scholar]
- Schneider W, Shiffrin R (1977):Controlled and automatic human information processing. I. Detection, search, and attention.Psychol Rev 84:1–66. [Google Scholar]
- Şendur L, Maxim V, Whitcher B, Bullmore E (2005):Multiple hypothesis mapping of functional MRI data in orthogonal and complex wavelet domains.IEEE Trans Signal Process 53:3413–3426. [Google Scholar]
- Stanberry L, Nandy R, Cordes D (2003):Cluster analysis of fMRI data using dendrogram sharpening.Hum Brain Mapp 20:201–219. [DOI] [PMC free article] [PubMed] [Google Scholar]
- Stoev S, Taqqu M, Park C, Marron J (2005):On the wavelet spectrum diagnostic for Hurst parameter estimation in the analysis of internet traffic.Comp Netw 48:423–445. [Google Scholar]
- Sweeney JA, Luna B, Keedy SK, McDowell JE, Clementz BA (2007):fMRI studies of eye movement control: Investigating the interaction of cognitive and sensorimotor brain systems.Neuroimage 36:T52–T60. [DOI] [PMC free article] [PubMed] [Google Scholar]
- Talairach J, Tournoux P (1988):Co‐planar Stereotaxic Atlas of the Human Brain: 3‐Dimensional Proportional System—An Approach to Cerebral Imaging.New York:Thieme Medical Publishers. [Google Scholar]
- Turkheimer FE, Smith CB, Schmidt K (2001):Estimation of the number of “true” null hypotheses in multivariate analysis of neuroimaging data.Neuroimage 13:920–930. [DOI] [PubMed] [Google Scholar]
- Van De Ville D, Unser M (2008):False discovery rate for wavelet‐based statistical parametric mapping.IEEE J Sel Top Signal Process 2:897–906. [Google Scholar]
- Veitch D, Abry P (1999):Wavelet analysis of long‐range dependence traffic.IEEE Trans Inform Theory 44:2–15. [Google Scholar]
- Wanga Z, Childressc AR, Wanga J, Detrea JA (2007):Support vector machine learning‐based fMRI data group analysis.Neuroimage 36:1139–1151. [DOI] [PMC free article] [PubMed] [Google Scholar]
- Windischberger C, Lamm C, Bauer H, Mosera E (2003):Human motor cortex activity during mental rotation.Neuroimage 20:225–232. [DOI] [PubMed] [Google Scholar]
- Woolrich W, Ripley D, Brady M, Smith M (2001):Temporal autocorrelation in univariate linear modeling of fMRI data.Neuroimage 14:1370–1386. [DOI] [PubMed] [Google Scholar]
- Worsley KJ (2003):Detecting activation in fMRI data.Stat Methods Med Res 12:401–418. [DOI] [PubMed] [Google Scholar]
- Worsley KJ, Friston KJ (1995):Analysis of fMRI time‐series revisited—Again.Neuroimage 2:173–181. [DOI] [PubMed] [Google Scholar]
- Ye N (2003):The Handbook of Data Mining, Mahwah.New Jersey:Lawrence Erlbaum Associates. [Google Scholar]
- Ye J, Lazar N, Li Y (2009):Geostatistical analysis in clustering fMRI time series.Stat Med 28:2490–2508. [DOI] [PubMed] [Google Scholar]
Associated Data
This section collects any data citations, data availability statements, or supplementary materials included in this article.
Supplementary Materials
Supporting Information Figure 1
Supporting Information


