

Abstract
Manganese (Mn)-enhanced MRI (MEMRI) has found a growing number of applications in anatomical and functional imaging in small animals, based on the cellular uptake of Mn ions in the brain, heart and other organs. Previous studies have relied on endogenous mechanisms of paramagnetic Mn ion uptake and enhancement. To genetically control MEMRI signals, we reverse engineered a major component of the molecular machinery involved in Mn uptake, the divalent metal transporter, DMT1. DMT1 provides positive cellular enhancement in a manner that is highly sensitive and dynamic, allowing greater spatial and temporal resolution for MRI compared to previously proposed MRI reporters such as ferritin. We characterized the MEMRI signal enhancement properties of DMT1-expressing cells, both in vitro and in vivo in mouse models of cancer and brain development. Our results show that DMT1 provides an effective genetic MRI reporter for a wide range of biological and pre-clinical imaging applications.
Keywords: Manganese (Mn), Mn-Enhanced MRI (MEMRI), Reporter Protein, Molecular Imaging
INTRODUCTION
MRI is a widely used and powerful tool for biological and clinical imaging, providing a wealth of in vivo anatomical and functional data from the most widely used animal model systems, including the mouse. Compared to other live animal imaging methods, MRI does not suffer the limitations in tissue penetration of optical microscopy or ultrasound, and has much better spatial resolution than bioluminescence or micro-PET (1). Despite these advantages, moving MRI into the realm of “molecular imaging” by developing effective MRI reporter genes continues to be a major challenge (2).
Development of an MRI reporter is fundamentally different from the fluorescent proteins commonly used for optical imaging. The interaction of any protein with solvent directly affects the T1 and/or T2 relaxation times, which are the basis for image contrast in conventional MRI, but these changes are generally too weak to practically correlate to specific protein levels in a living animal. Specific peptides have been proposed as MRI reporters, based on the inclusion of amino acid residues with protons that produce a chemical shift in the NMR signal (3), but the in vivo efficacy of this method has not been established. Second order effects of proteins have been explored with more success. Proteins have a wide range of interactions with paramagnetic metals such as iron (Fe), which function as contrast agents by reducing T1 and/or T2. The best example of a metalloprotein as a reporter is the Fe storage protein, Ferritin (4,5). Ferritin accumulates intracellular Fe into nanoparticles that can be detected in vivo under certain conditions, but significant technical challenges remain. These include the need for very high levels of Ferritin (4) and/or Fe (6), slow switching of MRI signals as Fe accumulates in Ferritin (7), and unpredictable effects on T2 relaxation in different cell types and tissues (5).
Given the ongoing development and current limitations of Ferritin and other candidates, we decided to take a fundamentally different approach to developing an MRI reporter. The field of manganese (Mn)-enhanced MRI (MEMRI) is already rapidly growing in terms of versatility and applications (8,9). Ca channels have been identified as one mechanism of Mn uptake in both the brain and heart (10,11). In the nervous system, MEMRI has been developed for both activity imaging, based on Mn uptake through Ca channels, and tract tracing based on the axonal transport of Mn (12,13,14,15). However, Ca channels are not the sole means of Mn uptake in cells; indeed, DMT1 has been shown to actively transport Mn and other divalent metals (16), and the high affinity of DMT1 for Mn has been characterized in several tissues (17). Based on this observation, we hypothesized that engineering the expression of DMT1 would result in detectable contrast in vivo. This would result in a novel reporter protein that takes full advantage of the existing methodologies already developed for MEMRI.
METHODS
Cloning
A mouse DMT1 DNA construct, including an integrated HA tag (18), was cloned into a pCAG vector with IRES-eGFP for co-expression of DMT1 and eGFP. The pCAG-DMT1-IRES-eGFP element was also cloned into a retroviral vector, and virus was prepared as described previously (19).
DMT1 Stable Cell Lines
All cell lines were cultured in DMEM +10%FBS. HEK, B16 and GL261 cell lines were engineered to overexpress DMT1 by exposing cells to the DMT1-IRES-eGFP retrovirus for 48h, then sorting for eGFP expression (Coulter MoFlo). Knockdown cell lines were similarly generated using lentiviral shRNA against DMT1 (Open Biosystems V2LMM_29721).
Protein Expression Assay
All cell lines were assayed for expression levels of DMT1 relative to β-actin. Cells were cultured on a 24 well plate, fixed with PFA, and stained for DMT1 (Abcam ab55812) and β-actin (Abcam ab8226) using infrared (IR) labeled secondary antibodies (LI-COR goat anti mouse IR-800 926–32210; and goat anti rabbit IR-680 926–3221). Plates were assayed on an IR scanner (Odyssey, LI-COR) and relative expression levels (DMT1/β-actin) were shown as a fold change relative to control cells.
MRI of Cell Lines
Each cell line was supplemented with MnCl2 for 1h, washed with PBS and trypsinized. Loose cells were centrifuged for 1 minute at 800xg in 1.5mL microcentrifuge tubes. Trypsin was aspirated away and replaced with 1mL of cold DMEM, then gently repelleted. Loose cell pellets were then pipetted into 2.4mm NMR tubes (New Era SK-210907) and centrifuged for 1-minute at 800xg, then placed in a syringe phantom filled with cold DMEM for MRI.
Cell pellets were imaged on a 7T Bruker Biospec system, using a T1-weighted 2D multislice Gradient Echo (2DGE) sequence (echo time, TE = 3.1ms; repetition time, TR = 100ms; flip angle, FA = 45°) and a 2D multislice Spin Echo (2DSE) saturation recovery sequence (TE = 11ms; TR = 190ms, 500ms, 900ms, 1.5s, 3s), both with in-plane resolution of 100μm × 100μm and 500μm slice thickness.
The 2DSE images with increasing TR values were used to calculate a T1 map using the MRI Analysis Calculator Plugin for ImageJ. T1 maps were calculated using I(x,y) = Kρ(x,y) [1−e−TR/T1(x,y)], where I(x,y) is the signal intensity for a given pixel (x,y), K is a constant and ρ(x,y) is the proton density, assumed to be constant for each pixel (x,y) at every TR. Data were plotted as R1(=1/T1) (mean ± standard deviation, sd).
Measurement of cellular metabolic rate by MTT assay
The MTT assay quantitatively measures the rate of esterases as an analog for viability of cells in culture. Signal is determined both by the total number of cells in culture and by the metabolic rate of those cells. Both control HEK and +DMT1–1 cells were plated at a starting concentration of 5×10³ cells per well of a 96 well plate so that the assay would accurately reflect cell proliferation. Cells were incubated for 48h under normal cell culture conditions then selected wells were supplemented with 300μM Mn for 1h as in the cellular MRI protocol. Potential cytotoxic stress would be reflected in a lower metabolic rate and therefore less enzymatic activity compared to naïve cells. Supplemented media was replaced with phenol red free DMEM, which would not interfere with absorbance assay. The assay was performed as per the manufacturer’s instructions (Vybrant MTT; Molecular Probes) using a 4h live incubation and a 12h solublization step. Absorbance was read at 570nm. The assay was performed in triplicate using 8 wells per condition. To compare across plates, all data were normalized to the average absorbance of naïve HEK cells.
Animals and Tumor Models
All mice were maintained under protocols approved by the Institutional Animal Care and Use Committee at NYU School of Medicine. Melanomas were generated by injecting 106 B16 melanoma cells subcutaneously into both flanks of C57Bl/6 mice, and grown in vivo for 7–10 days before imaging. GL261 cells were prepared and injected stereotaxically into the brain of each C57Bl/6 mouse as described previously (20), and grown in vivo for 3 weeks before imaging. Mice were also electroporated with pCAG-DMT1-IRES-eGFP DNA according to published protocols at both E13.5 (21) and P0 (22), and imaged as neonates at P1 and P5, respectively.
In Vivo MRI
Mice were imaged on a 7T Bruker Biospec system, using both T1-weighted 2DGE (TE/TR=3.1/50ms; FA=45°; in-plane resolution = 100μm × 100μm; slice thickness = 500μm) and T1-weighted 3DGE, with isotropic resolution of either [150μm]3 (TE/TR=3.1/50ms; FA=45°) or [100μm]3 (TE/TR=4.7/50ms; FA=40°). Mice with tumors were given an IP injection of an aqueous solution of MnCl2 (80mg/kg) and imaged 3h/24h post injection for B16/GL261 tumors. After electroporation, neonatal mice were imaged using one of the 3DGE sequences, 8h after IP injection of MnCl2 (80mg/kg) into the nursing mothers. All mice were anaesthetized with 1.5% isofluorane in air during MRI. 3D datasets were imported into Amira (Visage Imaging) for semi-automated segmentation of the brain and cortex. Within the cortex, a threshold of 1.5-sd above the mean signal intensity was chosen for best fit the correlative histology data across both groups of electroporated animals. Threshold voxels were rendered as a surface (in red) and superimposed on semi-transparent 3D projections of the whole brain.
eGFP imaging and IHC
After in vivo MRI, perfusion fixed neonatal brains were extracted and imaged directly or dissected into 1mm coronal slices for imaging eGFP (Leica MZ16F). The brains were further sectioned (30μm) on a cryostat (Leica CM350S) and stained for DMT1 (Primary DMT1 antibody: Abcam ab55812; secondary antibody: Jackson Immuno 215–165–005 for microscopy and IR-680 926–3221 for IR brain slice imaging).
Statistical Analysis
Expression values were presented as ratiometric fold change compared to mean values of control cells (Test/Control). MRI contrast was computed as:
The control regions were one of the following: contralateral tumors; healthy brain tissue; or unelectroporated cortical tissue. All contrast values were expressed as a percentage difference. All p-values were calculated using a two-tailed Student’s t-test, and variation was expressed as the sd.
RESULTS
DMT1 expression correlates with MEMRI signal in the neonatal mouse brain
Using standard MEMRI protocols to image the brains of early postnatal mice, two of the most apparent areas of Mn-enhancement are the cerebellum (Figure 1a,b) and the hippocampus (Figure 1d,e). Immunohistochemistry showed these regions of enhancement correlated with DMT1 immunostaining (Figure 1c,f). However, other tissues such as the olfactory bulb were also enhanced on MEMRI images, but without appreciable DMT1 staining (data not shown). These data show that DMT1 expression correlates with MEMRI enhancement in selected brain regions, but enhancement is not dependent solely on the presence of DMT1, as expected since alternative mechanisms of cellular Mn uptake, for example via active Ca channels, are well established (9). This evidence, together with previous reports of cellular Mn uptake via DMT1 (16), provided the motivation to investigate the potential of DMT1 expression to control MEMRI signal enhancement.
Figure 1. DMT1 expression and MEMRI signal are correlated in the neonatal mouse brain.
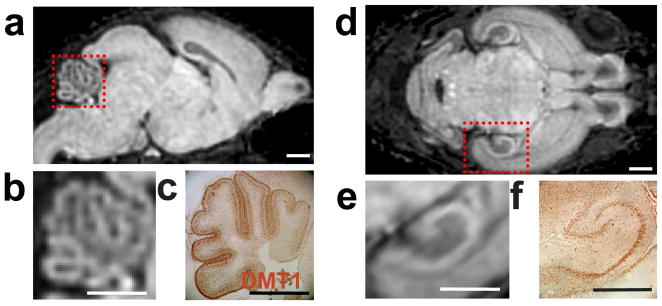
Immunostaining for DMT1 was compared qualitatively to MEMRI enhancement patterns (3DGE with 100μm isotropic resolution) at postnatal day (P)5. Sagittal images showed enhancement in the outer layer of the cerebellar cortex, corresponding to the external granule layer (EGL) (a, and magnified inset in b). This enhancement pattern in the cerebellum was very similar to the DMT1 immunostaining results in matched histological sections(c). In addition to cerebellum, MEMRI also showed marked enhancement in the hippocampus (d, and magnified inset in e). Again, DMT1 immunostaining correlated with the MEMRI enhancement pattern in the hippocampus (f). Scale bars = 1.0-mm (a–f).
Cellular expression of DMT1 induces MEMRI signal enhancement, in vitro
To study the effects of DMT1 on MEMRI signal and contrast, we first generated cell lines with varying levels of DMT1, by overexpressing the protein or an shRNA to knockdown DMT1 expression (Figure 2). The knockdown cell line (−DMT1) reduced DMT1 expression to approximately 0.6-fold, while the overexpressing (+DMT1) lines increased DMT1 levels up to 3-fold (Figure 2a). It should be noted that these differences in expression level are very low compared to the reported 60-fold overexpression of Ferritin necessary to detect significant changes in MRI contrast (7). Confocal microscopy of DMT1-stained +DMT1 cells showed very similar membrane-localized expression patterns as previous publications (18,23), providing confidence that the subcellular distribution of DMT1 is the same as previous reports of DMT1 localization and function (data not shown). Cells were supplemented for 1h with MnCl2 at a level approximating that of a standard dose for rodent MEMRI (300μM) (15), and the live cells were imaged using a T1-weighted sequence. The results showed excellent qualitative correlation between DMT1 expression and MEMRI signal levels (Figure 2b; n ≥6 for each cell type). Notably, the level of signal enhancement in the +DMT1 cells was on par with even the most recently engineered targeted chemical agents (24),(25).
Figure 2. Effect of cellular DMT1 expression on MEMRI signal.

Relative levels of DMT1 expression were assayed in HEK293 cells, including an shRNA knock down line that reduced expression to 0.6-fold (−DMT1) and three cell lines that ectopically overexpressed DMT1 by up to 3-fold (+DMT1–1,2,3) (a). In T1-weighted 2DGE images after Mn supplementation, −DMT1 cells had a small but visibly reduced contrast compared to control HEK cells while +DMT1 cells had obvious increased contrast consistent with their relative expression levels (b). The effect of DMT1 expression on T1 relaxation was quantified by measuring the Mn-dose dependent relaxation rate, R1 (=1/T1) for all cell lines (c). Without Mn supplementation all cell types had equivalent R1 values. The +DMT1 cell lines showed substantial increases in R1 up to 4-fold at 300μM MnCl2, consistent with the measured DMT1 expression levels. The −DMT1 cells showed a small but significant reduction in R1 at MnCl2 concentrations above 100μM. In an MTT assay, 300μM Mn supplementation had no effect on cell viability (d). Overexpression of DMT1 caused a small but significant reduction in the MTT absorbance measurement, but both control HEK and DMT1–1 cells were unaffected by supplementation with 300μM Mn.
To quantify the Mn-dose dependent effects of DMT1 expression in the HEK cell lines, we analyzed the relaxation rate, R1 (=1/T1), which is directly related to T1- weighted signal (Figure 2c). Without MnCl2 supplementation, there was no difference between cell lines, but even low levels of Mn (100μM) had a significant effect on R1. All cell lines showed some response to increasing levels of Mn, but naive HEK cells and the knockdown cell line were relatively insensitive compared to the +DMT1 cells, which demonstrated up to a 4-fold increase in R1 above control HEK cells in 300μM Mn. This substantial shift in R1 was consistent with a large increase in Mn uptake caused by DMT1 overexpression, as shown in previous studies (16).
To address the concern that these levels of Mn might cause cell toxicity, especially in the +DMT1 cells, an MTT proliferation assay (6) was performed. The assay quantitatively measures the enzymatic turnover of a substrate as an analog for cell proliferation, viability and metabolic rate, which can be affected by stress and cytotoxicity. The highest expressing +DMT1 HEK cell line (+DMT1–1), showed a 15% reduction in absorbance compared to naïve HEK cells. This shift was not due to Mn toxicity, since Mn supplementation had no obvious effect on cell proliferation in culture, and no effect on the MTT measurements in either the HEK or the +DMT1–1 cells (Figure 2d). The slower metabolic rate in the +DMT1–1 cells is more likely due to the burden of overexpression of DMT1 and/or eGFP (26). Membrane proteins are particularly known to slow metabolism at high levels of expression (27). Of note, selection for cell vitality has continued after the collection of these data, and MTT-detected viability differences have been subsequently eliminated in these cell lines. While it is uncontested that long term exposure to Mn can be toxic to cells, acute doses equivalent or higher to those used here have shown no toxicity, consistent with our results, and have even been proposed for therapeutic applications (28).
The fact that DMT1 expression can induce R1 increases 4-fold above control cells within 1h of Mn supplementation is a major advantage compared to even the most recently engineered Ferritin, which required 24h supplementation with 1mM Fe for a 1.8-fold increase in R2 (7), or Tyrosinase (a melanin-related enzyme), which required 96h in 250μM Fe to achieve a 1.4-fold increase in R1 (29,30). Taken together, these results indicated a high potential for DMT1 to be used as an MRI reporter in vivo.
DMT1 expression induces MRI contrast in diverse cell types, in vitro and in vivo
HEK cells in culture were convenient for initial testing because of their high levels of expression, but do not necessarily reflect physiological conditions where transgene levels can be quite limited and Mn exposure is not nearly so controlled. We therefore characterized DMT1 related MRI effects using two tumor cell lines: B16 melanoma (Figure 3), and GL261 glioma (Figure 4). Both cell lines are tumorigenic after implantation in C57Bl/6 mice, allowing comparisons under in vitro and in vivo conditions. Since in vivo MEMRI imaging typically begins 3 to 24 hours after systemic injection of MnCl2 (8,9), we also examined the long-term retention of Mn in each cell line to establish parameters for in vivo imaging.
Figure 3. MRI analysis of DMT1 expression in B16 cells, in vitro and in vivo.

In measurements of R1 vs Mn concentration of a 1h supplementation of MnCl2, DMT1 overexpression increased R1 up to 1.8-fold in +DMT1 compared to control B16 melanoma cells (a). In time course measurements from cells before (Pre) and after MnCl2 was removed (dotted line) (b). R1 differences disappeared within 4 hours. MEMRI images (2DGE) were acquired 3h after MnCl2 injection in mice with control (left) and +DMT1 (right) B16 melanomas. +DMT1 tumors had significantly higher signal than control B16 tumors in each mouse (n=3) (c).
Figure 4. MRI analysis of DMT1 expression in GL261 cells, in vitro and in vivo.
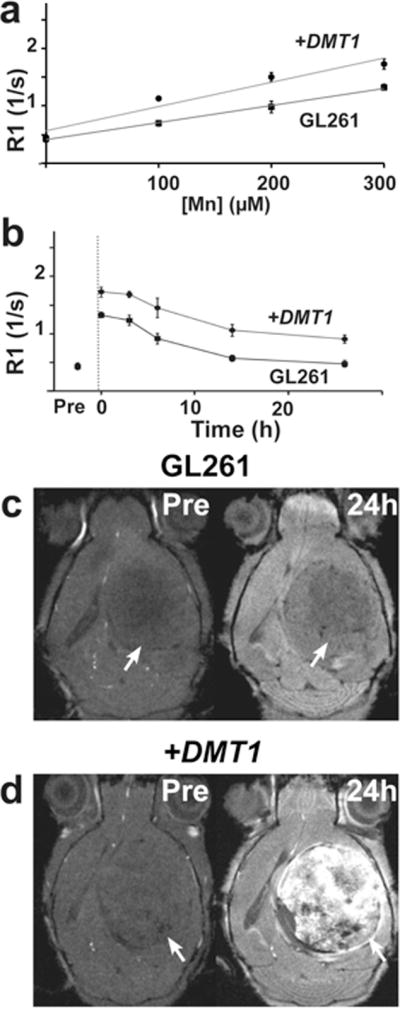
Increased DMT1 expression improved R1 with a maximal R1 gain of 1.6-fold, comparing +DMT1 and control GL261 cells (a). Time course R1 measurements of control and +DMT1 GL261 cells before (Pre) and after MnCl2 was removed (dotted line). Unlike the B16 cells, contrast between control and +DMT1 GL261 cells was maintained for over 24h (b). Control GL261 tumors showed initial negative contrast compared to surrounding tissue (Pre), which became more pronounced in MEMRI (2DGE) 24h after injection of MnCl2 (c). DMT1 expression did not alter the initial negative contrast in +DMT1 GL261 tumors (Pre), but Mn injection robustly enhanced +DMT1 tumors compared to adjacent brain tissue and control GL261 tumors (d).
Naive B16 cells showed a slightly higher response to increasing Mn levels than HEK cells (Figure 3a). Retroviral transfection of DMT1 into B16 cells generated a 1.4-fold overexpression of DMT1 (p=0.009, n=6), which resulted in a maximal 1.8-fold R1 increase in +DMT1 compared to control B16 cells (p<0.001, n=9; Figure 3a). Upon removal of Mn, R1 decreased rapidly for both control and +DMT1 B16 cells, returning to baseline levels within 4 hours (Figure 3b), suggesting that Mn was quickly excreted from B16 cells and that in vivo imaging would require minimal time between Mn injection and data collection. Mice were subcutaneously implanted with control and +DMT1 B16 melanoma cells on opposite flanks that grew into overt tumors, allowing for direct comparison of the two cell types in each mouse. R1 differences characterized in culture translated to a significant difference between in vivo T1-weighted MRI images of control and +DMT1 B16 tumors (+22 ± 9% contrast between +DMT1 and control B16 tumors: p=0.01, n=3; Figure 3c), acquired 3h after Mn administration via intraperitoneal (IP) injection of MnCl2. Consistent with the cell culture experiments, Mn-enhancement and contrast between +DMT1 and control B16 tumors was markedly reduced by 4h.
GL261 glioma cells were also investigated, using retroviral transfection to generate cells with maximal 1.3-fold overexpression of DMT1 (p=0.001, n=6). Similar to B16 cells, DMT1 overexpression in GL261 cells resulted in a 1.6-fold R1 increase after 1h supplementation with 300μM Mn (p<0.01, n=9; Figure 4a). Interestingly, GL261 cells demonstrated very different time-course characteristics compared to B16 cells. After the initial uptake of Mn, the R1 gain in +DMT1 relative to control GL261 cells persisted over more than 24h (Figure 4b). These cellular dynamics fit well into the 24h post Mn injection imaging paradigm used for many previous in vivo MEMRI studies (8,9).
After stereotaxic implantation into the brain, control and +DMT1 GL261 cells were allowed to grow into overt tumors (one per mouse). Before Mn-injection, control and +DMT1 GL261 tumors were both hypo-intense compared to adjacent brain tissue (−14 ± 4% contrast in controls vs −14 ± 6% in +DMT1 tumors, n=4 for each tumor type; Figures 4c, d). Images acquired 24h after Mn-injection showed minimal enhancement in control tumors, resulting in further hypo-intensity compared to adjacent brain tissue (−21 ± 15% contrast, n=4; Figure 4c), while +DMT1 tumors showed significant enhancement compared to adjacent brain tissue (+33 ± 13% contrast, n=4; Figure 4d). Comparing +DMT1 to control GL261 tumors, the overall gain in contrast was +75 ± 30% (p<0.001).
The substantial difference between the two tumor models points to an important area for future development of DMT1 as an MRI reporter. Despite slightly higher levels of expression and initial R1 gain of B16 over GL261 cells, +DMT1 B16 melanomas showed reduced in vivo contrast due to their relatively poor retention of Mn. The Mn retention of a cell or tissue type is readily measurable using standard MEMRI methods, and this property will be important to determine for each application. Of note, the long-term retention of Mn in neural tissues has been well characterized for MEMRI, enabling a wide variety of neuroimaging studies in the mouse brain, from fetal to adult stages (8,9,13,14,15,28,29).
Ectopic DMT1 expression induces MRI contrast in the developing mouse brain
To investigate the utility of the DMT1 reporter for studies of mouse brain development, we used in vivo electroporation of a bicistronic vector (DMT1-IRES-eGFP) to ectopically co-express DMT1 and eGFP in the neocortex. After electroporation at embryonic day (E)13.5 (21) or postnatal day (P)0 (22), mice were imaged with MEMRI at P1 or P5, respectively (Figure 5, 6), with Mn delivery to the pups via lactation after a single maternal IP injection of MnCl2 8h before imaging. The patterns and levels of enhancement following electroporation were more variable than in the tumor studies, but there was an obvious uniltateral enhanced region in each animal, as expected. Overall, E13.5 electroporation resulted in expression that was diffuse and somewhat dorsal (Figure 5), similar to previous reports of electroporation at this developmental stage (21). Expression of the plasmid was relatively low, with eGFP only detectable using immunostaining. Nevertheless, MEMRI contrast was clearly visible in each animal and statistically significant on quantitative analysis (+11% ± 4%; p<0.0001, n=3). P0 electroporation yielded more focal and lateral patterns of expression with greater intensity and variability, which was also highly significant on quantitative analysis (+26% ± 16%; p<0.0001, n=3) (Figure 6). In all cases there was a clear qualitative correlation between in vivo MEMRI enhancement (Figures 5a, 6a) and both DMT1 (Figures 5b; 6b,f) and eGFP (Figure 6e) expression, assessed in whole mount dissected brains and histological brain sections acquired immediately after imaging. The three-dimensional (3D) nature of MRI enabled volumetric rendering and segmentation of the enhanced regions using 3D analysis software (Figure 5c, 6d), making it easier to appreciate the full extent and pattern of each transfected region.
Figure 5. DMT1 expression correlateed with MEMRI signal in mice electroporated in utero.
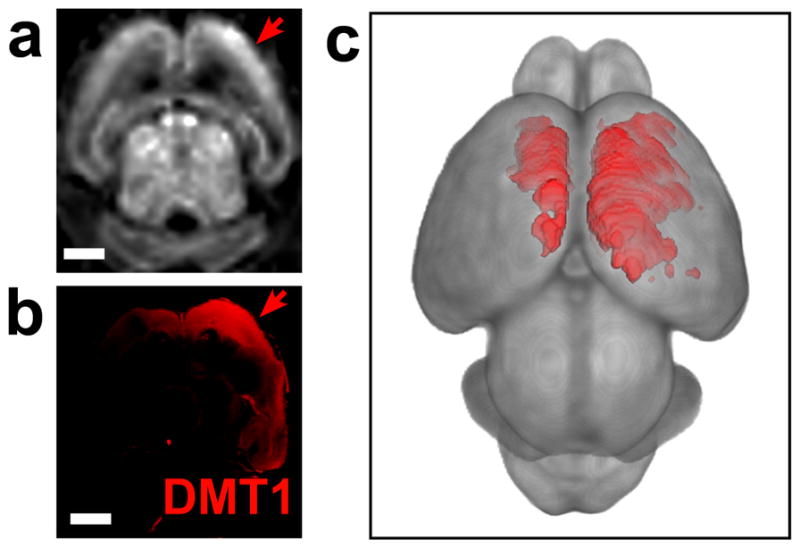
After electroporation at embryonic day (E)13.5 with DMT1-IRES-eGFP, in vivo MEMRI (3DGE with 150μm isotropic resolution) was performed at postnatal day (P)1, and brains were harvested for correlative histology (N=3). MEMRI showed largely unilateral patterns of dorsal cortical enhancement (a). Staining for DMT1 correlated well with the MEMRI enhancement patterns (b). Volumetric rendering of MEMRI data revealed the full 3D pattern of DMT1 expression (red = 1.5sd above the mean cortical signal intensity) (c). Scale bars = 0.5-mm.
Figure 6. Neonatal electroporation yielded focal patterns of correlated cortical DMT1 expression and MEMRI contrast.
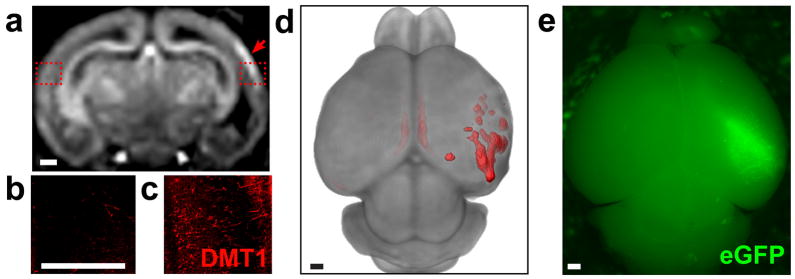
After electroporation at postnatal day (P)0 with DMT1-IRES-eGFP, in vivo MEMRI (3DGE with 150μm isotropic resolution) was performed at P5, and brains were harvested for correlative histology (n=3). MEMRI showed focal, unilateral regions of cortical enhancement (a). Immunohistochemistry for DMT1 on coronal sections matched to the MEMRI images showed minimal expression in the contralateral cortex (b) compared to high levels of DMT1 expression in the region of MEMRI enhancement (c). Volumetric rendering of MEMRI data clearly demonstrated the lateral, focal cortical DMT1 expression pattern (red = 1.5sd above the mean cortical signal intensity) (d). Direct fluorescence imaging of the P5 brains after dissection also revealed lateral eGFP fluorescence patterns in the cortex, correlated with the 3D rendering of MEMRI contrast (e). Scale bars = 0.5-mm (a–e).
DISCUSSION
These results clearly demonstrate how DMT1 expression, in combination with Mn supplementation, alters the T1-relaxation properties of a wide range of cell types, and creates readily visible signal enhancement in multiple in vivo models of expression and imaging with MEMRI. In all models, only a systemic dose of Mn was required through an IP injection to the adult mice or to nursing mothers for neonatal imaging. The two mouse tumor models demonstrate immediate applications in pre-clinical cancer imaging, and the electroporation studies demonstrate in vivo cell labeling and imaging of gene expression in the developing mouse brain.
There are several important areas for future development related to this new technology. Many tissues have some degree of endogenous Mn uptake, making optimization of signal to noise a challenge especially at low levels of DMT1 expression. This may be addressed through more advanced image analysis methods, in which 3D MRI data is volumetrically registered to a reference atlas for differential analysis (33). In this way, even very subtle changes in contrast could be mapped, allowing for 3D imaging that is both quantitative and sensitive. Other areas for development are in the pharmacodynamics of Mn and the transient nature of DMT1-induced signal enhancement. Uptake of Mn after IP injection is slower than after intravenous injection (31,14). Mn must be taken up by intestinal tissue, a process largely mediated by DMT1, and directed to the liver for dissemination via the circulatory system. Each tissue has it’s own uptake rate, which can allow absorption to occur quickly or slowly over several hours. In the nervous system, Mn delivery across the blood-brain-barrier (BBB) is much slower than delivery across the blood-cerebral spinal fluid barrier via the choroid plexus (14,34). Here we chose to use a single injection of MnCl2, but it is clear from the results that this requires model specific optimization of the imaging time post administration. In the examples of electroporation in the developing mouse brain, changing this period could change contrast in ways that must be more thoroughly explored before any information regarding biology could be considered valid. An alternative strategy could be delivery of Mn in multiple smaller doses (35) or in a continuous low dose to minimize time dependent differences in Mn retention (36). While the loss of Mn based contrast over time is an important variable to consider for future implementation, it should not be considered a weakness of this system. In the heart there is evidence that Mn-release depends on sodium (Na)/Ca exchangers (11), which may be an important starting point for future studies directed at establishing the molecular mechanisms underlying tissue-specific Mn-release. The dynamic effect of DMT1 on MEMRI contrast has advantages for longitudinal imaging in cases where rapid changes in expression occur. Our studies show a clear correlation between expression level and R1 and, even in cell lines that retain Mn, large changes in R1 can occur within hours. This is well within the time frame of changes in gene expression and compatible with the host of reporter assays already employed using bioluminescence (37). The additional spatial resolution afforded by MRI expands the utility of these assays to smaller populations of cells below the detectability or penetration depth of optical imaging. In terms of future applications, measuring changes in gene expression over the course of days is highly useful in studies of animal development where gene expression is generally accompanied by morphological changes. Image analysis methods applied to “DMT1-MEMRI” data can likely be used to parse and quantitatively analyze both phenomena simultaneously.
It is worth comparing DMT1-MEMRI to other candidate MRI reporter systems. As previously introduced, Ferritin has seen the most development, even to the point of having transgenic reporter mice available (5), yet biological applications have been slow to emerge. Even recent work with the protein showed that 60-fold overexpression and 24h of 1mM Fe supplementation (7) were required for significant contrast. These are demanding conditions to replicate in vivo compared to the expression and supplementation necessary for DMT1 based contrast. A direct comparison between DMT1 and Ferritin is not entirely fair however, because the two mechanisms of contrast enhancement are vastly different. Ferritin is a metal storage protein while DMT1 is a transporter. Transferrin receptor (TfR) and MagA, part of the bacterial magnetosome complex, are also transporters, though they are both specific for Fe and rely on the formation of an intracellular Fe-nanoparticle for MRI contrast (38,39). In both cases, cell culture experiments required 2 or more days of Fe supplementation for contrast detection (6,39). To date, the kinetics of Fe-clearance (switching off the contrast) has not been reported. While it is clear that Fe handling proteins can be used to generate contrast, limitations to the rate of accumulation and/or loss of contrast will likely be a feature of any Fe based system. The rapid onset and loss of Mn based contrast via DMT1 points to a very different set of applications from Fe proteins.
Finally, reporter systems have been proposed using extracellular agents which are activated enzymatically (40,24) or simply accumulated (38,41). In some cases, these methods are designed to reveal the presence of a traditional reporter protein, such as β-galactosidase (β-gal) (40,42), which has the advantage that many experimental systems and β-gal expressing reporter mice are already available. While sophisticated contrast-probes have been demonstrated for these purposes, including ligands that utilize Gd and/or 19F for MRI detection, the probes are generally macromolecular agents that have much more complicated issues of delivery to the cells/tissues of interest than the ionic Mn2+ required for the DMT1 reporter.
Taken together, our results demonstrate that the divalent metal transporter, DMT1 can be used as an effective reporter system in combination with MEMRI, providing positive signal enhancement in DMT1 expressing cells and tissues, with much higher sensitivity and faster switching times than previously proposed MRI reporters. These advances should now make it possible to access the power of mouse genetics and molecular imaging with the full 3D and in vivo capabilities of MRI.
Acknowledgments
This work was supported by NIH grant R01 NS038461 (to DHT) and the NIH/NYU GPP program for Structural Biology (to BBB). MRI was performed in the Mouse Imaging Core at NYUSOM, which was partially supported by the NYU Cancer Center Support Grant (NIH P30 CA0016087). We thank Anne Friedland (NYUSOM) for technical contributions during the early stages of this research, and Dr. Songhai Shi (Sloan-Kettering Institute, SKI) for advice and instruction on electroporation methods. We also thank Dr. Laura Garrick (SUNY at Buffalo) for providing +DMT1 cell lines used in early studies, and Dr. Philippe Gros (McGill University) for providing the DMT1 DNA used to generate the constructs for these studies. Finally we thank Dr. Alexandra Joyner (SKI) and Dr. Alan Jasanoff (MIT) for critical review of the manuscript.
References
- 1.Nieman BJ, Bishop J, Dazai J, Bock NA, Lerch JP, Feintuch A, Chen XJ, Sled JG, Henkelman RM. MR Technology for Biological Studies in Mice. NMR Biomed. 2007;20:291–303. doi: 10.1002/nbm.1142. [DOI] [PubMed] [Google Scholar]
- 2.Gilad AA, Winnard PT, Jr, van Zijl PCM, Bulte JWM. Developing MR Reporter Genes: Promises and Pitfalls. NMR Biomed. 2007;20:275–290. doi: 10.1002/nbm.1134. [DOI] [PubMed] [Google Scholar]
- 3.Gilad AA, McMahon MT, Walczak P, Winnard PT, Raman V, van Laarhoven HWM, Skoglund CM, Bulte JWM, van Zijl PCM. Artificial Reporter Gene Providing MRI Contrast Based on Proton Exchange. Nat Biotech. 2007;25:217–219. doi: 10.1038/nbt1277. [DOI] [PubMed] [Google Scholar]
- 4.Genove G, DeMarco U, Xu H, Goins WF, Ahrens ET. A New Transgene Reporter for in Vivo Magnetic Resonance Imaging. Nat Med. 2005;11:450–454. doi: 10.1038/nm1208. [DOI] [PubMed] [Google Scholar]
- 5.Cohen B, Ziv K, Plaks V, Israely T, Kalchenko V, Harmelin A, Benjamin LE, Neeman M. MRI Detection of Transcriptional Regulation of Gene Expression in Transgenic Mice. Nat Med. 2007;13:498–503. doi: 10.1038/nm1497. [DOI] [PubMed] [Google Scholar]
- 6.Deans AE, Wadghiri YZ, Bernas LM, Yu X, Rutt BK, Turnbull DH. Cellular MRI Contrast via Coexpression of Transferrin Receptor and Ferritin. Magn Reson Med. 2006;56:51–59. doi: 10.1002/mrm.20914. [DOI] [PMC free article] [PubMed] [Google Scholar]
- 7.Iordanova B, Robison CS, Ahrens ET. Design and Characterization of a Chimeric Ferritin with Enhanced Iron Loading and Transverse NMR Relaxation Rate. J Biol Inorg Chem. 2010;15:957–965. doi: 10.1007/s00775-010-0657-7. [DOI] [PMC free article] [PubMed] [Google Scholar]
- 8.Silva AC, Lee JH, Aoki I, Koretsky AP. Manganese-enhanced Magnetic Resonance Imaging (MEMRI): Methodological and Practical Considerations. NMR Biomed. 2004;17:532–543. doi: 10.1002/nbm.945. [DOI] [PubMed] [Google Scholar]
- 9.Pautler RG. Biological Applications of Manganese-enhanced Magnetic Resonance Imaging. Methods Mol Med. 2006;124:365–386. doi: 10.1385/1-59745-010-3:365. [DOI] [PubMed] [Google Scholar]
- 10.Narita K, Kawasaki F, Kita H. Mn and Mg Influxes Through Ca Channels of Motor Nerve Terminals Are Prevented by Verapamil in Frogs. Brain Research. 1990;510:289–295. doi: 10.1016/0006-8993(90)91379-u. [DOI] [PubMed] [Google Scholar]
- 11.Hu TC, Pautler RG, MacGowan GA, Koretsky AP. Manganese-enhanced MRI of Mouse Heart During Changes in Inotropy. Magn Reson Med. 2001;46:884–890. doi: 10.1002/mrm.1273. [DOI] [PubMed] [Google Scholar]
- 12.Lin YJ, Koretsky AP. Manganese Ion Enhances T1-weighted MRI During Brain Activation: An Approach to Direct Imaging of Brain Function. Magn Reson Med. 1997;38:378–388. doi: 10.1002/mrm.1910380305. [DOI] [PubMed] [Google Scholar]
- 13.Pautler RG, Silva AC, Koretsky AP. In Vivo Neuronal Tract Tracing Using Manganese-enhanced Magnetic Resonance Imaging. Magn Reson Med. 1998;40:740–748. doi: 10.1002/mrm.1910400515. [DOI] [PubMed] [Google Scholar]
- 14.Aoki I, Wu Y-JL, Silva AC, Lynch RM, Koretsky AP. In Vivo Detection of Neuroarchitecture in the Rodent Brain Using Manganese-enhanced MRI. NeuroImage. 2004;22:1046–1059. doi: 10.1016/j.neuroimage.2004.03.031. [DOI] [PubMed] [Google Scholar]
- 15.Yu X, Wadghiri YZ, Sanes DH, Turnbull DH. In Vivo Auditory Brain Mapping in Mice with Mn-enhanced MRI. Nat Neurosci. 2005;8:961–968. doi: 10.1038/nn1477. [DOI] [PMC free article] [PubMed] [Google Scholar]
- 16.Garrick MD, Kuo H-C, Vargas F, Singleton S, Zhao L, Smith JJ, Paradkar P, Roth JA, Garrick LM. Comparison of Mammalian Cell Lines Expressing Distinct Isoforms of Divalent Metal Transporter 1 in a Tetracycline-regulated Fashion. Biochem J. 2006;398:539. doi: 10.1042/BJ20051987. [DOI] [PMC free article] [PubMed] [Google Scholar]
- 17.Bai SP, Lu L, Luo XG, Liu B. Kinetics of Manganese Absorption in Ligated Small Intestinal Segments of Broilers. Poult Sci. 2008;87:2596–2604. doi: 10.3382/ps.2008-00117. [DOI] [PubMed] [Google Scholar]
- 18.Lam-Yuk-Tseung S, Gros P. Distinct Targeting and Recycling Properties of Two Isoforms of the Iron Transporter DMT1 (NRAMP2, Slc11A2) Biochemistry. 2006;45:2294–2301. doi: 10.1021/bi052307m. [DOI] [PubMed] [Google Scholar]
- 19.Gaiano N, Kohtz JD, Turnbull DH, Fishell G. A Method for Rapid Gain-of-function Studies in the Mouse Embryonic Nervous System. Nat Neurosci. 1999;2:812–819. doi: 10.1038/12186. [DOI] [PubMed] [Google Scholar]
- 20.Cha S, Johnson G, Wadghiri YZ, Jin O, Babb J, Zagzag D, Turnbull DH. Dynamic, Contrast-enhanced Perfusion MRI in Mouse Gliomas: Correlation with Histopathology. Magn Reson Med. 2003;49:848–855. doi: 10.1002/mrm.10446. [DOI] [PubMed] [Google Scholar]
- 21.Saito T. Embryonic in Vivo Electroporation in the Mouse. Meth Enzymol. 2010;477:37–50. doi: 10.1016/S0076-6879(10)77003-8. [DOI] [PubMed] [Google Scholar]
- 22.Boutin C, Diestel S, Desoeuvre A, Tiveron M-C, Cremer H. Efficient in Vivo Electroporation of the Postnatal Rodent Forebrain. PLoS ONE. 2008;3:e1883. doi: 10.1371/journal.pone.0001883. [DOI] [PMC free article] [PubMed] [Google Scholar]
- 23.Lam-Yuk-Tseung S, Touret N, Grinstein S, Gros P. Carboxyl-terminus Determinants of the Iron Transporter DMT1/SLC11A2 Isoform II (-IRE/1B) Mediate Internalization from the Plasma Membrane into Recycling Endosomes. Biochemistry. 2005;44:12149–12159. doi: 10.1021/bi050911r. [DOI] [PubMed] [Google Scholar]
- 24.Westmeyer GG, Durocher Y, Jasanoff A. A Secreted Enzyme Reporter System for MRI. Angew Chem Int Ed Engl. 2010;49:3909–3911. doi: 10.1002/anie.200906712. [DOI] [PMC free article] [PubMed] [Google Scholar]
- 25.Strauch RC, Mastarone DJ, Sukerkar PA, Song Y, Ipsaro JJ, Meade TJ. Reporter Protein-Targeted Probes for Magnetic Resonance Imaging. Journal of the American Chemical Society. 2011 doi: 10.1021/ja206134b. [DOI] [PMC free article] [PubMed] [Google Scholar]
- 26.Tiffen JC, Bailey CG, Ng C, Rasko JEJ, Holst J. Luciferase Expression and Bioluminescence Does Not Affect Tumor Cell Growth in Vitro or in Vivo. Mol Cancer. 2010;9:299. doi: 10.1186/1476-4598-9-299. [DOI] [PMC free article] [PubMed] [Google Scholar]
- 27.Thomas P, Smart TG. HEK293 Cell Line: a Vehicle for the Expression of Recombinant Proteins. J Pharmacol Toxicol Methods. 2005;51:187–200. doi: 10.1016/j.vascn.2004.08.014. [DOI] [PubMed] [Google Scholar]
- 28.Mukhopadhyay S, Linstedt AD. Manganese Blocks Intracellular Trafficking of Shiga Toxin and Protects Against Shiga Toxicosis. Science. 2012;335:332–335. doi: 10.1126/science.1215930. [DOI] [PMC free article] [PubMed] [Google Scholar]
- 29.Paproski RJ, Forbrich AE, Wachowicz K, Hitt MM, Zemp RJ. Tyrosinase as a Dual Reporter Gene for Both Photoacoustic and Magnetic Resonance Imaging. Biomed Opt Express. 2011;2:771–780. doi: 10.1364/BOE.2.000771. [DOI] [PMC free article] [PubMed] [Google Scholar]
- 30.Weissleder R, Simonova M, Bogdanova A, Bredow S, Enochs WS, Bogdanov A. MR Imaging and Scintigraphy of Gene Expression Through Melanin Induction. Radiology. 1997;204:425–429. doi: 10.1148/radiology.204.2.9240530. [DOI] [PubMed] [Google Scholar]
- 31.Wadghiri YZ, Blind JA, Duan X, Moreno C, Yu X, Joyner AL, Turnbull DH. Manganese-enhanced Magnetic Resonance Imaging (MEMRI) of Mouse Brain Development. NMR Biomed. 2004;17:613–619. doi: 10.1002/nbm.932. [DOI] [PubMed] [Google Scholar]
- 32.Deans AE, Wadghiri YZ, Berrios-Otero CA, Turnbull DH. Mn Enhancement and Respiratory Gating for in Utero MRI of the Embryonic Mouse Central Nervous System. Magn Reson Med. 2008;59:1320–1328. doi: 10.1002/mrm.21609. [DOI] [PMC free article] [PubMed] [Google Scholar]
- 33.Dorr AE, Lerch JP, Spring S, Kabani N, Henkelman RM. High Resolution Three-dimensional Brain Atlas Using an Average Magnetic Resonance Image of 40 Adult C57Bl/6J Mice. Neuroimage. 2008;42:60–69. doi: 10.1016/j.neuroimage.2008.03.037. [DOI] [PubMed] [Google Scholar]
- 34.Zheng W, Aschner M, Ghersi-Egea J-F. Brain Barrier Systems: a New Frontier in Metal Neurotoxicological Research. Toxicol Appl Pharmacol. 2003;192:1–11. doi: 10.1016/s0041-008x(03)00251-5. [DOI] [PMC free article] [PubMed] [Google Scholar]
- 35.Bock NA, Paiva FF, Silva AC. Fractionated Manganese-enhanced MRI. NMR Biomed. 2008;21:473–478. doi: 10.1002/nbm.1211. [DOI] [PMC free article] [PubMed] [Google Scholar]
- 36.Mok SI, Munasinghe JP, Young WS. Infusion-based Manganese-enhanced MRI: a New Imaging Technique to Visualize the Mouse Brain. Brain Struct Funct. 2012;217:107–114. doi: 10.1007/s00429-011-0324-y. [DOI] [PMC free article] [PubMed] [Google Scholar]
- 37.Prescher JA, Contag CH. Guided by the Light: Visualizing Biomolecular Processes in Living Animals with Bioluminescence. Curr Opin Chem Biol. 2010;14:80–89. doi: 10.1016/j.cbpa.2009.11.001. [DOI] [PubMed] [Google Scholar]
- 38.Moore A, Basilion JP, Chiocca EA, Weissleder R. Measuring Transferrin Receptor Gene Expression by NMR Imaging. Biochim Biophys Acta. 1998;1402:239–249. doi: 10.1016/s0167-4889(98)00002-0. [DOI] [PubMed] [Google Scholar]
- 39.Zurkiya O, Chan AWS, Hu X. MagA Is Sufficient for Producing Magnetic Nanoparticles in Mammalian Cells, Making It an MRI Reporter. Magn Reson Med. 2008;59:1225–1231. doi: 10.1002/mrm.21606. [DOI] [PMC free article] [PubMed] [Google Scholar]
- 40.Louie AY, Huber MM, Ahrens ET, Rothbacher U, Moats R, Jacobs RE, Fraser SE, Meade TJ. In Vivo Visualization of Gene Expression Using Magnetic Resonance Imaging. Nat Biotech. 2000;18:321–325. doi: 10.1038/73780. [DOI] [PubMed] [Google Scholar]
- 41.Bartelle BB, Berríos-Otero CA, Rodriguez JJ, Friedland AE, Aristizábal O, Turnbull DH. Novel Genetic Approach for in Vivo Vascular Imaging in Mice. Circ Res. 2012;110:938–947. doi: 10.1161/CIRCRESAHA.111.254375. [DOI] [PMC free article] [PubMed] [Google Scholar]
- 42.Yu J-X, Kodibagkar VD, Hallac RR, Liu L, Mason RP. Dual 19F/1H MR Gene Reporter Molecules for in Vivo Detection of B-galactosidase. Bioconjug Chem. 2012;23:596–603. doi: 10.1021/bc200647q. [DOI] [PMC free article] [PubMed] [Google Scholar]