Abstract
Objectives
It is well accepted that collimation is a cost-effective dose-reducing tool for X-ray examinations. This phantom-based study investigated the impact of X-ray beam collimation on radiation dose to the lenses of the eyes and thyroid along with the effect on image quality in facial bone radiography.
Methods
A three-view series (occipitomental, occipitomental 30 and lateral) was investigated, and radiation doses to the lenses and thyroid were measured using an Unfors dosemeter. Images were assessed by six experienced observers using a visual grading analysis and a total of 5400 observations were made.
Results
Strict collimation significantly (p<0.0001) reduced the radiation dose to the lenses of the eyes and thyroid when using a fixed projection-specific exposure. With a variable exposure technique (fixed exit dose, to simulate the behaviour of an automatic exposure control), while strict collimation was again shown to reduce thyroid dose, higher lens doses were demonstrated when compared with larger fields of exposure. Image quality was found to significantly improve using strict collimation, with observer preference being demonstrated using visual grading characteristic curves.
Conclusion
The complexities of optimising radiographic techniques have been shown and the data presented emphasise the importance of examining dose-reducing strategies in a comprehensive way.
Recent reports state that over 1 million X-ray examinations of the skull and facial bones are performed in the UK [1,2] alone each year. While this number is declining in line with the increasing availability of CT, a large number of facial bone examinations continue to be performed. It is important therefore to ensure that technique is optimised to ensure that the radiation dose delivered to the patient is kept as low as reasonably achievable (ALARA) [3]. Organs lying within the field—namely, the lenses of the eyes and the thyroid—have been highlighted in scientific documentation [3-5] as structures particularly sensitive to radiation. Of particular importance is a statement made in the current Annals of the International Commission on Radiological Protection, ICRP 103, which states that “there is an unknown nature as to the true sensitivity of the lens of the eye” [3]. In addition, organs and tissues lying outside the field of interest may also be susceptible to secondary radiation such as breast tissue, the sensitivity of which has been emphasised in the latest International Commission on Radiological Protection recommendations [3].
Effective X-ray beam collimation is one of a number of ways to reduce radiation dose [6-11]. Current literature suggests that by limiting the field size of the beam, less material is interacting with the primary beam, thus reducing the likelihood of secondary scatter radiation arising from beam interactions within and outside of the patient [12-14]. Improvements in image quality have been reported due to reducing secondary scatter radiation [12,13]. This phantom-based study will examine the relationship between varying levels of collimation and radiation dose, along with image quality of radiographic facial bone projections. In particular, this work will focus on radiation doses received by the lenses of the eyes and the thyroid in relation to the extent of collimation.
Methods and materials
Image acquisition
The images for this study were acquired using a Shimadzu ED-125L (Shimadzu Corporation, Kyoto, Japan). An Agfa CR MD40 general cassette (Agfa Healthcare, Peissenberg, Germany) image receptor with a maximum imaging area of 24×30 cm was used. The images were processed using an Agfa ADC Solo CR Reader (Agfa Healthcare) with the Agfa Multi-Scale Image Contrast Amplification 1 (MUSICA 1) processing software (Agfa Healthcare) using the NK5 skull algorithm. Quality assurance was performed on the X-ray unit to ensure that the unit was operating within acceptable limits (tube potential and tube output accuracy within 5%; timer accuracy within 5%; collimator accuracy within 1% of the permissible error). The coefficient of variance for all tests was 0.01 [15].
A Kyoto Kagaku tissue-equivalent anthropomorphic phantom of the head and thorax (Kyoto Kagaku Co. Ltd, Kyoto, Japan) was positioned for occipitomental (OM), OM with 30° caudal beam angle (OM 30) and lateral (left) facial bones in accordance with well-established procedures [10,16]. For each projection the beam was centred to the image receptor. A focus to detector distance of 100 cm and a secondary radiation grid (ratio 12:1; 40 line pairs cm–1; focal distance 100 cm) was employed.
Collimation
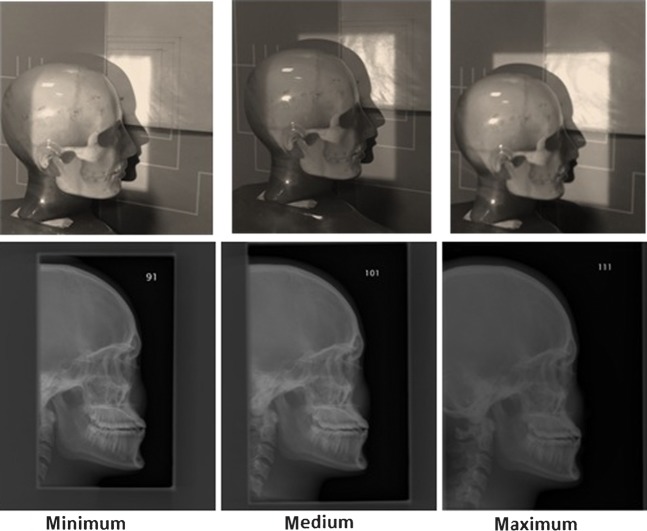
To investigate the effect of X-ray beam collimation in this study, three different radiation field sizes were used in the study. These levels were applied in relation to the different projections and were defined as:
minimum (strict) collimation: smallest exposed area required to demonstrate the inclusion criteria
medium collimation: midway between minimum collimation and maximum collimation
maximum collimation: largest exposed area (i.e. equal to the area of the image receptor).
These are demonstrated in Figure 1. Regardless of the level of collimation used, all the images were required to meet a set of criteria to be included in the study. The inclusion criteria are demonstrated in Table 1.
Figure 1.
Three different collimation levels and the resultant images.
Table 1. Inclusion criteria.
| Projection | Inclusion criteria |
| OM | Nasal septum equidistant to the lateral borders of the skull |
| Symmetrical representation of the orbital rims | |
| Petrous ridge inferior to the maxillary sinus | |
| OM 30° | Symmetrical representation of the orbits |
| Nasal septum equidistant to the lateral borders of the skull | |
| Lateral | Superimposition of the mandibular rami |
| Superimposition of the orbital roofs and greater wings of sphenoid | |
| Inclusion of external auditory meatus and frontal sinus |
OM, occipitomental; OM 30°, occipitomental with 30° caudal beam angle.
Exposure selection
Constant beam energies of 72, 72 and 65 kVp were used for the OM, OM 30 and lateral projections, respectively. Two groups of beam intensities or currents were chosen. The first, known as fixed, kept the exposure constant for all projection-specific exposures; the second, known as variable, varied the current so that the exit doses for each projection across all collimations remained within 10% of each other, thus simulating the behaviour of an automatic exposure control (AEC), which was unavailable for this study. This was performed by placing the calibrated dosemeter at a position where the AEC chamber would have been located (i.e. between the secondary radiation grid and the CR plate). Exposure factors are demonstrated in Tables 2 and 3. For each level of collimation and corresponding exposure setting the phantom was exposed 10 times.
Table 2. Fixed exposure factors.
| Projection | Tube potential (kVp) | Current (mA) | Time (s) |
| OM | 72 | 300 | 0.2 |
| OM 30 | 72 | 300 | 0.2 |
| Lateral | 65 | 300 | 0.12 |
OM, occipitomental; OM 30, occipitomental with 30° caudal beam angle.
Table 3. Variable exposure factors.
| Projection | Collimation level | Tube potential (kVp) | Current (mA) | Time (s) |
| OM | Minimum | 72 | 300 | 0.2 |
| Medium | 0.1 | |||
| Maximum | 0.08 | |||
| OM 30 | Minimum | 72 | 300 | 0.2 |
| Medium | 0.12 | |||
| Maximum | 0.1 | |||
| Lateral | Minimum | 65 | 300 | 0.12 |
| Medium | 0.1 | |||
| Maximum | 0.08 |
OM, occipitomental; OM 30, occipitomental with 30° caudal beam angle.
Dosimetry
A calibrated Unfors Mult-o-Meter Type 532 dosemeter (Unfors, Billdal, Sweden) was used to measure the radiation dose received by the thyroid and lenses of the eyes. The meter is sensitive up to 1% of 1 Sv s–1. The meter was consistently placed so the detector was facing the X-ray tube at 90° to the direction of the central beam. While the detector was clearly bigger that the structure it was measuring (e.g. the eye lens), it was centred and placed as close as possible to the structure location. Position and placement of the dosemeter was clearly marked on the phantom to ensure reproducibility of all results.
Image quality assessment
The image quality was assessed using a visual grading analysis (VGA), where an image evaluation panel consisting of six imaging personnel, each with a minimum of 5 years of experience in facial bone radiography, were asked to evaluate each image. Each panel member was asked to rate how well they could visualise each criterion in Table 4 when compared with a single projection-specific reference image (which demonstrated all relevant anatomical criteria) and then asked to score each criterion using the four-point scale:
Table 4. Assessment criteria.
| Projection | Assessment criteria |
| OM | Supraorbital margin |
| Nasal septum | |
| Zygomatic arches | |
| Coronoid process of the mandible | |
| Mastoid air cell pattern | |
| OM 30° | Inferior orbital margin |
| Lateral wall of maxillary sinus | |
| Perpendicular plate of ethmoid | |
| Coronoid process of the mandible | |
| Alveolar margins of the incisors | |
| Lateral | Diploic space (superior to the frontal sinus) |
| Posterior clinoid process | |
| Horizontal plate of palatine bone | |
| Anterior nasal spine | |
| Maxillary sinus |
OM, occipitomental; OM 30, occipitomental with 30° caudal beam angle.
unacceptable (unable to visualise)
can be seen but not as good as the reference image
equal to the reference image
better than the reference image.
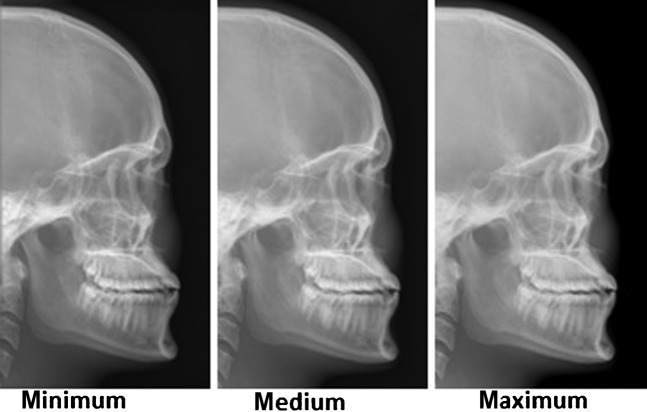
The scores from each criterion were then summed to obtain a total image score. 60 images of each projection (3 collimations×2 types of exposure×10 images) were shown to the panel. The images shown to the panel were all cropped to conceal the exposed area of each image from the panel members, to ensure they were unaware of the collimation level used, as demonstrated in Figure 2.
Figure 2.
Example images presented to the panel of the three different collimation levels.
To evaluate the images, VGAssist 2010 software (Vizova Technologies, Dublin, Ireland) was used, which had no impact on the spatial or contrast resolution of the original image. This program allowed observers to easily move between images and readily alter the window levels to potentially improve the appearance of the image. The test images were displayed using a greyscale standard display function (GSDF) calibrated monitor with an Nvidia GeForceGo 7600GT (Nvidia Corporation, Santa Clara, CA) graphics card and screen resolution set to 1920×1200 pixels. The reference images were also displayed using the VGAssist software and an HP L1740 (Hewlett Packard Development Company, Palo Alto, CA) LCD monitor with a NVIDA Quadro FX560 graphics card and a screen resolution of 1280×1024 pixels. Ambient lighting was set to 33 lux measured using a self-calibrated Konica Minolta Chromometer CL200 (Konica Minolta Sensing Inc., Osaka, Japan) for all viewings.
Data analysis
Statistical analyses were performed on the doses and image-quality scores. Comparisons were made for each projection between levels of collimation using a one-way analysis of variance (ANOVA). A p-value of <0.05 was used for all comparisons.
The image-quality scores obtained from the VGA were used to produce visual grading characteristic (VGC) curves. The VGC curves were produced using a technique similar to an ROC analysis where, for a single comparison (a pair of collimations), all the images with the maximum score are extracted and collimation preference determined. Then all the images with the maximum score and next highest score are extracted and again preference is determined. This process was then repeated for all scores and a VGC curve generated, where the direction of the curve tends to the axis preferred by the viewer. This methodology allowed for the visual comparison of each collimation pair [17].
Results
Significant changes were seen for radiation dose and image-quality scores between collimation levels.
Thyroid dose
The mean radiation dose to the thyroid was increased as the collimation increased from minimum collimation to maximum collimation, with each collimation level demonstrating a significant difference from each other collimation level (p<0.0001). There was one exception to this: OM 30 variable exposure between medium and maximum collimation. Table 5 demonstrates the mean dose values for both fixed and variable exposure.
Table 5. Thyroid mean dose values (μGy) with standard deviation in parentheses for each projection and collimation level.
| Exposure | Projection | Minimum | Medium | Maximum |
| Fixed exposure | ||||
| OM | 0 (0) | 14.26 (0.19) | 19.46 (0.14) | |
| OM 30 | 0 (0) | 2.97 (2.47) | 6.25 (0.06) | |
| Lateral | 13.62 (0.07) | 26.17 (0.19) | 68.98 (2.52) | |
| Variable exposure | ||||
| OM | 0 (0) | 6.062 (0.32) | 8.06 (0.07) | |
| OM 30 | 0 (0) | 3.589 (0.23) | 3.005 (0.16) | |
| Lateral | 9.96 (0.07) | 10.85 (0.66) | 16.35 (0.27) |
OM, occipitomental; OM 30, occipitomental with 30° caudal beam angle.
Lens dose
The radiation dose to the lenses of the eyes was increased with maximum collimation compared with minimum collimation when using a fixed exposure. The use of a variable exposure generally shows a significant reduction in the radiation dose to the lenses of the eyes with maximum collimation levels when compared with both medium and minimum levels. Significance levels and mean dose values are shown in Table 6.
Table 6. Mean lens dose values (μGy) with standard deviation in parentheses for each projection and collimation level.
| Exposure | Projection | Minimum | Medium | Maximum | p-value | |
| Fixed exposure | ||||||
| OM | 22.61 (1.38) | 23.61 (1.07) | 25.21 (0.28) | <0.001a | ||
| <0.0001b,c | ||||||
| OM 30 | 44.75 (1.43) | 49.96 (1.24) | 48.79 (1.43) | <0.0001a,b | ||
| Lateral | Left lens | 521 (2.52) | 552 (2.55) | 546.7 (24.91) | <0.0001a,b | |
| Right lens | 838 (8.15) | 875.3 (2.04) | 817.3 (5.34) | <0.0001a | ||
| <0.001b | ||||||
| Variable exposure | ||||||
| OM | 22.57 (0.77) | 12.28 (0.29) | 10.39 (0.66) | <0.0001a,b,c | ||
| OM 30 | 46.48 (0.91) | 27.29 (0.63) | 24.79 (1.57) | <0.0001a,b,c | ||
| Lateral | Left lens | 568.9 (2.08) | 368.5 (11.49) | 284.3 (0.95) | <0.0001a,b,c | |
| Right lens | 745.5 (1.42) | 683.6 (1.20) | 548.4 (5.12) | <0.0001a,b,c | ||
OM, occipitomental; OM 30, occipitomental with 30° caudal beam angle.
p-values are shown wherever there is a significant difference between collimation levels.
aMinimum was different to medium.
bMinimum was different to maximum.
cMedium was different to maximum.
Image quality
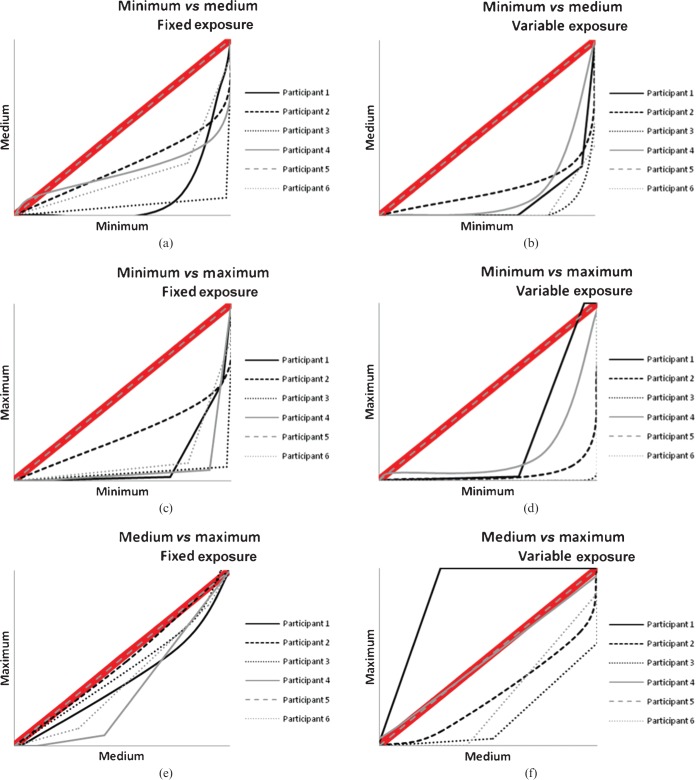
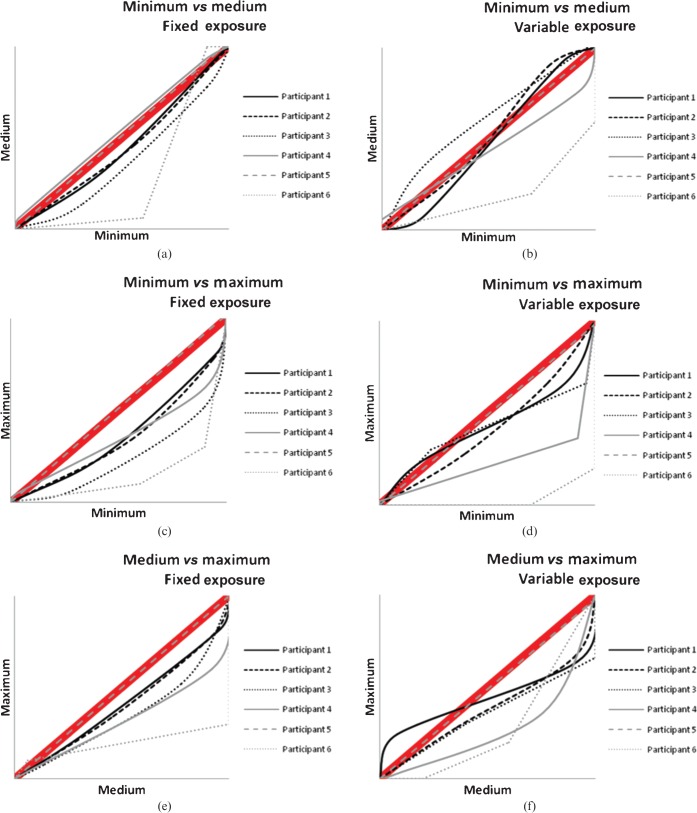
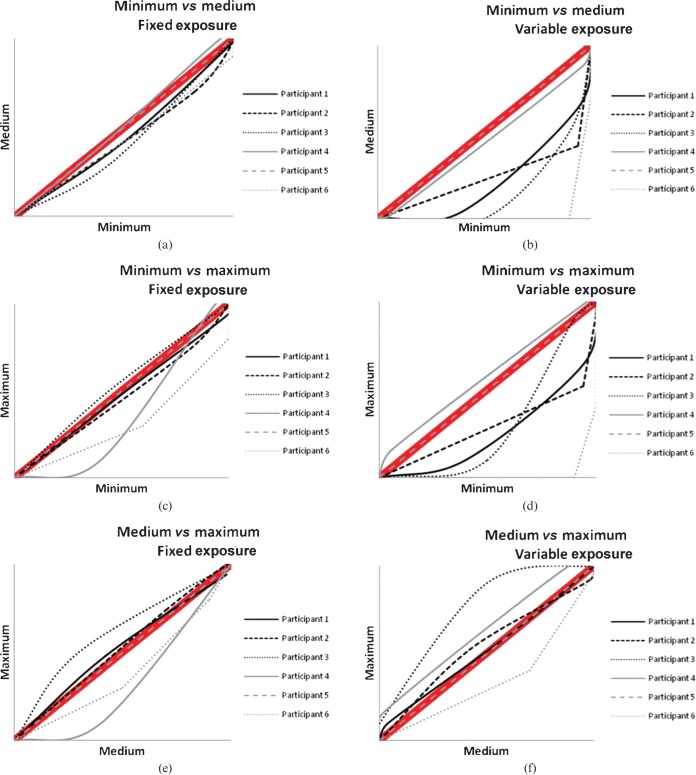
Image quality was shown to improve with minimum collimation across all projections when compared with the other collimation levels. Table 7 shows the mean image-quality scores with the standard deviation and corresponding p-values. The VGC curves (Figures 3–5) demonstrate most of the panel's preference for the lower collimation level across all projections and exposures. When a curve generally lies below the 45° diagonal shown in the thick red line in the graphs, this suggests a preference for the collimation level described on the x-axis. If the curve is generally above the 45° diagonal, a preference is shown for the collimation listed for the y-axis.
Table 7. Mean image-quality scores with standard deviation in parentheses for each projection and collimation level.
| Exposure | Projection | Minimum | Medium | Maximum | p-value |
| Fixed exposure | |||||
| OM | 17.78 (2.56) | 14.88 (2.9) | 13.93 (2.8) | <0.0001a,b | |
| OM 30 | 16.95 (2.30) | 16.52 (2.27) | 16.55 (2.58) | <0.0001a,b,c | |
| Lateral | 16.25 (2.47) | 15.98 (2.24) | 13.83 (2.88) | <0.0001b,c | |
| Variable exposure | |||||
| OM | 17.37 (2.79) | 12.95 (2.6) | 11.13 (2.8) | <0.0001a,b,c | |
| OM 30 | 17.17 (2.65) | 14.32 (2.21) | 13.92 (2.87) | <0.0001a,b | |
| Lateral | 15.87 (2.32) | 15.23 (2.27) | 13.55 (2.7) | <0.0001b,c |
OM, occipitomental; OM 30, occipitomental with 30° caudal beam angle.
p-values are shown wherever there is a significant difference between collimation levels.
aMinimum was different to medium.
bMinimum was different to maximum.
cMedium was different to maximum.
Figure 3.
Visual grading characteristic curves for occipitomental projection plotting each collimation level with each other for the (a, c, e) fixed and (b, d, f) variable exposures.
Figure 5.
Visual grading characteristic curves for lateral projection plotting each collimation level with each other for the (a, c, e) fixed and (b, d, f) variable exposures.
Figure 4.
Visual grading characteristic curves for occipitomental with 30° caudal beam angle projection plotting each collimation level with each other for the (a, c, e) fixed and (b, d, f) variable exposures.
Discussion
This study has found that strict levels (minimum) of collimation significantly improve image quality in facial bone radiography, regardless of whether the exposure is fixed or variable, and that mean image-quality scores for all projections were significantly higher with the minimum level of collimation compared with the maximum exposed field. Table 7 shows the image-quality scores and it is interesting to note that if a score of 10 represents acceptability (as demonstrated in the scoring criteria used in the study), scores for all projections and all collimation levels were considered acceptable by the evaluation panel. The data were used to produce VGC curves (Figures 3–5), which had been previously introduced by Bath and Masson [17]. To date, this type of presentation of VGA-derived data has not been extensively utilised; however, the current work shows its usefulness in visually demonstrating strong observer preference for the lower collimation level.
As the radiation field size increases, the dose to the thyroid is seen to increase for all projections compared with smaller fields, as demonstrated in Table 5. With strict collimation, the dose to the thyroid can be reduced to zero in both the OM and OM 30 projections, which is probably due to the thyroid not being situated within the radiation field when small exposure fields are used.
The effect of collimation on the radiation dose to the lenses of the eyes has been found to be dependent on the type of exposure being used. Strict collimation when using a fixed exposure across all field sizes shows a significant decrease in the dose to the lenses of the eyes (Table 6). In contrast, the variable exposure, which was designed to simulate the effect of an AEC (constant exit dose), demonstrated a significant increase in the dose delivered to the lens with a smaller irradiated field. This is probably due to a smaller field producing less scatter radiation, therefore requiring a greater exposure to acquire a similar exit dose. This finding could potentially have greater implications beyond facial bone radiography and demonstrates the importance of not assuming that strict levels of collimation will automatically reduce dose to radiosensitive organs compared with larger fields of exposure.
In terms of implementation, collimation is a cost-effective and easily implementable tool that can be applied each time a patient is X-rayed. Nonetheless, accurate collimation requires substantial radiographic skill and experience, coupled with a detailed understanding of surface anatomy, otherwise excessive restriction of the radiation field can lead to the exclusion of important anatomical structures necessitating repeat exposures and extra patient radiation dose.
There were some limitations that need to be acknowledged. The equipment used in this study did not have an AEC. To compensate for this, we simulated the behaviour of the AEC under the conditions described above so that all exit doses for specific projections were within 10% of the minimum collimation value. To calculate the exposures required to provide this consistent exit dose, we placed an ionisation chamber in the position where an AEC chamber would normally be located (i.e. between the secondary radiation grid and the image detector) and varied the current as described above. This arrangement ensured that the exposures finally selected and our overall conclusions represented to a reasonable level those that would have occurred if an AEC had been in place. Also, the dosemeter used for this study did not account for backscatter that could have arisen from interactions with equipment and other structures. However, as any fractional increase in dose due to backscattered radiation would have affected all exposures and that the level of backscatter produced would have been greatest for the largest fields used, the use of the dosemeter (compared with alternative methods such as thermoluminescent dosemeters, which would include backscatter) is unlikely to have had a significant impact on the overall conclusions made.
In summary, this study has utilised a comprehensive method where the radiation dose to radiosensitive organs was measured and image quality was evaluated using both VGA and VGC methodologies. Under the conditions used in this study, the results have shown that significant dose reductions are possible with strict collimation when using a fixed exposure; however, they have also demonstrated that with the availability of an AEC, strict collimation should be used with caution. Image quality is clearly shown to be improved with smaller collimation levels across both fixed and variable exposures; however, the question remains as to whether this extra quality yields greater diagnostic efficacy, and to answer this, an ROC study is being planned. Once this is completed firm recommendations on optimised levels of collimation with facial bone examinations will be available.
References
- 1.Hart D, Wall BF. Radiation exposure of the UK population from medical and dental X-ray examinations. Chilton, UK: National Radiological Protection Board; 2002 [Google Scholar]
- 2.United NationsScientificCommitteeontheEffectsofAtomicRadiation Annex D: medical radiation exposures. UNSCEAR report vol. I:sources and effects of ionizing radiation, 2001. Vienna, Austria: UNSCEAR secretariat; Available from: http://www.unscear.org/unscear/en/publications/2000_1.html [Google Scholar]
- 3.Valentin J, The 2007 recommendations of the International Commission on Radiological Protection. Publication 103. Ann ICRP 2007;37:1–322 [DOI] [PubMed] [Google Scholar]
- 4.Behrens R, Dietze G. Monitoring the eye lens: which dose quantity is adequate? Phys Med Biol 2010;55:4047–62 [DOI] [PubMed] [Google Scholar]
- 5.Health Physics Society Low levels of ionizing radiation may cause harm. BEIRVII press release, 2005. McLean, VA: Health Physics Society; Available from: http://hps.org/documents/BEIRVIIPressRelease.pdf [Google Scholar]
- 6.Seifert H, Kubale R, Hagen T, Kramann B, Leetz H-K. A study of dose reduction using digital luminescence radiography for lateral skull radiography. Br J Radiol 1996;69:311–17 [DOI] [PubMed] [Google Scholar]
- 7.Langen HJ, Klein HM, Wein B, Stargardt A, Günter RW. Comparative evaluation of digital radiography versus conventional radiography of fractured skulls. Inv Radiol 1993;28:686–9 [DOI] [PubMed] [Google Scholar]
- 8.Willis CE. Strategies for dose reduction in ordinary radiographic examinations using CR and DR. Ped Radiol 2004;34:196–200 [DOI] [PubMed] [Google Scholar]
- 9.Bartholomew AL, Denton ERE, Shaw M, Marshall TJ. A randomised controlled trial comparing lateral skull computerised radiographs with or without a grid. Radiography 2004;10:201–4 [Google Scholar]
- 10.Raby N, Moore D. Radiography of facial trauma: the lateral view is not required. Clin Radiol 1998;53:218–20 [DOI] [PubMed] [Google Scholar]
- 11.McGlinchey I, Fleet MF, Eatock FC, Raby N. A comparison of two or three radiographic views in the diagnosis of skull fractures. Clin Radiol 1998;53:215–17 [DOI] [PubMed] [Google Scholar]
- 12.Brusin JH. Radiation protection. Radiol Technol 2007;78:378–92 [PubMed] [Google Scholar]
- 13.Parry RA, Glaze SA, Archer BR. The AAPM/RSNA physics tutorial for residents: typical patient radiation doses in diagnostic radiography. Radiographics 1999;19:1289–302 [DOI] [PubMed] [Google Scholar]
- 14.Jeffery CD. The effect of collimation of the irradiated field on objectively measured image contrast. Radiography 1997;3:165–77 [Google Scholar]
- 15.McLean D, Collins L, Robinson J. Quality, assurance in diagnostic radiology—a radiographer's handbook. 4th edn Sydney, Australia: The University of Sydney; 2001 [Google Scholar]
- 16.Tossell RF. Facial bones and paranasal sinuses. Bontrager KL, Lampignano JP, eds. Textbook of radiographic positioning and related anatomy. 6th edn. St Louis, MO: Elsevier Mosby; 2005. pp. 367–99 [Google Scholar]
- 17.Bath M, Masson LG. Visual grading characteristics (VGC) analysis: a non-parametric rank-invariant statistical method for image quality evaluation. Br J Radiol 2007;80:169–75 [DOI] [PubMed] [Google Scholar]


