Abstract
Objectives
Motion in images potentially compromises the evaluation of temporally acquired CT perfusion (CTp) data; image registration should mitigate this, but first requires validation. Our objective was to compare the relative performance of manual, rigid and non-rigid registration techniques to correct anatomical misalignment in acquired liver CTp data sets.
Methods
17 data sets in patients with liver tumours who had undergone a CTp protocol were evaluated. Each data set consisted of a cine acquisition during a breath-hold (Phase 1), followed by six further sets of cine scans (each containing 11 images) acquired during free breathing (Phase 2). Phase 2 images were registered to a reference image from Phase 1 cine using two semi-automated intensity-based registration techniques (rigid and non-rigid) and a manual technique (the only option available in the relevant vendor CTp software). The performance of each technique to align liver anatomy was assessed by four observers, independently and blindly, on two separate occasions, using a semi-quantitative visual validation study (employing a six-point score). The registration techniques were statistically compared using an ordinal probit regression model.
Results
306 registrations (2448 observer scores) were evaluated. The three registration techniques were significantly different from each other (p=0.03). On pairwise comparison, the semi-automated techniques were significantly superior to the manual technique, with non-rigid significantly superior to rigid (p<0.0001), which in turn was significantly superior to manual registration (p=0.04).
Conclusion
Semi-automated registration techniques achieved superior alignment of liver anatomy compared with the manual technique. We hope this will translate into more reliable CTp analyses.
Image registration and motion correction constitute a general class of challenges that impact on many areas of imaging and radiology. One specific area in which they may have a potential impact is in CT perfusion (CTp).
There is increasing interest in the ability of CT to evaluate perfusion of tumours and to better understand the behaviour of tumours and the effects of treatments and therapies on tumours [1,2]. CTp is an evolving technique with potentially wide-ranging applications in oncology, including diagnosis, treatment evaluation and prognostication [3]. The technique relies on the acquisition of time–intensity plots from tissues of interest and vascular supply(s), following intravenous administration of a tracer (iodinated CT contrast medium). The incorporation of this information into appropriate physiological models allows computation of tissue perfusion parameters [4]. Parameters that can be derived include tissue blood flow, blood volume and permeability.
CTp data are typically acquired with cine CT of relatively narrow collimation (2–4 cm) performed through the tissue/lesion of interest. A major challenge for CTp is the acquisition of reliable pixel-level time–intensity plots that extend for a sufficient length of time to adequately characterise the perfusion of tissues under consideration. This effectively requires adequate anatomical alignment, or motion correction, of the relevant tissues/lesions of interest. This is particularly problematic in body applications such as the upper abdomen, compared with stationary tissues such as the brain [5,6] and pelvis [7], as movement is inevitable, particularly if acquisitions beyond a single breath-hold are required. The need for prolonged data acquisition is suggested in the literature [8].
One approach to acquiring the prolonged data for implementation in CTp is to obtain the necessary length of data during free breathing, which would then be unconstrained by the requirements and rigours of breath-holding. However, in order to maintain spatial fidelity, adequate registration algorithms need to be available.
The motivation for this work was that there is, unfortunately, no specific registration software/functionality within the vendor environment of the particular CTp software package being used in our work (CT Perfusion 4; GE Healthcare, Waukesha, WI) to perform registrations of the kind described above. The only technique currently available in this application is manual selection of images. This is clearly extremely time-consuming, and furthermore is prone to errors. Availability of an automated or semi-automated registration algorithm would be advantageous; however, it is clearly a prerequisite that the methodology should first be validated before incorporation into CTp analyses.
In this work, we investigate the performance of rigid and non-rigid intensity-based registration techniques to recover liver misregistration in data acquired from liver CTp data sets, as well as comparing the results with those obtained from the currently available manual registration technique.
Methods and materials
Data for this study were obtained from a prospective institutional review board-approved CT perfusion study in which patients with liver tumours had been enrolled. 17 data sets from 9 patients were available for analysis (8 patients had undergone CTp on 2 occasions). The mean age of the 9 patients (5 men and 4 women) was 58.6 years (range 47.9–78.4 years). All the liver tumours were metastases.
The CTp data sets consisted of cine images, of 2 cm collimation, obtained in two phases: Phase 1 was continuous cine acquisition obtained during a single breath-hold; followed by Phase 2, which was six intermittent sets of cine images obtained during free breathing. Phase 1 acquisition allowed high-temporal-resolution images that were inherently aligned, while Phase 2 allowed data acquisition to continue beyond a single breath-hold, but the intermittent images obtained during free breathing necessarily contained misaligned images.
The goal of the current study was to evaluate techniques to align (register) images from the Phase 1 and 2 cine acquisitions.
CT perfusion acquisition technique
Images were obtained using a 16-row multidetector CT scanner (LightSpeed; GE Medical Systems, Milwaukee, WI) with patients in the supine position. The CTp scans were preceded by localisation scans during an expiratory breath-hold and during free breathing to identify the CT co-ordinates of the target lesion for the Phase 1 and 2 components of the CTp acquisition, respectively. For the breath-hold images, expiratory scans were used because they have been reported to be more reproducible for localisation than inspiratory breath-holds [9,10].
After the localisation images, Phase 1 scans were performed using a single level of 2 cm thickness (0.5 cm contiguous slice thickness for four slices, 4i mode) at the mid-point of the target lesion, 30 s breath-hold in expiration. CT data were collected at that single location using the cine mode, with the following settings: tube voltage, 120 kV; tube current, 90 mA; field of view, 32–40 cm; matrix, 512×512. Data acquisition started 5 s after intravenous injection of 70 ml of a non-ionic contrast agent (ioversol; OptirayTM; Mallinckrodt, Inc., St Louis, MO; 320 mg of iodine 100 ml−1) using an automatic injector (MCT/MCT Plus; Medrad, Pittsburgh, PA) and an injection rate of 7 ml s−1. Images were reconstructed every 0.5 s, resulting in 59 images for Phase 1.
Phase 2 scans were six further 6-s cine sets, obtained during free breathing, centred according to the localisation scans obtained during free breathing, and with scanner settings identical to those used in Phase 1. The temporal spacing of the six intermittent scan sets is outlined in Figure 1. Intermittent scans were utilised to limit radiation exposure. A specific part of the respiratory cycle was not mandated for the start of Phase 2 acquisitions; patients were permitted to breathe freely. However, the acquisition protocol was designed so that the scan duration of each set (6 s) was sufficiently long to encompass at least 1 complete respiratory cycle, resulting in at least 1 of the 11 images being at the same (or similar) respiratory phase as that of the Phase 1 data. As was the case for the Phase 1 scans, the images were reconstructed every 0.5 s, resulting in 11 images for each of the 6 cine sets (totaling 66 images in Phase 2). The estimated effective dose for the complete CTp protocol (localisation scans, Phases 1 and 2) was 29 mSv.
Figure 1.

Schematic of CT perfusion protocol and imaging time points. The curved dotted line represents a patient's breathing cycle, and the blue blocks represent times at which cine CT data are being acquired. The Phase 1 cine block consists of 59 cine images reconstructed at 0.5 s. Each of the Phase 2 cine blocks contain 11 cine images reconstructed at 0.5 s (totalling 66 Phase 2 cine images). Note that within each Phase 2 cine block there is a time where the phase of the breathing cycle matches that of the Phase 1 breath-hold.
Image registration
The overall goal of image registration was to select a single image from each of the six free-breathing cine sets (i.e. from Phase 2) that aligned with a given reference image from the breath-hold cine acquisition (i.e. from Phase 1), for each data set obtained.
Three registration techniques were developed and assessed: manual, rigid and non-rigid. A manual technique is the only registration method available to users intending to utilise the currently available CT perfusion software within the GE environment. The other two techniques represent semi-automated intensity-based registration techniques. Because registration of the liver was the primary interest in this work, alignment was based on correspondence of liver anatomy, and not on the whole axial CT section.
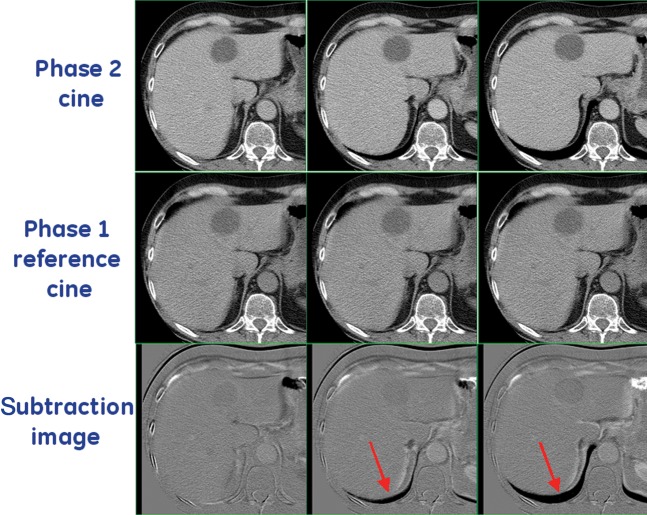
Manual registration: to aid in manual registration of images, subtraction images of each Phase 2 image compared with the reference Phase 1 image of each data set were produced (see Figure 2). This process resulted in 6 sets of 11 subtraction images for each patient data set. For each of the six sets, two observers in consensus (EFA and DHH) selected the single subtraction image that showed the least mismatch in the liver boundary.
Figure 2.
Top row shows three examples of Phase 2 cine images (acquired at different positions in the breathing cycle). The bottom row shows the subtraction image produced by subtracting the Phase 2 cine images from the reference cine image from Phase 1 (middle row). The subtraction images were presented to the observers to aid in performing manual registrations. Arrows highlight areas of difference between the reference image and the Phase 2 cine images, which can clearly be seen in the subtraction images. In this example, it is clear that the Phase 2 cine in column 1 (bottom left-hand corner) was most similar (or least misregistered) to the reference image.
Rigid registration: A semi-automated technique was developed to rigidly register each of the Phase 2 cine images to the reference image from Phase 1. Prior to registration, the liver boundary was segmented from the reference image. A tool was written in MATLAB (MathWorks, Natick, OH) that allowed a user to manually define a region of interest (ROI) around the liver (on a slice-by-slice basis) and segment out the rest of the anatomy. Only intensity values within the ROI were used in this registration algorithm (Figure 3). This ensured that the rigid registration technique focused on aligning only the liver tissue in each case. Each of the Phase 2 images was rigidly registered to the segmented reference image. The three-dimensional (3D) transformation model of the technique was constrained to allow only translational corrections in the x, y, and z directions, and rotational corrections around the z-axis. The other rigid degrees of freedom (rotations around the x- and y-axis) were omitted to help improve the robustness of the registration algorithm. The similarity measure utilised was normalised mutual information [11], which assumes a statistical relationship between the intensities in the images to be registered, and is ideally suited in the current application as liver intensity changes can be expected over the time course of the data acquisition because of intravenous contrast administration. All registrations were performed using the freeware vtkCISG registration toolkit, developed at King's College London, UK [12]. The resulting registration for each case was used to transform the Phase 2 images into the image space of the reference image to show anatomical correspondence between the two images.
Figure 3.
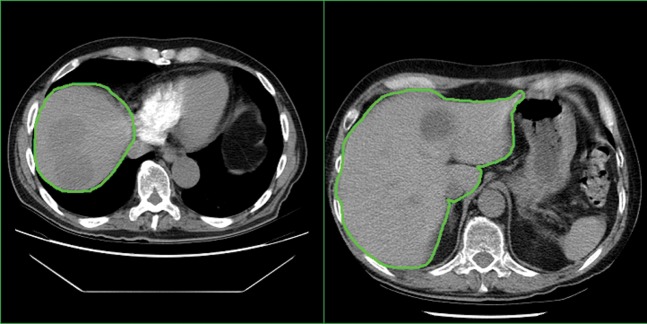
Examples of slices from Phase 1 cine reference images from two separate patient data sets. The green line in each image shows the rough liver region of interest used to segment the cine reference image before registration. Only intensity values within the region of interest were used during the rigid registration.
The squared sum of intensity differences (SSD) between the segmented reference image and each registered Phase 2 image were calculated:
 |
(1) |
where ΩA,B is the overlapping domain of the segmented reference image (A) and the registered Phase 2 image (B). A(x) and B(x) are the intensity at location x in image A and image B, respectively. N is the total number of voxels in the overlapping region of the images.
For each group of 11 registered Phase 2 images, the “best” registered Phase 2 image was selected, which was considered to be the one with the smallest SSD. Visual inspection of the best registered Phase 2 images was then performed to confirm good anatomical alignment between the reference image and the six chosen registered Phase 2 images.
Non-rigid registration: A semi-automated technique was developed to non-rigidly register Phase 2 images to Phase 1 reference images. The six best transformations of the rigid registration described above were used as an initial alignment estimate for the non-rigid registration task. The non-rigid registrations were performed using an algorithm based on free-form deformations (FFDs) using B-splines [13]. FFDs can model local deformations by deforming an object through manipulating a mesh of landmarks, known as control points. The non-rigid registrations were performed using a 22×22×9 control point grid with 22.31×22.31×3.75 mm control point spacing. These registration parameters were used to allow sufficient control points to retrieve the expected deformation of soft tissue/tumour in the liver, and constrain computation to a manageable time frame. The resultant non-rigid registration transformations were then used to transform the Phase 2 images, using 3D B-spline interpolation, into the image space of the reference image. Like the rigid registrations, all non-rigid registrations were performed using the freeware vtkCISG registration toolkit.
Visual validation
The ability of the three registration techniques to align images was assessed by a semi-quantitative visual validation study.
Four observers—two CT radiologists (CSN and ZY) and two CT technologists (EFA and DHH)—independently scored the visual alignment of the liver for each of the six registered images, selected by each of the three techniques as described above, compared with their corresponding reference image. All three registration techniques, for all 17 patient data sets, were evaluated in a blinded fashion on two separate occasions (“rounds”). Each scoring round was separated by 1 month to reduce recall bias. Scoring by each observer, in each round, was undertaken in a continuous session, which typically took 2–3 h.
Alignment of liver anatomy between registered and reference images was judged solely on the liver boundary, and did not include considerations of internal liver structure, which would be very challenging given the relative homogeneity of liver parenchyma. To aid the observers in determining the differences between the liver boundaries of the registered and reference images, subtraction images were produced by subtracting the reference image from the registered images, as described in the manual registration technique above.
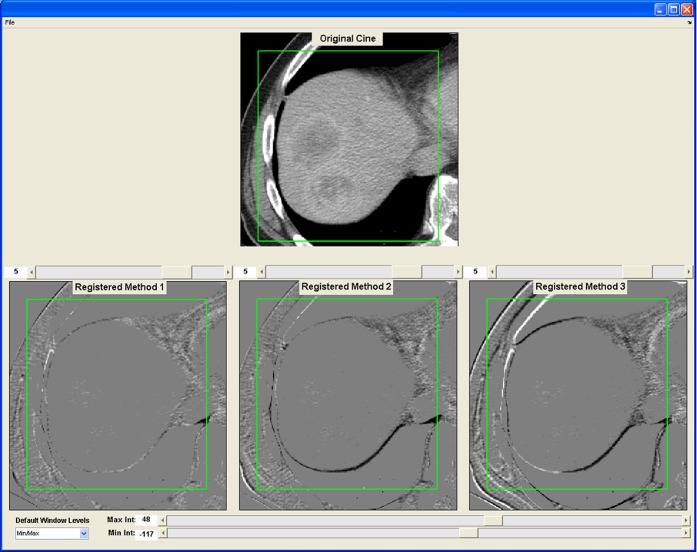
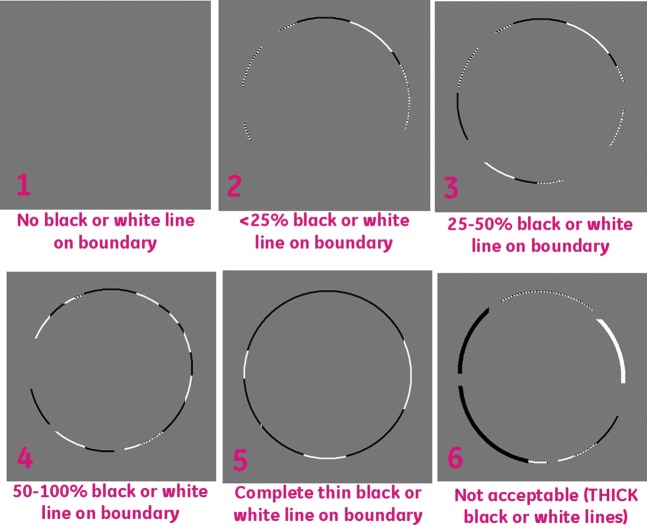
A graphical user interface was developed in MATLAB, which displayed the subtraction images for each of the three registration techniques (Figure 4). The three registration techniques were presented in random order in the viewer windows to remove any bias due to sequencing. A six-point scoring system was used to assess the degree of alignment by assessing the amount of structure in the subtraction image at the liver boundary. The visual scores ranged from 1 to 6, with 1 being the best (no structure in the subtraction image) and 6 the worst (major structure around the boundary of the liver in the subtraction image). Figure 5 shows a visual representation of the alignment criteria for the scoring system, which was given to each observer before scoring took place.
Figure 4.
A snapshot of the graphical user interface developed for the visual validation experiment of the three registration techniques. Top row shows a transverse slice of the reference image from Phase 1. Bottom row shows the subtraction image produced by subtracting the reference image from one of the six registered images for each of the three registration techniques. The three registration techniques were presented to the observer in a random way (“Method 1, 2, 3”). Observers were asked to score the degree of alignment of the liver outline within the green box, using the scoring scale presented in Figure 5. In this example, the registration techniques were non-rigid (left), rigid (middle) and manual (right).
Figure 5.
A visual representation of the alignment criteria for the scoring system. This figure was given to each observer for each scoring session.
Statistical methods
A multivariate ordinal probit model with generalised estimating equation method [14] was used to assess the effect of registration technique, observer and round on the probability of obtaining a better image score. A random effect of patient was fitted in the model to account for the correlation of scores from the same patient. The effect of the registration technique was adjusted for observer and round in the model. A significant likelihood ratio test was established prior to pairwise comparisons. All tests were two-sided and p-values of 0.05 or less were considered statistically significant. Statistical analysis was carried out using SAS v. 9 (SAS Institute, Cary, NC).
Results
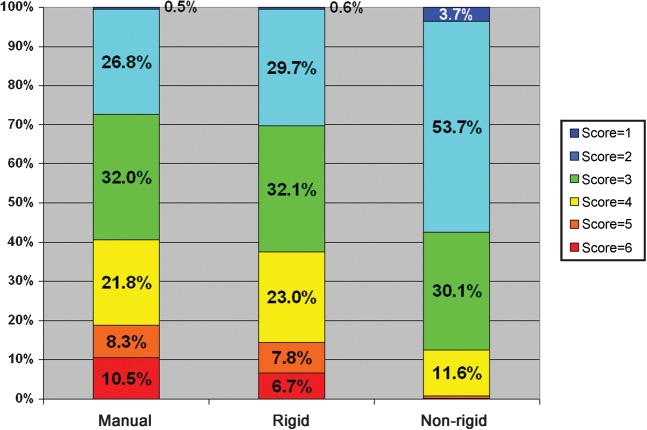
The mean (standard deviation) imaging scores in our validation study, averaged over all scores given for a particular technique, for the manual, rigid and non-rigid techniques were 3.4 (1.3), 3.3 (1.2) and 2.5 (0.8), respectively. These are the average scores derived from 306 registrations (17 CTp data sets, each with six registered images, and three registration techniques), four observers and four rounds of observation, totalling 2448 observer scores. Summary results for the visual scores for the three registration techniques are presented in Table 1, and graphically in Figure 6.
Table 1. Summary of the visual scores (mean±standard deviation), by observer and round of observation, and registration technique.
| Observer 1 |
Observer 2 |
Observer 3 |
Observer 4 |
||||||
| Registration technique | Round 1 | Round 2 | Round 1 | Round 2 | Round 1 | Round 2 | Round 1 | Round 2 | Average of all observers and rounds |
| Manual | 3.3±1.1 | 3.2±1.2 | 3.4±0.8 | 4.3±0.9 | 2.8±1.2 | 3.6±1.6 | 3.1±1.3 | 3.6±1.2 | 3.4±1.3 |
| Rigid | 3.2±1.2 | 3.2±1.3 | 3.3±0.8 | 4.2±0.7 | 2.6±0.9 | 3.5±1.6 | 2.9±1.1 | 3.3±0.9 | 3.3±1.2 |
| Non-rigid | 2.5±0.6 | 2.5±0.5 | 2.8±0.7 | 3.7±0.6 | 2.0±0.1 | 2.3±0.6 | 1.9±0.7 | 2.5±0.7 | 2.5±0.8 |
Figure 6.
Summary of the visual scores for each of the three registration techniques: manual, rigid and non-rigid registration techniques, averaged over all observers, data sets and rounds. Each coloured block represents the percentage of total number of images evaluated with a given score. 100%=816 total observations per registration technique (4 observers×17 data sets×6 registrations×2 rounds). Scores are as in Figure 5 (1=best, 6=worst, registration).
There was a significant difference in the visual scores when comparing all three registration techniques as a whole (p=0.03). Pairwise comparisons indicated that the semi-automated techniques were significantly superior to the manual technique, with the non-rigid registration technique significantly superior to the rigid registration technique (p<0.0001), which in turn was significantly superior to the manual registration technique (p=0.04; Table 2).
Table 2. Pairwise comparisons between image registration techniques based on ordinal model estimates.
| 95% confidence limits of odds ratio |
|||||
| Comparison | Odds ratio | Standard error | Lower Upper | p-value | |
| Rigid vs manual | 1.14 | 0.07 | 1.00 | 1.29 | 0.04 |
| Non-rigid vs manual | 2.73 | 0.42 | 2.02 | 3.69 | <0.0001 |
| Non-rigid vs rigid | 2.40 | 0.33 | 1.83 | 3.15 | <0.0001 |
The overall significance was established first by likelihood ratio test (p=0.03). Higher odds ratio means higher probability of obtaining better alignment scores, e.g. non-rigid vs manual has an odd ratio of 2.73 (95% confidence interval: 2.02–3.69), indicating that using non-rigid registration increased 2.73 times by the odds of obtaining higher alignment scores.
There were no significant differences between observers (p=0.06). Although the absolute scores assigned by observers between rounds differed significantly, the relative ranking of the registration techniques assigned by observers in both rounds was the same.
As a supplementary assessment of our registrations, we generated and compared positive enhancement integral images before and after registration (Figure 7).
Figure 7.
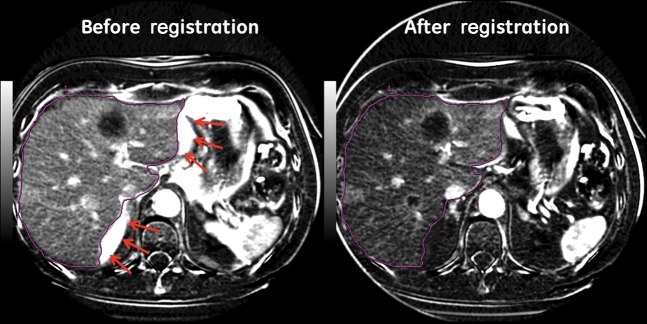
Positive enhancement integral images before and after rigid registration. Note artefacts along liver margin on the image before registration (arrows). Purple line represents the liver boundary.
Discussion
Our results indicate that the two semi-automated registration techniques described above achieved significantly better liver alignment than the (currently available) manual registration technique. Although this might seem anticipated, there has been relatively limited work on describing registration techniques to cope with the specific challenges of CTp data sets, and on validating their techniques.
Two previous reports have described approaches to register liver CTp data; they have been based solely on rigid registration algorithms [15,16]. Cao et al [15] used an intensity-based, limited-degree-of-freedom, automated-alignment methodology, and Jensen et al [16] used a combination of semi-automated one-dimensional box registration using cross-correlation followed by a 3D liver surface registration. Unlike our current work, these reports have only provided limited validations of their alignments achieved, namely reporting qualitative reductions visually in misalignment artefacts [15] and presenting contrast concentration–time curves before and after registration [16].
Unlike the two previous studies, the current work evaluates a rigid registration technique relative to techniques with both more simplistic (manual) and more complex (non-rigid) transformation models, which in turn incorporate different levels of automation/human interaction. Such comparisons are important to determine the level of complexity that might be required by a registration algorithm for the alignment of liver CTp data in a clinical setting.
Although our results suggest that the semi-automated techniques were significantly superior to the manual registration technique, all three techniques arguably achieved good alignments. Indeed, observers required the assistance of subtracted images to score the frequently very subtle misalignments. This suggests that manual registration may be a reasonable technique to use in a clinical setting. However, such a technique requires post-processing, intense observer interaction and concentration, and is inevitably prone to human errors. Simply from the perspective of processing time, we found that our trained observers took about 1 h to manually select the closest matching images from each of the six Phase 2 cine groups. The semi-automated techniques would seem advantageous as they reduce the potential for human errors, and indeed they achieve superior alignment compared with the manual technique.
As regards to the semi-automated registration techniques, our results suggest that the non-rigid registration technique yielded improved alignment compared with the rigid registration technique. Non-rigid techniques provide the option for more complex transformations and the opportunity to recover misalignments beyond those of rigid techniques. However, the added computational complexity of the non-rigid algorithm described is a disadvantage: 1–2 h per registration, totalling 6–12 h per data set, compared with 2–3 min for the rigid technique. Increasing the number of degrees of freedom for the rigid algorithm by including combinations of rotations, scaling and skewing may improve alignments without extending its computational time to those of the non-rigid algorithm, which might offer a reasonable compromise. We intend to explore these options more fully in future work.
One other potential drawback with the specific non-rigid registration technique used in this work is that it does not guarantee conservation of tissue/lesion volume. This could potentially be a problem for the registration of perfusion data as signal intensities vary in the tissue/lesion following the intravenous contrast medium administration. The rigid registration technique does not suffer from the limitation. In future work, we intend to investigate the implementation of volume-conserving non-rigid methodologies [17] for this application and validate how their performance compares with the current algorithm.
Another potential for future work would be to investigate optimisation of the non-rigid registration technique to run in a more clinically viable time frame. One technique to investigate would be to utilise the current advances in graphics processing unit technology, which have shown some promise in improving the computational efficiency of such non-rigid registration algorithms [18].
This study focused on techniques to register Phase 2 images to a given Phase 1 reference image, but the principles are not restricted to this narrow task. It should be recognised that Phase 1 data may contain misaligned images because of motion or breathing during this acquisition; the registration concepts utilised can, and should, be applied to motion correction of these data as well.
We acknowledge several limitations in our study. In our rigid registration process, there was no specific way to identify and reject free-breathing images that may have had tissue displacements greater than the z-axis coverage of the reference Phase 1 image (2 cm). Such an image would contain little to no corresponding information with the reference image, which in turn would lead to issues for the registration algorithm. The protocol was designed to reduce the risk of this occurring by centring the Phase 2 image acquisitions according to the free-breathing localisation scan. However, if the patient happened to breathe more deeply/shallowly during the Phase 2 acquisition than during the localisation scan, it is conceivable that such data may be obtained. Unless all 11 images of a Phase 2 set were acquired with displacements of more than 2 cm (for example, if a patient breathed particularly deeply/shallowly for an entire breathing cycle), such images are unlikey to affect the selection of the best registered Phase 2 image. If this were the case, these images would be easily identified during the visual inspection of the best registered images from each of the six Phase 2 data sets. In future work we will investigate potential methods to identify and reject such images during the registration process to mitigate this specific risk.
The validation component of our study did not employ a fully quantitative assessment of alignment involving objective metrics, such as percentage overlap and distance of centre of mass, as described in previous work [19]. However, application of such quantitative measures first requires segmentations of the structures of interest, in our case the liver. CT liver segmentation techniques [20] have their own limitations, which could introduce errors in the subsequent quantitative evaluations if not performed accurately and robustly. CT liver segmentation is still a challenging area of research, and robust and accurate segmentation techniques that could cope with the poor contrast resolution of the liver in relation to surrounding tissues, and the limited z-axis coverage (2 cm) of the liver, in the data sets in this study are still under investigation and have yet to be validated.
There are inherent limitations of a visual validation technique, largely due to inconsistencies between and within observers, and bias. We attempted to mitigate these deficiencies by using multiple observers, blinding, randomisation and repeated observations performed with a prolonged time interval. Although there were no significant differences between observers, our results indicated differences in the absolute scores assigned between the rounds of observations; nevertheless, the relative ranking of scores of the three registration techniques within rounds was consistent.
Another limitation is that our work has focused solely on the alignment of the liver, whereas for the underlying clinical application of assessing tumour perfusion, the primary goal would be to align the tumour(s) contained within the liver. This would be very challenging as there is typically very little contrast (intensity) differential between tumours and surrounding liver parenchyma. Furthermore, differential contrast between these structures varies continuously during the course of data acquisition according to the intravenous contrast medium kinetics of the respective tissues. Nevertheless, it might be anticipated that in general one would expect embedded tumours to move in concert with the liver parenchyma as a whole, but this requires validation.
The registration of liver motion/deformation from free-breathing liver CTp data has clear clinical advantages for CTp measurements. It allows for reliable pixel-level intensity information to be obtained from prolonged (beyond a single breath-hold) CTp acquisitions so that the perfusion of tissues can be adequately characterised. Our supplementary assessment using positive enhancement integral images suggests that our rigid registration technique improved anatomical alignment of the liver boundary. Obtaining well-registered images from such data has challenges. In the currently available commercial software in which this CTp data would be processed, registration of such data sets can only be undertaken manually, which has considerable limitations. We have developed semi-automated techniques to accomplish this task and validated them semi-quantitatively. Our work suggests that rigid and non-rigid registration techniques can achieve significantly superior alignment compared with the currently available manual technique. Future work is planned to evaluate whether the incorporation of such registration techniques into CTp analyses has any impact on resulting CTp estimates.
Acknowledgments
Conflict of interest
A Chandler is an employee of GE Healthcare.
References
- 1.Miles KA, Charnsangavej C, Lee FT, Fishman EK, Horton K, Lee TY. Application of CT in the investigation of angiogenesis in oncology. Acad Radiol 2000;7:840–50 [DOI] [PubMed] [Google Scholar]
- 2.Miles KA, Griffiths MR. Perfusion CT: a worthwhile enhancement? Br J Radiol 2003;76:220–31 [DOI] [PubMed] [Google Scholar]
- 3.Kambadakone AR, Sahani DV. Body perfusion CT: technique, clinical applications, and advances. Radiol Clin North Am 2009;47:161–78 [DOI] [PubMed] [Google Scholar]
- 4.Lee TY. Functional CT: physiological models. Trends Biotechnol 2002;20(suppl. 8):S3–1012570152 [Google Scholar]
- 5.Halpin SFS. Brain imaging using multislice CT: a personal perspective. Br J Radiol 2004;77(suppl. 1):S20–6 [DOI] [PubMed] [Google Scholar]
- 6.Lev MH, Segal AZ, Farkas J, Hossain ST, Putman C, Hunter GJ, et al. Utility of perfusion-weighted CT imaging in acute middle cerebral artery stroke treated with intra-arterial thrombolysis: prediction of final infarct volume and clinical outcome. Stroke 2001;32:2021–8 [DOI] [PubMed] [Google Scholar]
- 7.Henderson E, Milosevic MF, Haider MA, Yeung IW. Functional CT imaging of prostate cancer. Phys Med Biol 2003;48:3085–100 [DOI] [PubMed] [Google Scholar]
- 8.Goh V, Halligan S, Hugill JA, Gartner L, Bartram CI. Quantitative colorectal cancer perfusion measurement using dynamic contrast-enhanced multidetector-row computed tomography: effect of acquisition time and implications for protocols. J Comput Assist Tomogr 2005;29:59–63 [DOI] [PubMed] [Google Scholar]
- 9.Balter JM, Lam KL, McGinn CJ, Lawrence TS, Ten Haken RK. Improvement of CT-based treatment-planning models of abdominal targets using static exhale imaging. Int J Radiat Oncol Biol Phys 1998;41:939–43 [DOI] [PubMed] [Google Scholar]
- 10.Seppenwoolde Y, Shirato H, Kitamura K, Shimizu S, van Herk M, Lebesque JV, et al. Precise and real-time measurement of 3D tumor motion in lung due to breathing and heartbeat, measured during radiotherapy. Int J Radiat Oncol Biol Phys 2002;53:822–34 [DOI] [PubMed] [Google Scholar]
- 11.Studholme C, Hill DLG, Hawkes DJ. An overlap invariant entropy measure of 3D medical image alignment. Pattern Recognition 1999;32:71–86 [Google Scholar]
- 12.Hartkens T, Rueckert D, Schnabel JA, Hawkes DJ, Hill DLG. VTK-CISG registration toolkit: an open source software package for affine and non-rigid registration of single- and multimodal 3D images. : Meiler M, Saupe D, Kruggel F, Handels H, Lehmann T, Bildverarbeitung für die medizin 2002: algorithmen system anwendungen. Leipzig/Berlin, Germany: Springer; 2002:409–12 [Google Scholar]
- 13.Rueckert D, Sonoda LI, Hayes C, Hill DL, Leach MO, Hawkes DJ. Nonrigid registration using free-form deformations: application to breast MR images. IEEE Trans Med Imaging 1999;18:712–21 [DOI] [PubMed] [Google Scholar]
- 14.Liang K-Y, Zeger SL. Longitudinal data analysis using generalized linear models. Biometrika 1986;73:13–22 [Google Scholar]
- 15.Cao Y, Platt JF, Francis IR, Balter JM, Pan C, Normolle D, et al. The prediction of radiation-induced liver dysfunction using a local dose and regional venous perfusion model. Med Phys 2007;34:604–12 [DOI] [PubMed] [Google Scholar]
- 16.Jensen N, Lock M, Kozak R, Chen J, Lee T, Wong E. SU-GG-I-101: 3D segmentation and rigid registration for minimizing breathing motion effects in liver CT perfusion. Med Phys 2010;37:3124 [Google Scholar]
- 17.Rohlfing T, Maurer CR, Jr, Bluemke DA, Jacobs MA. Volume-preserving nonrigid registration of MR breast images using free-form deformation with an incompressibility constraint. IEEE Trans Med Imaging 2003;22:730–41 [DOI] [PubMed] [Google Scholar]
- 18.Teßmann M, Eisenacher C, Enders F, Stamminger M, Hastreiter P. GPU accelerated normalized mutual information and B-Spline transformation. Botha CP, Kindlmann GL, Niessen WJ, Preim B, Proceedings of the Eurographics Workshop on Visual Computing for Biomedicine (EG VCBM). Delft, the Netherlands: Eurographics Association; 2008:117–25 [Google Scholar]
- 19.Chandler A, Wei W, Herron DH, Anderson EF, Johnson V, Ng CS. Semiautomated motion correction of tumors in lung CT-perfusion studies. Acad Radiol 2011;18:286–93 [DOI] [PubMed] [Google Scholar]
- 20.Heimann T, van Ginneken B, Styner MA, Arzhaeva Y, Aurich V, Bauer C, et al. Comparison and evaluation of methods for liver segmentation from CT datasets. IEEE Trans Med Imaging 2009;28:1251–65 [DOI] [PubMed] [Google Scholar]


