Abstract
Breast cancers that are found and confirmed because they are causing symptoms tend to be larger and are more likely to have already spread into the lymph nodes and beyond. Thus early detection and confirmation are of paramount importance. The normalized axial–shear strain area (NASSA) feature from the axial-shear strain elastogram (ASSE) has been shown to be a feature that can identify the boundary bonding conditions that are indicative of the presence of cancer. Recently, we investigated and reported on the potential of the NASSA feature for breast lesion classification into fibroadenomas and cancers. In this paper, we investigate the size distribution of the lesions that were part of the previous study and analyze classification performance specifically on small lesions (<10 mm diameter). A total of 33 biopsy–proven malignant tumors and 30 fibroadenomas were part of the study that involved 3 observers blinded to the BIRADS® ultrasound scores. The observers outlined the lesions on the sonograms and the lesion size (maximum circle-equivalent diameter in mm) was computed from this outline. The ASSE was automatically segmented and color overlaid on the sonogram, and the NASSA feature from ASSE was computed semi–automatically. Receiver operating characteristic (ROC) curves were then generated for the subset of cases involving small lesions. Box-plots were produced for the two different lesion size groups, small and large, from a logistic regression classifier that was built previously. The results of our study show that approximately 38% and 22% of the fibroadenomas and cancers respectively were small. Further, it was found that the NASSA feature resulted in a perfect classification of the small lesions, both in the training data and in the cross-validation. For lesions <10 mm the difference in fibroadenoma and cancer mean scores was 0.73 ± 0.13 (p<0.001) while lesions >10 mm had a difference of 0.52 ± 0.24 (p<0.001). The results also showed that the small lesions actually had better classification than the larger lesions (>10 mm). These results suggest that the ASSE feature can work equally well even on small lesions to improve the standard US BIRADS–based breast lesion classification of fibroadenoma and malignant tumors.
Keywords: Axial-shear strain, Benign, Bonding, Breast cancer, Elastography, Fibroadenoma, Malignant, NASSA, ROC, Small lesion, Sonogram, Ultrasound
INTRODUCTION
It is estimated that almost 1.6 million new cases of cancer will be diagnosed in the US in 2011(ACS 2010). Of the estimated 774,370 cases of cancer diagnosis in women, breast cancers are the most common (30%). Further, breast is the second leading site (15%) of cancer deaths in the US (ACS 2010). While the use of screening mammography is widespread, breast cancer continues to present with palpable masses in a majority (55%–68%) of cases (Seltzer 1992, Reeves et al. 1995). A recent report by Mathis et al. (2010) concluded that despite the frequent use of screening mammography, 43% of breast cancers presented as a palpable mass or otherwise symptomatic presentation. Breast cancers that are found and confirmed because they are causing symptoms tend to be larger and are more likely to have already spread beyond the breast (ACS 2011). Thus early detection and confirmation are of paramount importance.
Mammography serves as the current standard for breast cancer screening. Although breast ultrasound is not routinely used for screening, oftentimes it is used to evaluate breast problems that are found during a screening or diagnostic mammogram or on physical exam (Stavros et al. 2004, ACS 2012). Sonography is considered a helpful addition to mammography when screening women with dense breast tissue, which is difficult to evaluate with a mammogram alone (ACS 2012). In addition, ultrasound is particularly useful for differentiating between cystic or solid lesions. Ultrasound has become a valuable tool for imaging as it is widely available, non-invasive, and less expensive compared to several other competing imaging modalities. However, there is still an overlap between benign and malignant features on sonograms (Stavros et al. 2004), and biopsy outcomes serve as the gold-standard. It is of interest to note that the BIRADS® features used in conventional sonography (ACR 1993), unlike those used in palpation, do not relate directly to either
the elastic properties of the tumor, or
the bonding characteristics at the boundary between the tumor and the host tissue (Fry 1954).
Ultrasound elastography was introduced in the early 90’s (Ophir et al. 1991) to provide a way to visualize mechanical properties of the target tissue. The Axial-Strain Elastography (ASE) or elastography, as it is commonly referred to, provides information relating to the elastic property of the target tissue (item 1 above). Specifically, contrast between different tissues is produced when tissue regions with different stiffness parameters experience different levels of axial strain than those in surrounding tissues; a stiffer tissue region will generally experience less strain than a softer one (Céspedes et al. 1993, Ophir et al. 1999). Several groups have now reported on the usefulness of ASE in the classification of breast tumors as benign or malignant (cf. Garra et al. 1997, Hall et al. 2003, Regner et al. 2006, Svensson et al. 2005, Barr 2012, Itoh et al. 2006, Burnside et al. 2007).
We introduced axial-shear strain elastography to image and exploit the tumor-host tissue boundary bonding characteristics (item 2 above) (ThitaiKumar et al. 2005, 2007). It is important to note that the contrast mechanism in axial-shear strain elastogram (ASSE) is due to the shear stress transfer that occurs at boundaries having elastic contrast (Thitaikumar et al. 2007b). Thus, ASSE images fundamentally new information relating to the bonding conditions at that boundary. An important advantage of the ASSE technique is that it is the only technique among all other elasticity imaging techniques discussed in literature (cf. ASE, Shear wave elastography, etc. Parker et al. 2011) that is able to image this important boundary bonding condition as a separate entity and exploit this information for breast lesion classification into benign vs. malignant. The normalized axial–shear strain area (NASSA) feature computed from the ASSE has been shown to be a feature that could identify the boundary bonding conditions that are indicative of the presence of cancer (ThitaiKumar et al. 2007, 2008). Recently, we investigated and reported on the potential of the NASSA feature for breast lesion classification into fibroadenomas and cancers (Thittai et al. 2011). However, no analysis on the effect of lesion size on the results was performed or reported. Therefore, the aim of this work was to investigate the size distribution of the lesions that were part of the previous study and analyze classification performance specifically on small lesions (<10 mm diameter) as compared to larger lesions.
It is important to recognize that the potential to metastasize has a high degree of correlation to the tumor size and therefore influences the recurrence rates and ultimately patient survival (Valagussa et al. 1978, Gibbs et al. 2004). The detection and subsequent characterization of small breast lesions is therefore of paramount importance (Gibbs et al. 2004). Studies have shown encouraging survival with lesions <10 mm. For example, Rosen et al. (1993) showed that infiltrating ductal or lobular lesions <10 mm in diameter correlated with a good prognosis and that the relapse free survival at 20 years was 88%. More recently, Sivaramakrishna and Gordon (1997) extrapolated the lognormal relationship between tumor size and probability of metastasis to include small breast lesions and showed that tumors detected at 20 mm diameter had a 25.5% probability of metastasis, while tumors detected at 5 mm diameter had a 1.2% probability of metastasis. Therefore, any additional image, like ASSE, that might aid not only in detection, but also in non-invasive classification into benign or malignant will have a significant impact on breast lesion management.
MATERIALS AND METHODS
We performed an analysis of the lesion size distribution in the data that were part of previously reported observer study (Thittai et al. 2011). Briefly, the data set consisted of in vivo digital radiofrequency (RF) data of breast lesions that were originally acquired for evaluating standard axial elastograms. The patient study was HIPAA-compliant and had appropriate institutional review board approval. Informed consent was obtained from all participating patients, who were informed that the RF data collected would be used at a later time for the creation of elastograms. The elastographic data were acquired using a Philips HDI-1000 US scanner (Philips Healthcare, Andover, MA, USA) with an L4-7 transducer probe operating at a 5 MHz center frequency. The setup consisted of a precision digital motor system for controlled compressions. The acquisition protocol involved multi-compression with step sizes of 0.25%, up to a maximum total compression of 5%, thereby allowing multi-compression averaged elastograms with improved image quality (Varghese et al. 1998). A total of 33 biopsy–proven malignant tumors and 30 fibroadenomas of all sizes were present in the study that involved 3 observers blinded to the BIRADS® ultrasound scores. More details on the patient data acquisition and set-up can be found in our previous report (Thittai et al. 2011).
No observer study or reprocessing of the data were done in the present study. We only analyze the data obtained from the previous observer study reported in Thittai et al (2011). Readers are referred to the previous paper for details regarding ASSE generation, display, feature of interest, observer training and image evaluation protocol. However, for completeness we briefly provide some details here. The sonograms used in the study were reconstructed from the selected RF frames. The observers outlined the lesions on the sonograms. The ASSE was automatically segmented and color overlaid on the sonogram, and the NASSA feature from ASSE was computed semi–automatically. The lesion size (equivalent diameter in mm) was computed from the sonographic lesion area, obtained from the lesion outlines made by the observers in the previous study. Note that for the purposes of plotting the lesion size distribution, we pooled the data from all 3 observers.
We reprocessed the ROC curves using the same logistic regression prediction scores that generated the results reported in Thittai et al. (2011), but for the cases involving lesion sizes < 10 mm and >=10mm group separately. This enables comparison with previously published ROC curves in Thittai et al. (2011) that involved data from combined small and large lesion sizes. The size for each observation was determined by taking the average lesion size among the three observers. To reduce overtraining, n-fold cross-validation was performed by the observer – each observation was predicted using a logistic regression model that was trained on the rest of the data for that observer. The predictions were then concatenated to form the cross-validated predicted data. Box-plots of the scores were produced for the two different lesion size groups, small and large. A two-sample t-test was used to compare the scores between the fibroadenoma and cancer group cross-validated scores for each observer separately. A weighted two-sample t-test was used for the three observer combined data by computing mean scores among the three observers for each observation and weighting the means and variances in the t statistic by the number of observers that had non-missing values for that observation. Exact confidence intervals for proportions were calculated using the Pearson-Klopper method. The statistical packages “R” version 2.10.1 (R Foundation for Statistical Computing, Vienna, Austria) was used for the analysis.
RESULTS AND DISCUSSION
Figures 1a and 1b show the histogram plots of the fibroadenomas (FA) and cancers, respectively. The histograms show that sizes of approximately 38% and 22% of the fibroadenomas and cancers, respectively, were < 10 mm.
Fig. 1.
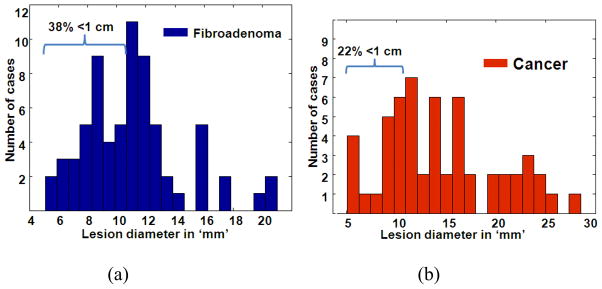
Histogram plots of the lesion size distributions of fibroadenomas (a) and cancers (b) that were part of the observer study reported in Thittai et al. (2011). Note that the data from all 3 observers were pooled to obtain the histograms.
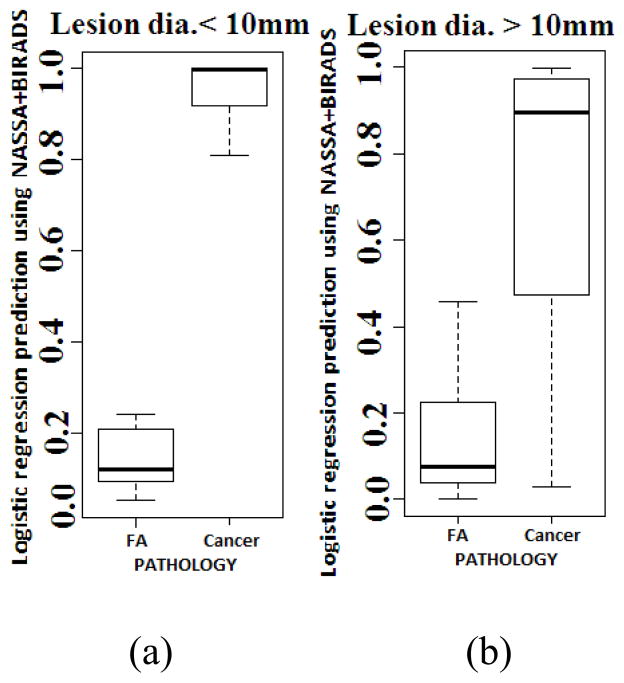
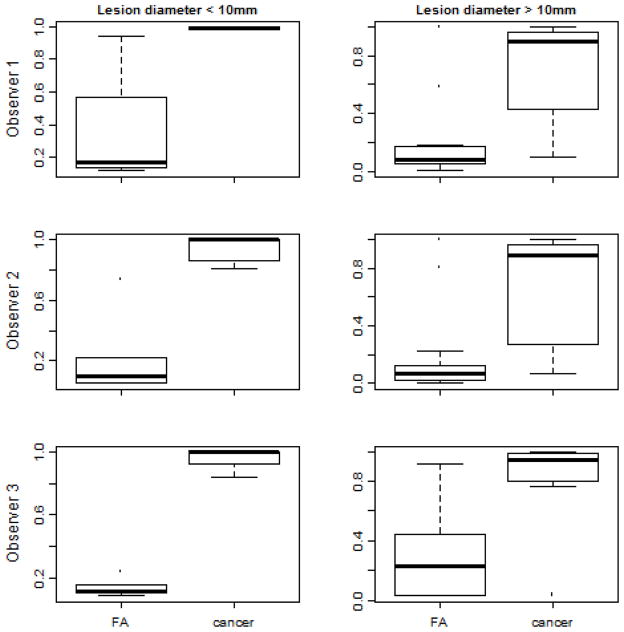
Figure 2 shows the box-plots of the cross-validated logistic regression scores obtained for the two classes. For lesions <10 mm the difference in fibroadenoma and cancer mean scores was 0.73 ± 0.13 (p<0.001) while lesions >10 mm had a difference of 0.52 ± 0.24 (p<0.001). It is clear from the box-plots shown that the lesions with a small (<10 mm) diameter actually had better classification than the larger lesions (>/= 10 mm). We observed that NASSA had a perfect classification of the small lesions in this data set for each individual observer, both in the training data and in the cross-validation. Specifically, the accuracy for the cross-validated data was 1.00 sensitivity (95% CI 0.16–1.00) and 1.00 specificity (95% CI 0.40–1.00) for observer 1, 1.00 sensitivity (95% CI 0.54–1.00) and 1.00 specificity (95% CI 0.54–1.00) for observer 2, and 1.00 sensitivity (95% CI 0.29–1.00) and 1.00 specificity (95% CI 0.48–1.00) for observer 3. The individual box-plots for the 3 observers are shown in Figure 3.
Fig. 2.
Box plots of the predicted values from a cross-validated logistic regression model using NASSA values and the BIRADS scores as predictors (a) small lesions and (b) large lesions.
Fig. 3.
Box plots of the predicted values from a logistic regression model using NASSA values and the BIRADS scores as predictors (left) small lesions and (right) large lesions for (top) observer 1 (middle) observer 2 and (bottom) observer 3.
Figure 4 shows two example images of ASSE color-overlay superimposed on the corresponding sonograms of small lesion cases. The observer outline on the NASSA feature is also displayed on the images for demonstrative purposes. Figure 5 shows additional examples so that the effectiveness of ASSE on small lesions can be better appreciated.
Fig. 4.
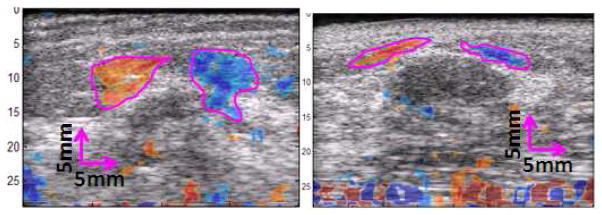
Examples showing the images of ASSE as a color-overlay on corresponding sonograms of a (left) cancer and (right) fibroadenoma. The observer’s outlines (magenta lines) of the axial-shear strain areas of interest are also shown.
Fig. 5.
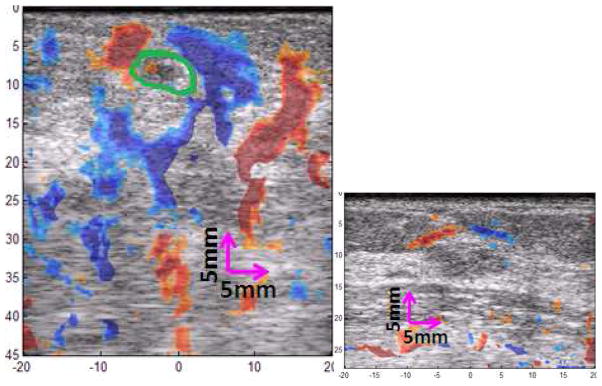
Additional example images of ASSE as a color-overlay on the sonogram of a (left) cancer and (right) fibroadenoma are shown. The observer’s outline (green line) of the tumor appearance on the sonogram of cancer is also shown.
Note that our data were acquired with a Philips HDI 1000 system with a 5 MHz transducer. It is well-known that the image quality (resolution) and the classification performance are expected to markedly improve when transducers of higher frequency are used. Nowadays, sonographic breast imaging using 10–12 MHz transducer is quite common (ACR 2009). Therefore, it is reasonable to anticipate that the usefulness of ASSE in noninvasive small breast lesion classification will likewise improve at these higher frequencies (Thitai Kumar et al. 2005).
Further, the existing data were acquired using a cumbersome set-up, involving DMC and computer-controlled precise multi-compression, and off-line processing. However, this does not limit ASSE to be operated only under this set-up. In fact, ASSE can be obtained alongside regular ASE (axial-strain elastograms) during free-hand scanning in real-time, by just updating the software to include ASSE computation. We showed a proof-of-principle demonstration in phantom experiments earlier (Reza et al. 2007) and are currently underway with prospective data in vivo data acquisition.
The current BIRADS®-US paradigm used to noninvasively classify breast lesions still results in many unnecessary benign biopsies (ACS 2008). The addition of the NASSA feature from ASSE may provide complementary and independent tools for such differentiation. Specifically, the NASSA feature may be added to other elasticity features from axial strain elastography or shear wave elastography to reclassify BIRADS® -US (Berg et al. 2012, Evans et al. 2012, Zhi et al. 2012, Thittai et al. 2011) to further improve the statistics of non-invasive classification.
In addition to the breast lesion classification application, ASSE may actually improve the detectability of the small lesions. Small tumors may be detectable even when the sonographic contrast is very low due to higher inherent contrast in ASSE. It is clear from the images shown (e.g., fig 4 left) that even though the tumor itself may be small, the axial-shear strain generated at its boundary may be large, and the characteristic pattern of different polarity in alternate quadrant may make it easier to detect the small tumor. This aspect may become very valuable, especially when guiding needle biopsy of small tumors.
CONCLUSIONS
The results suggest that the ASSE feature may work well even in small lesions to improve the standard BIRADS® –based breast lesion classification of fibroadenoma and malignant tumors. These promising results encourage further study using larger data bases.
Acknowledgments
Data used in this study were acquired previously for projects supported by NIH Program Project grants P01–CA64597 and P01–EB02105–13. The current work was supported by NIH grant R21–CA135580. The authors would like to thank Dr. Brian Garra and his team at University of Vermont for acquiring the original data that were used in this study.
Footnotes
Publisher's Disclaimer: This is a PDF file of an unedited manuscript that has been accepted for publication. As a service to our customers we are providing this early version of the manuscript. The manuscript will undergo copyediting, typesetting, and review of the resulting proof before it is published in its final citable form. Please note that during the production process errors may be discovered which could affect the content, and all legal disclaimers that apply to the journal pertain.
References
- ACR. ACR practice guideline for the performance of ultrasound-guided percutaneous breast interventional procedures. 2009 http://www.acr.org/secondarymainmenucategories/quality_safety/guidelines/breast/us_guided_breast.aspx.
- ACS. 2011 http://www.cancer.org/Cancer/BreastCancer/MoreInformation/BreastCancerEarlyDetection/breast-cancer-early-detection-importance-of-finding-early.
- ACS. 2012 http://www.cancer.org/Cancer/BreastCancer/DetailedGuide/breast-cancer-diagnosis.
- Barr RG. Evaluation of Breast Lesions Using Sonographic Elasticity Imaging: A Multicenter Trial. J Ultra Med. 2012;31:281–287. doi: 10.7863/jum.2012.31.2.281. [DOI] [PubMed] [Google Scholar]
- Berg WA, Cosgrove DO, Dore CJ, Schafer FKW, Svensson WE, Hooley RJ, Ohlinger R, Mendelson EB, Balu-Maestro C, Locatelli M, Tourasse C, Cavanaugh BC, Juhan V, Stavros AT, Tardivon A, Gay J, Henry JP, Cohen-Bacrie C. Elastography Improves the Specificity of Breast US: The BE1 Multinational Study of 939 Masses. Radiology. 2012;262:435–449. doi: 10.1148/radiol.11110640. [DOI] [PubMed] [Google Scholar]
- Burnside ES, Hall TJ, Sommer AM, Hesley GK, Sisney GA, Svensson WE, Fine JP, Jiang J, Hangiandreou NJ. Differentiating benign from malignant solid breast masses with US strain imaging. Radiology. 2007;245(2):401–410. doi: 10.1148/radiol.2452061805. [DOI] [PubMed] [Google Scholar]
- Céspedes I, Ophir J, Ponnekanti H, Maklad NF. Elastography: elasticity imaging using ultrasound with application to muscle and breastin vivo. Ultrasonic Imaging. 1993;15(2):73–88. doi: 10.1177/016173469301500201. [DOI] [PubMed] [Google Scholar]
- Evans A, Whelehan P, Thomson K, Brauer K, Jordan L, Purdie C, McLean D, Baker L, Vinnicombe S, Thompson A. Differentiating benign from malignant solid breast masses: value of shear wave elastography according to lesion stiffness combined with greyscale ultrasound according to BI-RADS classification. Br J Can. 2012;107(2):224–9. doi: 10.1038/bjc.2012.253. [DOI] [PMC free article] [PubMed] [Google Scholar]
- Fry KE. Benign Lesions of the Breast. CA Cancer J Clin. 1954;4:160–1. [Google Scholar]
- Garra BS, Céspedes I, Ophir J, et al. Elastography of breast lesions: initial clinical results. Radiology. 1997;202:79–86. doi: 10.1148/radiology.202.1.8988195. [DOI] [PubMed] [Google Scholar]
- Gibbs P, Liney GP, Lowry M, Kneeshaw PJ, Turnbull LW. Differentiation of benign and malignant sub-1 cm breast lesions using dynamic contrast enhanced MRI. The Breast. 2004;13:115–121. doi: 10.1016/j.breast.2003.10.002. [DOI] [PubMed] [Google Scholar]
- Itoh A, Ueno E, Tohno E, et al. Breast disease: clinical application of US elastography for diagnosis. Radiology. 2006;239:341–350. doi: 10.1148/radiol.2391041676. [DOI] [PubMed] [Google Scholar]
- Mathis KL, Hoskin TL, Boughey JC, Crownhart BS, Brandt KR, Vachon CM, Grant CS, Degnim AC. Palpable presentation of breast cancer persists in the era of screening mammography. J Am Coll Surg. 2010;210(3):314–8. doi: 10.1016/j.jamcollsurg.2009.12.003. [DOI] [PubMed] [Google Scholar]
- Mendelson EB, Baum JK, Berg WA, et al. BI-RADS: Ultrasound. In: D’Orsi CJ, Mendelson EB, Ikeda DM, et al., editors. Breast Imaging Reporting and Data System: ACR BI-RADS – Breast Imaging. 1. Atlas, Reston, VA: American College of Radiology; 2003. [Google Scholar]
- Ophir J, Céspedes I, Ponnekanti H, Yazdi Y, Li X. Elastography: a method for imaging the elasticity of biological tissues. Ultrasonic Imaging. 1991;13 (2):111–134. doi: 10.1177/016173469101300201. [DOI] [PubMed] [Google Scholar]
- Ophir J, Alam SK, Garra BS, Kallel F, Konofagou EE, Krouskop TA, Varghese T. Elastography: Ultrasonic Estimation and Imaging of the Elastic Properties of Tissues. Journal of Engineering in Medicine. 1999;213 (H3):203–233. doi: 10.1243/0954411991534933. [DOI] [PubMed] [Google Scholar]
- Parker KJ, Doyley MM, Rubens DJ. Imaging the elastic properties of tissue: the 20 year perspective. Phys Med Biol. 2012;57:5359–5360. doi: 10.1088/0031-9155/56/1/R01. [DOI] [PubMed] [Google Scholar]
- Regner DM, Hesley GK, Hangiandreou NJ, et al. Breast lesions: evaluation with US strain imaging—clinical experience of multiple observer. Radiology. 2006;238:425–437. doi: 10.1148/radiol.2381041336. [DOI] [PMC free article] [PubMed] [Google Scholar]
- Zahiri–Azar R, ThitaiKumar A, Ophir J, Salcudean SE. Real-time axial-shear strain elastography. Proceedings of the Sixth International Conference on Ultrasonic Measurement and Imaging of Tissue Elasticity; 2007. p. 36. [Google Scholar]
- Rosen PP, Groshen S, Kinne DW, Norton L. Factors influencing prognosis in node-negative breast carcinoma analysis of 767 T1N0M0/T2N0M0 patients with long term follow-up. J Clin Oncol. 1993;11:2090–100. doi: 10.1200/JCO.1993.11.11.2090. [DOI] [PubMed] [Google Scholar]
- Sivaramakrishna R, Gordon R. Detection of breast cancer at a smaller size can reduce the likelihood of metastatic spread: a quantitative analysis. Acad Radiol. 1997;4:8–12. doi: 10.1016/s1076-6332(97)80154-7. [DOI] [PubMed] [Google Scholar]
- Stavros AT, Rapp CL, Parker SH. Breast ultrasound. Lippincott: Williams & Wilkins; p. 1.p. 451. [Google Scholar]
- ThitaiKumar A, Krouskop TA, Garra BS, Ophir J. Visualization of Bonding at an Inclusion Boundary using Axial-Shear Strain Elastography: A Feasibility Study. Phys Med and Biol. 2007;52:2615–2633. doi: 10.1088/0031-9155/52/9/019. [DOI] [PubMed] [Google Scholar]
- ThitaiKumar A, Ophir J, Krouskop TA. Noise performance and signal-to-noise ratio of shear strain elastograms. Ultrasonic Imaging. 2005;27:145–165. doi: 10.1177/016173460502700302. [DOI] [PubMed] [Google Scholar]
- Thitaikumar A, Mobbs LM, Kraemer-Chant CM, Garra BS, Ophir J. Breast Tumor Classification using axial shear strain elastography: a feasibility study. Phys Med Biol. 2008;53:4809–4823. doi: 10.1088/0031-9155/53/17/022. [DOI] [PubMed] [Google Scholar]
- Thittai AK, Yamal J, Mobbs LM, Kraemer-Chant CM, Chekuri S, Garra BS, Ophir J. Axial-shear strain elastography for breast lesion classification: Further in vivo results from retrospective data. Ultras Med Biol. 2011;37 (2):189–197. doi: 10.1016/j.ultrasmedbio.2010.11.001. [DOI] [PMC free article] [PubMed] [Google Scholar]
- Valagussa P, Bonadonna G, Veronesi U. Patterns of relapse and survival following mastectomy. Cancer. 1978;41:1170–8. doi: 10.1002/1097-0142(197803)41:3<1170::aid-cncr2820410355>3.0.co;2-i. [DOI] [PubMed] [Google Scholar]
- Varghese T, Bilgen M, Ophir J. Multiresolution Imaging in elastography. IEEE Trans Ultrason Ferroel Freq Cont. 1998;45 (1):65–75. doi: 10.1109/58.646912. [DOI] [PubMed] [Google Scholar]
- Zhi H, Xiao XY, Ou B, Zhong WJ, Zhao ZZ, Zhao XB, Yang HY, Luo BM. Could ultrasonic elastography help the diagnosis of small (≤2cm) breast cancer with the usage of sonographic BI-RADS classification? Eur J Radiol. 2012 May 17; doi: 10.1016/j.ejrad.2012.04.016. [Epub ahead of print] [DOI] [PubMed] [Google Scholar]


