

Abstract
We sought to determine which measures of adiposity can predict cardiovascular disease (CVD) risk and to evaluate the extent to which overall and abdominal adiposity are associated with cardio-metabolic risk factors among working adults in Ethiopia. This was a cross-sectional study of 1,853 individuals (1,125 men, 728 women) in Addis Ababa, Ethiopia. The World Health Organization STEPwise approach was used to collect sociodemographic data, anthropometric measurements, and blood samples among study subjects. Fasting blood glucose (FBG) and lipid concentrations were measured using standard approaches. Spearman's rank correlation, receiver operating characteristic (ROC) curves, and logistic regression were employed to determine the association and predictive ability (with respect to CVD risk factors) of four measures of adiposity: body mass index (BMI), waist circumference (WC), waist-hip ratio (WHR), and waist–height ratio (WHtR). Overall, FBG is best associated with WHtR in men and WC in women. Systolic blood pressure most strongly associated with BMI in men, but with WC in women. Compared to those with low BMI and low WC, the risk of having CVD is the highest for those with high BMI and high WC and those with high WC and low BMI. Review of ROC curves indicated WC is the best predictor of CVD risk among study subjects. Findings from our study underscore the feasibility and face validity of using simple measures of central and overall adiposity in identifying CVD risk in resource poor settings.
Keywords: BMI, Waist Circumference, Waist to height ratio, Waist to hip ratio, MetS; Ethiopia, Africa
Introduction
Cardiovascular diseases (CVDs) are the leading causes of morbidity and mortality worldwide (1). According to the World Health Organization (WHO) Global Burden of Disease report, approximately 17.1 million people died from CVDs (29% of all global deaths) accounting for 31.5% of deaths for women, and 26.8% for men (1). As a result of an epidemiological transition attributed to increased urbanization, westernization, and globalization, many sub-Saharan African countries are experiencing lifestyle and behavioral changes in populations such as unhealthy diet, physical inactivity, and increased tobacco use (2–8). These behavioral risk factors are responsible for substantial increases in the prevalence of intermediate CVD risk factors including hypertension and obesity (9–11).
Measures of adiposity such as body mass index (BMI), waist circumference (WC), waist-hip ratio (WHR), and waist-height ratio (WHtR) have been shown to correlate differently with CVD risk (12–15). BMI is the most frequently used measure of adiposity in epidemiologic studies (12). Some investigators have reported that using BMI alone is not the most accurate measure of increased CVD risk; instead, other studies argued that WC and WHtR as better predictors of future CVD risk (12, 15). Moreover, many studies have shown that various thresholds for measures of adiposity vary among diverse ethnic groups due to differences in energy balance and physical activities as well as to variance in body build (16–18). For example, for the same level of body fat, age, and gender, BMIs of Ethiopians are 4.6 kg/m2 lower compared to Caucasians (19). Therefore, country and race/ethnicity specific assessment of associations between measures of adiposity and CVD risk factors will be necessary for prevention efforts.
Due to differences in CVD risk factors across racial/ethnic groups, there have been many studies investigating the correlation between measures of obesity and CVDs among different populations (16–20). Within two decades the prevalence of CVDs in Ethiopia has increased dramatically. According to a cross-sectional survey conducted in the mid 1990s among 15 to 24-year old young adults in Addis Ababa, Ethiopia, only 0.7% of men and 6% of women were obese, and 7.1% of the population had elevated blood pressure (21). However, in 2008 a community based study in Addis Ababa showed that 20% of men and 38% of women were overweight and 10.8% of these women were obese. In addition, 31.5% of men and 28.9% of women had high blood pressure which may represent a “silent epidemic” of CVDs in this population (22). In this study, we sought to evaluate the extent to which different measures of adiposity are associated with cardiovascular disease risk factors among working Ethiopian adults.
Methods and Procedures
Study Design and Population
This study was conducted in Addis Ababa the capital city of Ethiopia during the months of December 2009 and January 2010. Subjects were permanent employees of public schools and the Commercial Bank of Ethiopia in Addis Ababa. Workplaces were selected based on their high stability of workforce and willingness to participate in the study. Multistage sampling was done by means of probability proportional to size (PPS) sampling (23). This was performed for both institutions, and all individuals at selected locations were invited to participate. The original study population consisted of 2,207 individuals. Subjects were excluded due to missing laboratory information (n=227), missing anthropometric information (n=22), pregnancy (n=21), taking anti-hypertensive medication (n=52), and known diabetes (n=32). The final analyzed sample included 1,853 individuals (1,125 men and 728 women).
This study was conducted in accordance with the WHO's Stepwise (STEPs) approach for non-communicable disease (NCD) surveillance (24). This approach is characterized by the use of questionnaires to gain information on risk factors (Step 1), simple physical measurements (Step 2), and biochemical measurements (Step 3) (24).
Data Collection
This study employed the STEPs questionnaire which was developed specifically for NCD risk factor surveillance. The STEPs questionnaire was supplemented with additional questions to better appropriately reflect the context of Ethiopia. The questionnaire was used to obtain data regarding the general socio-demographic composition of the population by asking age, gender, and education level. Questions were included regarding behavioral risk factors such as tobacco, alcohol, physical inactivity, and khat consumption (a natural stimulant with amphetamine-like effects commonly used for social recreation in Ethiopia) (25). The questionnaire was originally written in English, translated into Amharic, and back to English by experts, and was tested prior to use. Prior to the start of the study, research interviewers and experienced research nurses were trained for five days on the contents of the questionnaire, ethical conduct of human subjects research, and data collection techniques. All study participants provided informed consent and all research protocols were approved by the Institutional Review Boards of Addis Continental Institute of Public Health, Addis Ababa, Ethiopia and the Human Subjects Division at the University of Washington, USA.
Measures of Adiposity
Four different measures of adiposity were analyzed (BMI, WC, WHR, and WHtR). Weight was measured with a solar powered scale which was accurate to 100 grams (Model 871, Seca, Germany). Height was measured with an adjustable wooden measuring board which was accurate to 0.1 cm (24). Waist circumference measurements were performed with a fixed tension tape, at the midpoint between the lower margin of the last palpable rib and the top of the iliac crest (24). This was done in a private place over light clothing. Hip circumference measurements were conducted in a similar manner, at the maximum circumference of the buttocks. To ensure the consistency among all anthropometric measures, only nurses who had high rates of agreement (<0.8 Cronbach's alpha) with the gold standard (a research physician) were used to collect anthropometric and clinical data.
Cardiovascular Risk Factors
Blood pressure was digitally measured (Microlife BP A50, Microlife AG, Switzerland) after individuals had been resting for 5 minutes. Two additional blood pressure measurements were taken with three minutes elapsing between successive measurements. In accordance with the WHO recommendation the mean systolic and diastolic BP from the second and third measurements were considered for analyses. For the collection of blood samples, individuals were advised to skip meals for 12 hours. Blood samples of 12 mL were obtained, using proper sanitation and infection prevention techniques. The collected aliquots of blood were used to determine participants' fasting blood glucose concentrations and lipid profiles. Blood serum was used for the measurement of triglycerides (TG), total cholesterol (TC), high-density lipoprotein cholesterol (HDL-C), low-density lipoprotein cholesterol (LDL-C), glucose concentrations. These were measured at the International clinical laboratory (ICL) in Addis Ababa, Ethiopia. TG concentrations were determined by standardized enzymatic procedures using glycerol phosphate oxidase assay. HDL-C was measured using the Ultra HDL assay which is a homogeneous method for directly measuring HDL-C concentrations in serum or plasma without the need for off-line pretreatment or centrifugation steps. Participants' fasting serum glucose (FSG) was determined using the standardized glucose oxidase method. All laboratory assays were completed without knowledge of participants' medical history. Lipid, lipoprotein and FSG concentrations were reported as mg-dL−1.
Analytical Variable Specification
Different thresholds of BMI were set in accordance with WHO protocol (lean: < 18.5 kg/m2; normal: 18.5–24.9 kg/m2; overweight: 25.0–29.9 kg/m2; obese ≥30 kg/m2). Several variables were defined as per the International Diabetes Federation (IDF) criteria (26). Abdominal obesity was defined as having a waist circumference of ≥94 cm for men and ≥80 cm for women. Low HDL-C was defined to be <40mg/dl in men and < 50mg/dl in women. Elevated blood pressure was defined as a systolic BP of ≥135mmHg or a diastolic pressure ≥85 mmHg. Elevated fasting blood glucose (FBG) was defined to be ≥100 mg/dL (5.6 mmol/L) or with a previous history of diabetes. Elevated TG was defined as ≥150 mg/dl. Metabolic syndrome (MetS) was defined in accordance with the IDF as presence of abdominal obesity and presence of two or more MetS components described above (26). Alcohol consumption was classified into low consumption (< 1 alcoholic beverage a week), moderate consumption (1–21 alcoholic beverages a week) and high to excessive consumption (> 21 alcoholic beverages a week) according to the WHO specification (27).
Statistical Methods
Frequency distributions of socio-demographic characteristics of the study population were determined by performing cross-tabulations of a variety of variables across gender and were expressed in percentage (%). Continuous variables were expressed as mean ± standard error of mean values. For skewed variables median ± interquartile range were provided. Chi-Square tests were used to evaluate the differences in the distribution of categorical variables for study groups. Student's T-tests were used to evaluate differences in mean values for study groups. Spearman's rank correlation coefficients were calculated between anthropometric measurements (BMI, WC, WHR, and WHtR) and CVD risk factors (fasting blood glucose, triglyceride concentrations, HDL-C concentrations, systolic BP and diastolic BP). Spearman correlation coefficients were used as they are based on non-parametric statistic and don't require a normally distributed population (28). Binary logistic regression procedures were performed to evaluate the independent and combined association of BMI and WC on risk of MetS components. For these analyses, subjects were classified as follows: (a) low BMI and low WC, (b) low BMI and high WC, (c) high BMI and low WC, and (d) high BMI and high WC. Subject with low BMI and low WC comprised the reference group for these analyses. Odds ratios (OR) and 95% confidence intervals (95% CI) were calculated. Assessment of confounders was performed by entering potential covariates such as age, place of work, smoking status, and alcohol consumption into a logistic regression model one at a time and by comparing the adjusted (aOR) and unadjusted ORs. Final logistic regression models included covariates that altered unadjusted ORs by at least 10% (29). Receiver Operating Characteristic (ROC) curves with Area Under Curve (AUC) and 95% confidence intervals were generated for BMI, WC, WHR, and WHtR as predictors of the MetS components. All data analyses were performed using PASW (version 18, SPSS Inc, Chicago, IL, USA). All reported p-values are two tailed and significance was set at 0.05.
Results
Socio-demographic and lifestyle characteristics of the study population are provided in Table 1. Overall men and women are similar with regards to their age distribution (mean age = 35.3 years) and religious affiliation. Men are more likely to be smokers, with moderate to high alcohol consumption and to report khat chewing. In contrast, women are less likely to have higher education, more likely to self report poor health status and tend to be overweight or obese. Gender-specific Spearman rank correlation coefficients for different measures of adiposity and cardiovascular disease risk factors are presented in Table 2. Overall, among men, FBG (r=0.187) is most associated with WHtR. In addition, SBP (r=0.400) is most strongly associated with BMI whereas DBP (r=0.412) is with WC. Among women, WC has strongest association with FBG (r=0.279) and SBP (r=0.410) while WHtR is most strongly associated with DBP.
Table 1.
Characteristics of the Study Population
| Men N=1,125 | Women N=728 | p-value | |
|---|---|---|---|
| Characteristic | % | % | |
| Age (years) | 0.001 | ||
| ≤24 | 18.3 | 23.2 | |
| 25–34 | 39.3 | 33.3 | |
| 35–44 | 16.2 | 17.6 | |
| 45–54 | 16.7 | 17.6 | |
| ≥55 | 9.2 | 6.2 | |
| Education | <0.001 | ||
| ≤ High school | 20.9 | 41.2 | |
| ≥ Bachelors | 79.1 | 58.8 | |
| Smoking Status | <0.001 | ||
| Never smoker | 79.3 | 99.2 | |
| Pervious smoker | 13.5 | 0.70 | |
| Current smoker | 7.2 | 0.10 | |
| Religion | <0.001 | ||
| Orthodox | 76.5 | 80.1 | |
| Muslim | 5.2 | 2.6 | |
| Protestant | 14.6 | 16.3 | |
| Other | 3.7 | 1.0 | |
| Alcohol consumption | <0.001 | ||
| Low | 44.1 | 71.0 | |
| Moderate | 55.2 | 29.0 | |
| High | 0.7 | 0.0 | |
| Khat chewing | <0.001 | ||
| No | 86.0 | 99.3 | |
| Yes | 14.0 | 0.7 | |
| Self reported health status | 0.010 | ||
| Poor/Fair | 35.8 | 41.8 | |
| Excellent | 64.2 | 58.2 | |
| Body mass index (kg/m2) | <0.001 | ||
| Underweight (<18.5) | 13.8 | 12.5 | |
| Normal (18.5–24.9) | 60.8 | 53.3 | |
| Overweight (25.0–29.9) | 23.3 | 25.3 | |
| Obese (≥30.0) | 2.0 | 8.9 |
Table 2.
Spearman's Rank Correlation Coefficients for Anthropometric Measurements and Cardiovascular Disease Risk Factors
| BMI (kg/m2) | WC (cm) | WHR | WHtR | |
|---|---|---|---|---|
| Men | ||||
| Fasting blood glucose (mg/dl) | 0.171* | 0.182* | 0.183* | 0.187* |
| Triglyceride (mg/dl) | 0.496* | 0.510* | 0.435* | 0.514* |
| HDL-C (mg/dl) | −0.083* | −0.087* | −0.071** | −0.084* |
| Systolic Blood Pressure (mmHg) | 0.400* | 0.387* | 0.311* | 0.380* |
| Diastolic Blood Pressure (mmHg) | 0.405* | 0.412* | 0.351* | 0.408* |
| Women | ||||
| Fasting blood glucose (mg/dl) | 0.200* | 0.279* | 0.269* | 0.271* |
| Triglyceride (mg/dl) | 0.454* | 0.460* | 0.381* | 0.458* |
| HDL-C (mg/dl) | −0.124* | −0.102* | −0.104* | −0.100* |
| Systolic Blood Pressure (mmHg) | 0.380* | 0.410* | 0.338* | 0.404* |
| Diastolic Blood Pressure (mmHg) | 0.401* | 0.411* | 0.329* | 0.417* |
Correlation coefficients significant at the 0.01 level;
significant at 0.05 level
Table 3 shows gender-specific distribution of CVD risk factors in relation to tertiles of different adiposity measures. For both genders, MetS components-elevated FBG, elevated TG, reduced HDL-C, and elevated BP- show increased trends across consecutive tertiles for each measure of adiposity.
Table 3.
Distribution of cardiovascular disease risk factors in relation to varying degree of adiposity as assessed using different anthropometric measures
| Measurement of Obesity | Cardiovascular Disease Risk Factors |
||||
|---|---|---|---|---|---|
| Elevated FBG | High TG | Low HDL-C | Elevated BP | ||
|
| |||||
| % | % | % | % | ||
| Among Men | |||||
| Body mass index | Tertile1 (<20.4) | 23.2 | 8.2 | 26.7 | 17.3 |
| (kg/m2) | Tertile2 (20.4–24.2) | 36.2 | 34.5 | 32.7 | 34.4 |
| Tertile3 (>24.2) | 40.6 | 57.3 | 40.7 | 48.3 | |
| Waist circumference | Tertile1 (<80.0) | 26.2 | 10.8 | 28.0 | 18.9 |
| (cm) | Tertile2 (80.0–90.0) | 33.9 | 30.8 | 30.7 | 33.3 |
| Tertile3 (≥90.0) | 39.9 | 58.8 | 41.3 | 47.8 | |
| Waist to hip ratio | Tertile1 (<0.84) | 25.1 | 13.7 | 22.7 | 18.5 |
| Tertile2 (0.84–0.91) | 29.2 | 30.4 | 38.4 | 32.1 | |
| Tertile3 (>0.91) | 45.8 | 55.8 | 38.7 | 49.4 | |
| Waist to height ratio | Tertile1 (<0.47) | 24.0 | 8.2 | 22.7 | 19.2 |
| Tertile2 (0.47–0.53) | 32.5 | 31.3 | 34.0 | 30.0 | |
| Tertile3 (≥0.53) | 34.5 | 60.5 | 43.3 | 50.8 | |
| Among Women | |||||
| Body mass index | Tertile1 (<21.3) | 25.0 | 8.00 | 27.3 | 13.8 |
| (kg/m2) | Tertile2 (21.3–25.4) | 29.3 | 30.0 | 35.1 | 29.3 |
| Tertile3 (>25.4) | 45.7 | 62.0 | 37.6 | 56.9 | |
| Waist circumference | Tertilei (<72.0) | 23.2 | 10.0 | 28.0 | 12.6 |
| (cm) | Tertile2 (72.0–86.0) | 32.3 | 29.0 | 38.3 | 33.3 |
| Tertile3 (≥86.0) | 44.5 | 61.0 | 33.7 | 54.0 | |
| Waist to hip ratio | Tertilei (<0.76) | 25.0 | 9.0 | 30.2 | 14.9 |
| Tertile2 (0.76–0.84) | 29.9 | 30.0 | 32.7 | 33.3 | |
| Tertile3 (>0.84) | 45.1 | 61.0 | 37.1 | 51.7 | |
| Waist to height ratio | Tertilei (<0.46) | 24.4 | 10.0 | 29.0 | 12.6 |
| Tertile2 (0.46–0.54) | 26.8 | 26.0 | 34.6 | 28.7 | |
| Tertile3 (≥0.54) | 48.8 | 64.0 | 36.3 | 58.6 | |
FBG = Fasting blood glucose; TG = Triglyceride; HDL-C = High Density Lipoprotein-Cholesterol; BP = Blood Pressure
We next evaluated cardiovascular risk factors in relation to combinations combined measures of overall (BMI) and central obesity (WC). After adjusting for confounding factors, compared to men with low BMI and low WC (reference group), men with low BMI and high WC have a 2.16-fold (aOR=2.16, 95% CI: 1.24–3.75) high odds of having elevated TG (Table 4a). The odds of having elevated TG are higher for men with high BMI and low WC (aOR=2.75, 95% CI: 1.67–4.53) and those with high BMI and high WC (aOR=3.48, 95% CI: 2.44–4.97). Men with low BMI and high WC have an increased odds of reduced HDL (aOR=2.21; 95% CI: 1.14–4.30) as compared with low BMI and low WC. The odds of reduced HDL are similar for men with high BMI and low WC (aOR=1.62; 95% CI: 0.85–3.07) and those with high BMI and high WC (aOR=1.54; 95% CI: 0.94–2.52), although statistical significance is not achieved. After adjusting for confounding variables, compared to reference group, men with low BMI and high WC have a 1.53-fold increased odds of elevated BP (aOR=1.53; 95% CI: 0.88–2.64). Similarly, men with high BMI and low WC and those with high BMI and high WC have higher odds of elevated BP (aOR=1.48; 95% CI: 1.07–2.03 and aOR= 2.54; 95% CI: 1.78–3.62 respectively). Similar increased odds were observed for elevated FBG although statistical significance is observed only for those with high BMI and low WC (aOR=2.30; 95% CI: 1.40–3.79).
Table 4 a.
Risk of Cardio-metabolic Disorders in Relation to Measures of Adiposity among Men
| Low BMI and Low WC | Low BMI and High WC | High BMI and Low WC | High BMI and High WC | |
|---|---|---|---|---|
| Elevated Triglyceride | 1.00 (Reference) | 3.56 (2.12–6.00) | 3.21(1.99–5.18) | 5.99 (4.31–8.32) |
| Adjusted 1 | 1.00(Reference) | 2.16 (1.24–3.75) | 2.75 (1.67–4.53) | 3.48 (2.44–4.97) |
| Trend p-value | 0.00 | |||
| Reduced HDL | 1.00 (Reference) | 2.08 (1.11–3.91) | 1.46 (0.78–2.75) | 1.32 (0.85–2.04) |
| Adjusted 1 | 1.00(Reference) | 2.21 (1.14–4.30) | 1.62 (0.85–3.07) | 1.54 (0.94–2.52) |
| Trend p-value | 0.06 | |||
| Elevated BP | 1.00 (Reference) | 2.64 (1.58–4.42) | 1.95 (1.22–3.12) | 3.99 (2.89–5.50) |
| Adjusted 2 | 1.00(Reference) | 1.53 (0.88–2.64) | 1.75 (1.07–2.84) | 2.54 (1.78–3.62) |
| Trend p-value | 0.00 | |||
| Elevated Fasting blood | 1.00 (Reference) | 1.64 (0.93–2.88) | 2.38 (1.46–3.87) | 1.71 (1.21–2.41) |
| glucose | ||||
| Adjusted 2 | 1.00(Reference) | 1.15 (0.64–2.08) | 2.30 (1.40–3.79) | 1.33 (0.91–1.95) |
| Trend p-value | 0.02 |
Adjusted for age, smoking, place of work
Adjusted for age, smoking, place of work, alcohol consumption
Among women compared with the reference group, those with low BMI and high WC have 1.89-fold increased odds of elevated TG (aOR=1.89, 95% CI: 0.91–3.95) (Table 4b). The odds of having elevated TG is the highest for those with high BMI and high WC (aOR=2.85; 95% CI: 1.51–5.39). Likewise, women with low BMI and high WC as well as those with high BMI and high WC had increased odds of having reduced HDL (aOR=2.15; 95% CI: 1.35–3.41 and aOR=2.39; 95% CI: 1.56–3.65) as compared with low BMI and low WC. Similar increased trends of ORs were observed for elevated BP, although statistical significance is observed only for those with high BMI and high WC (aOR=2.16; 95% CI: 1.32–3.56). However, statistical significance is not observed for associations of all three measures of adiposity with elevated FBG.
Table 4 b.
Risk of Cardio-metabolic Disorders in Relation to Measures of Adiposity among Women
| Low BMI and Low WC | Low BMI and High WC | High BMI and Low WC | High BMI and High WC | |
|---|---|---|---|---|
| Elevated Triglyceride | 1.00 (Reference) | 3.37 (1.70–6.67) | 1.01 (0.13–7.96) | 6.70 (3.88–11.6) |
| Adjusted * | 1.00(Reference) | 1.89(0.91–3.95) | 0.83(0.10–6.90) | 2.85(1.51–5.39) |
| Trend p-value | 0.00 | |||
| Reduced HDL | 1.00 (Reference) | 1.76(1.14–2.71) | 1.73(0.67–4.50) | 1.69(1.21–2.37) |
| Adjusted * | 1.00(Reference) | 2.15(1.35–3.41) | 1.92(0.73–5.06) | 2.39(1.56–3.65) |
| Trend p-value | 0.00 | |||
| Elevated BP | 1.00 (Reference) | 2.83(1.68–4.77) | 1.44(0.40–5.17) | 5.69 (3.76–8.61) |
| Adjusted * | 1.00(Reference) | 1.43 (0.80–2.56) | 1.23(0.32–4.76) | 2.16(1.32–3.56) |
| Trend p-value | 0.00 | |||
| Elevated Fasting Glucose | 1.00 (Reference) | 1.56(0.93–2.60) | 0.95(0.27–3.36) | 2.40(1.63–3.56 |
| Adjusted * | 1.00(Reference) | 1.05(0.60–1.84) | 0.94(0.26–3.45) | 1.42(0.87–2.31) |
| Trend p-value | 0.15 |
Adjusted for age, place of work, alcohol consumption
Review of ROC curves (Figure 1) reveals that WC (AUC=70%; 95% CI: 67–73%), and WHR (AUC=70%; 95% CI: 66–73%) perform best in identifying risk of elevated BP among men. On the other hand, WHR (AUC=60%; 95% CI: 57–64%) and WHtR (AUC=60%; 95% CI: 56–64%) are better predictors than other measures of adiposity for elevated FBG. Among women, ROC curves (Figure 2) show that WC (AUC=73%, 95% CI: 69–77%) performs best in identifying risk of elevated BP. For elevated FBG, WC (AUC=62%; 95% CI: 57–67%) was a better predictor than other measures of adiposity.
Figure I.

Receiver Operating Characteristic (ROC) curves with area under curve (AUC) and 95% confidence intervals of body mass index (BMI), waist circumference (WC), waist to hip ratio (WHR) and waist to height ratio (WHtR) for predicting cardiovascular disease risk factors among Working Ethiopian Men
Figure II.
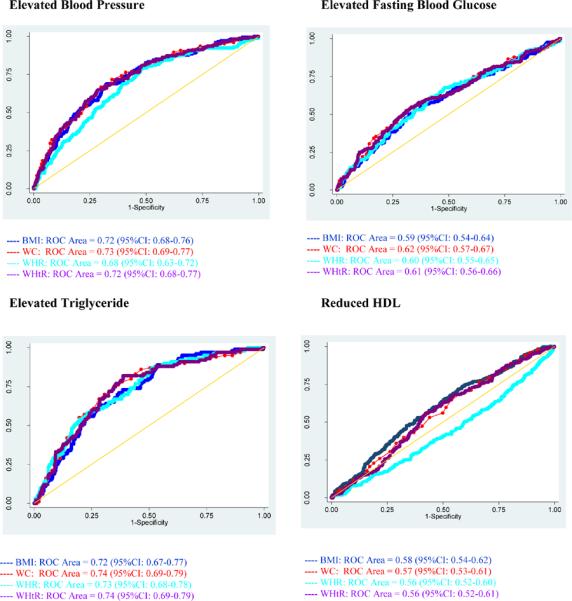
Receiver Operating Characteristic (ROC) curves with area under curve (AUC) and 95% confidence intervals of body mass index (BMI), waist circumference (WC), waist to hip ratio (WHR) and waist to height ratio (WHtR) for predicting cardiovascular disease risk factors among Working Ethiopian Women
Discussion
The results of the study show that FBG is most strongly associated with WHtR among men and WC among women. SBP is most strongly associated with BMI among men and WC among women. DBP is mostly closely correlated with WC among men but with WHtR among women. Compared to those with low BMI and low WC, the risk of having CVD is highest for those with high BMI and high WC and those with high WC and low BMI. Moreover, WC was found to be equally as good as the more complex measures in predicting CVD risk and can be well applied in relatively resource-poor settings.
Investigators have reported that BMI does not accurately reflect the degree of body fat and body fat distribution (30–31). Instead, WC has been advocated as a better indicator of abdominal fat (31). There is a large body of evidence that suggests abdominal fat distribution (measured by WC) may be more closely tied to metabolic risks than BMI (32–33). To this effect, the U.S. National Institutes of Health (NIH) has recommended combined measurements of WC and BMI as an assessment tool for CVD risk (34). Du et al in their study among Chinese adults reported increased odds of CVD risk with increased WC and BMI (30). Recently, Arden et al evaluated the risk of metabolic syndrome and its associated components among Canadian adults using the NIH BMI/WC guidelines (32). The odds of MetS are elevated among overweight (OR, 1.85; 95%CI: 1.02–3.35) and obese (OR, 2.35; 95%CI: 1.25–4.42) women with a high WC compared with overweight and obese women with a low WC, respectively (32). Moreover, Zhu et al in the U.S suggested that combined assessment of BMI and WC is more strongly related to CVD risk than BMI or WC alone in white men (35). However, Lee et al in their meta-analysis found that the combination of BMI with other measures of adiposity including WC does not increase the discriminatory capacity of predicting CVD risk (15). Differences across studies may be attributed to variations in population characteristics, sampling strategies, methods of data collection, and differences in operational definitions of characteristics. Our study findings are in agreement with those reported by others (32, 35). After adjusting for potential confounders, in both genders, compared with the high BMI and low WC group, those with high BMI and high WC group have higher aORs for each metabolic component (aOR range 1.33–3.48). Notably, among women, risk for each MetS component is higher in low BMI and high WC group than in high BMI and low WC group suggesting using BMI alone as a measure of CVD risk assessment may not be sufficient.
A number of studies have evaluated the association between CVD risk and measures of central and overall adiposity among diverse ethnic groups (16–19). However, there is no consensus as to which measure of adiposity best predicts CVD risk. Although BMI is widely used to evaluate obesity and risk of CVD, there have been many studies suggesting that other measures of adiposity such as WC, WHR, and WHtR are superior measures compared to BMI in predicting CVD risk (12–15). Paniagua et al observed that among Thai men, WHR (AUC = 65–69%) performed slightly better than other measures in identifying differences in CVD risk factors while among women, BMI (AUC = 68–75%) performed as well as, or better than, other adiposity measures in predicting all CVD risk factors (36). Lin et al in their study among Taiwanese adults reported WHtR as a better indicator in determining CVD risks (among men: AUC= 70% and among women: AUC = 76%) (37). However, Esmaillzadeh et al in their study of Iranian adults in Tehran reported that WHR was the best measure of adiposity in predicting CVD risk for men, while WC was best for predicting CVD in women (38–39). In our study, among the four measures of adiposity, WHtR and WHR are most strongly and consistently associated with MetS components among men although WC is also the best predictor for elevated BP. On the other hand, with the exception of reduced HDL-C, WC is most strongly and consistently associated with MetS components among women. Although BMI has been the most common measure of adiposity, it is limited in distinguishing between excess adipose tissue and high muscle mass. Based on BMI alone, two individuals of the same height and weight will be considered to have the same CVD risk regardless of their respective visceral adiposity. Although WC is a simple measure of adiposity, it determines CVD risks solely on the waist girth and does not take height into account. WHtR and WHR, on the other hand, reflect the body fat distribution as well as measure of height, and have been shown to be more associated with CVD risks than body weight (15).
The generally accepted biological mechanism for the observed association between measures of adiposity and CVD risk factors lies with the fact that visceral fat is drained by the portal venous system, unlike subcutaneous fat (12, 40). This entails a direct connection to the liver which results in a higher level of free fatty acids in the liver. Increased secretion of VLDL-C ensues, leading to increased hepatic lipase activity, and lower HDL-C levels (12). Additionally, the influx of free fatty acids in the liver decreases hepatic insulin extraction thereby inhibiting the suppression of glucose production and leading to higher plasma glucose levels (12).
Results from this study should be understood in wake of a few limitations. First, because of this cross-sectional data collection design, we cannot be certain of the temporal relation between WC and/or BMI and CVD risk. Prospective cohort studies can better compare the prognostic value of WC and BMI in the prediction of CVD risk factors. Second, this study was conducted amongst fairly well-educated and urban workers. Thus it is possible that the results may not be generalizable to the broader Ethiopian population. Additionally, data from the questionnaires is subject to recall and social desirability biases. This may have led to some degree of error in the reporting of smoking status, physical activity, and various other behavioral covariates.
Findings from our study and others underscore the importance of incorporating simple measures of adiposity like WC and BMI in clinical practice to identify CVD risk factors. Application of simple adiposity measures, in a sequential fashion, may be used to improve identification of CVD risk, in addition to assisting patients in the adoption of risk reducing behavior. However, additional research is required to determine appropriate clinical thresholds for Ethiopia adults. The complete absence of any CVD risk factor surveillance mechanism in Ethiopia attests to the significance of this study. The ability to estimate risk for CVDs from simple anthropometric measurements such as WC, height, and weight, is beneficial in resource limited settings where the health care infrastructure is less developed. This is highly applicable for Ethiopia's urban health extension workers serving areas where the prevalence of CVDs is high and where biochemical testing is not always available. Given the anticipated increased in the prevalence of CVDs in Ethiopia, the establishment of a simple metric for CVD risk assessment will be of great utility although readers should exercise caution in the interpretation of these results so as to not overstate the predictive power of these measures of adiposity.
Acknowledgements
This research was completed while Ms. Wint Wai and Mr. Ranjodh Dhami were research training fellows with the Multidisciplinary International Research Training (MIRT) Program of the University and Washington, School of Public Health. The MIRT Program is supported by an award from the National Institutes of Health, National Center on Minority Health and Health Disparities (T37-MD001449). The authors wish to thank Addis Continental Institute of Public Health for providing facilities and logistics support throughout the research process. The authors would also like to thank the Commercial Bank of Ethiopia and Addis Ababa Education Office for granting access to conduct the study and International Clinical Laboratories for completing all laboratory analyses.
References
- 1.Mathers C, Fat DM, WHO. Boerma JT. The Global Burden of Disease 2004 Update. World Health Organization; Geneva: 2004. pp. 1–27. [Google Scholar]
- 2.Omran A. The epidemiologic transition. A theory of the Epidemiology of population change. Bull World Health Organ. 2001;79:161–70. [PMC free article] [PubMed] [Google Scholar]
- 3.Popkin B. Dynamics of the nutrition transition and its implications for the developing world. Forum Nutr. 2003;56:262–4. [PubMed] [Google Scholar]
- 4.BeLue R, Okoror TA, Iwelunmor J, Taylor KD, Degboe AN, Agyemang C, et al. An overview of cardiovascular risk factor burden in sub-Saharan African countries: a sociocultural perspective. Globalization and Health. 2009;5:10. doi: 10.1186/1744-8603-5-10. [DOI] [PMC free article] [PubMed] [Google Scholar]
- 5.Fezeu L, Minkoulou E, Balkau B, Kengne A, Awah P, Unwin N, et al. Association between socioeconomic status and adiposity in urban Cameroon. Int J Epidemiol. 2006;35:105–11. doi: 10.1093/ije/dyi214. [DOI] [PubMed] [Google Scholar]
- 6.Reddy K, Yusuf S. Emerging epidemic of cardiovascular disease in developing countries. Circulation. 1998;97:596–601. doi: 10.1161/01.cir.97.6.596. [DOI] [PubMed] [Google Scholar]
- 7.Kadiri S, Salako B. Cardiovascular risk factors in middle aged Nigerians. East Afr Med J. 1997;74:303–6. [PubMed] [Google Scholar]
- 8.Vorster H. The emergence of cardiovascular disease during urbanization of Africans. Public Health Nutr. 2002;5:239–43. doi: 10.1079/phn2001299. [DOI] [PubMed] [Google Scholar]
- 9.D'Agostino RB, Hamman RF, Karter AJ, Mykkanen L, Wagenknecht LE, Haffner SM. Cardiovascular disease risk factors predict the development of type 2 diabetes. Diabetes Care. 2004;7:2234–40. doi: 10.2337/diacare.27.9.2234. [DOI] [PubMed] [Google Scholar]
- 10.Kenchaiah S, Gaziano J, Vasan R. Impact of obesity on the risk of heart failure and survival after the onset of heart failure. Med Clin North Am. 2004;88:1273–94. doi: 10.1016/j.mcna.2004.04.011. [DOI] [PubMed] [Google Scholar]
- 11.World Health Organization . Obesity: preventing and managing the global epidemic. World Health Organization; Geneva: 2000. pp. 101–142. [PubMed] [Google Scholar]
- 12.Menke A, Muntner P, Wildman RP, Reynolds K, He J. Measurs of adiposity and cardiovascular disease risk factors. Obes Res. 2007;15:785–95. doi: 10.1038/oby.2007.593. [DOI] [PubMed] [Google Scholar]
- 13.Abubakari AR, Bhopal RS. Systematic review on the prevalence of diabetes, overweight/obesity and physical inactivity in Ghanaians and Nigerians. Public Health. 2008;122:173–82. doi: 10.1016/j.puhe.2007.06.012. [DOI] [PubMed] [Google Scholar]
- 14.Ntandou G, Delisle H, Agueh V, Fayomi B. Abdominal obesity explains the positive rural-urban gradient in the prevalence of the metabolic syndrome in Benin, West Africa. Nutr Res. 2009;29:180–9. doi: 10.1016/j.nutres.2009.02.001. [DOI] [PubMed] [Google Scholar]
- 15.Lee CM, Huxley RR, Wildman RP, Woodward M. Indices of abdominal obesity are better discriminators of cardiovascular risk factors than BMI: a meta-analysis. J Clin Epidemiol. 2008;61:646–53. doi: 10.1016/j.jclinepi.2007.08.012. [DOI] [PubMed] [Google Scholar]
- 16.Lear SA, James PT, Ko GT, Kumanyika S. Appropriateness of waist circumference and waist-to-hip ratio cutoffs for different ethnic groups. Eur J Clin Nutr. 2010;64:42–61. doi: 10.1038/ejcn.2009.70. [DOI] [PubMed] [Google Scholar]
- 17.Norgan NG. Population differences in body composition in relation to the body mass index. Eur J Clin Nutr. 1994;48:10–27. [PubMed] [Google Scholar]
- 18.Norgan NG. Interpretation of low body mass indices: Australian aborigines. Am J Phys Anthropol. 1994;94:229–37. doi: 10.1002/ajpa.1330940207. [DOI] [PubMed] [Google Scholar]
- 19.Deurenberg P, Yap M, van Staveren WA. Body mass index and percent body fat: a meta analysis among different ethnic groups. Int J Obes Relat Metab Disord. 1998;22:1164–71. doi: 10.1038/sj.ijo.0800741. [DOI] [PubMed] [Google Scholar]
- 20.Cappuccio FP, Cook DG, Atkinson RW, Strazzullo P. Prevalence, detection, and management of cardiovascular risk factors in different ethnic groups in south London. Heart. 1997;78:555–63. doi: 10.1136/hrt.78.6.555. [DOI] [PMC free article] [PubMed] [Google Scholar]
- 21.Betre M, Kebede D, Kassaye M. Modifiable risk factors for coronary heart disease among young people in Addis Ababa. East Afr Med J. 1997;74:376–81. [PubMed] [Google Scholar]
- 22.Tesfaye F, Byass P, Wall S. Population based prevalence of high blood pressure among adults in Addis Ababa: uncovering a silent epidemic. BMC Cardiovasc Disord. 2009;9:39. doi: 10.1186/1471-2261-9-39. [DOI] [PMC free article] [PubMed] [Google Scholar]
- 23.World Health Organization . Primary Health Care Management of Trachoma. World Health Organization; Geneva: 1993. pp. 31–40. [Google Scholar]
- 24.World Health Organization . STEPs manual. World Health Organization; Geneva: 2008. pp. 21–468. [Google Scholar]
- 25.Getahun W, Gedif T, Tesfaye F. Regular Khat (Catha edulis) chewing is associated with elevated diastolic blood pressure among adults in Butajira, Ethiopia: a comparative study. BMC Public Health. 2010;10:390. doi: 10.1186/1471-2458-10-390. [DOI] [PMC free article] [PubMed] [Google Scholar]
- 26.Alberti KG, Zimmet P, Shaw J. Metabolic syndrome--a new world-wide definition. A Consensus Statement from the International Diabetes Federation. Diabet Med. 2006;23:469–80. doi: 10.1111/j.1464-5491.2006.01858.x. [DOI] [PubMed] [Google Scholar]
- 27.World Health Organization . Global status report on alcohol. WHO, Department of Mental Health and Substance Abuse; Geneva: 2004. pp. 1–34. [Google Scholar]
- 28.Altman DG. Practical statistics for medical research. Chapman & Hall; London: 2010. [Google Scholar]
- 29.Rothman KJ, Greenland S. Modern epidemiology. Lippincott-Raven; Philadelphia: 1998. pp. 8–387. [Google Scholar]
- 30.Du SM, Ma GS, Li YP, Fang HY, Hu XQ, Yang XG, et al. Relationship of body mass index, waist circumference and cardiovascular risk factors in Chinese adult. Biomed Environ Sci. 2010;23:92–101. doi: 10.1016/S0895-3988(10)60037-2. [DOI] [PubMed] [Google Scholar]
- 31.Hsieh SD, Yoshinaga H, Muto T. Waist-to-height ratio, a simple and practical index for assessing central fat distribution and metabolic risk in Japanese men and women. Int J Obes Relat Metab Disord. 2003;27:610–6. doi: 10.1038/sj.ijo.0802259. [DOI] [PubMed] [Google Scholar]
- 32.Arden CI, Katzmarzyk PTJ, I, Ross R. Discrimination of health risk by combined body mass index and waist circumference. Obes Res. 2003;11:135–42. doi: 10.1038/oby.2003.22. [DOI] [PubMed] [Google Scholar]
- 33.Janssen I, Katzmarzyk PT, Ross R. Body mass index, waist circumference, and health risk: evidence in support of current National Institutes of Health guidelines. Arch Intern Med. 2002;162:2074–9. doi: 10.1001/archinte.162.18.2074. [DOI] [PubMed] [Google Scholar]
- 34.National Institute of Health . The Practical Guide to the Identification, Evaluation and Treatment of Overweight and Obesity in Adults. National Institute of Health; Bethesda: 2000. pp. 1–23. [Google Scholar]
- 35.Zhu S, Heshka S, Wang Z, Shen W, Allison DB, Ross R, et al. Combination of BMI and Waist Circumference for Identifying Cardiovascular Risk Factors in Whites. Obes Res. 2004;12:633–45. doi: 10.1038/oby.2004.73. [DOI] [PubMed] [Google Scholar]
- 36.Paniagua L, Lohsoonthorn V, Lertmaharit S, Jiamjarasrangsi W, Williams M. Comparison of waist circumference, body mass index, percent body fat and other measures of adiposity in indentifying cardiovascular disease risks among Thai adults. Obesity Research & Clinical Practive. 2008;2:215–23. doi: 10.1016/j.orcp.2008.05.003. [DOI] [PMC free article] [PubMed] [Google Scholar]
- 37.Lin WY, Lee LT, Chen CY, Lo H, Hsia HH, Liu IL, et al. Optimal cut-off values for obesity: using simple anthropometric indices to predict cardiovascular risk factors in Taiwan. Int J Obes Relat Metab Disord. 2002;26:1232–8. doi: 10.1038/sj.ijo.0802040. [DOI] [PubMed] [Google Scholar]
- 38.Esmaillzadeh A, Mirmiran P, Azizi F. Comparative evaluation of anthropometric measures to predict cardiovascular risk factors in Tehranian adult women. Public Health Nutr. 2006;9:61–9. doi: 10.1079/phn2005833. [DOI] [PubMed] [Google Scholar]
- 39.Esmaillzadeh A, Mirmiran P, Azizi F. Waist-to-hip ratio is a better screening measure for cardiovascular risk factors than other anthropometric indicators in Tehranian adult men. Int J Obes Relat Metab Disord. 2004;28:1325–32. doi: 10.1038/sj.ijo.0802757. [DOI] [PubMed] [Google Scholar]
- 40.Canoy D. Distribution of body fat and risk of coronary heart disease in men and women. Curr Opin Cardiol. 2008;23:591–8. doi: 10.1097/HCO.0b013e328313133a. [DOI] [PubMed] [Google Scholar]