

Abstract
Multiphoton microscopy (MPM) is widely used for optical sectioning deep in scattering tissue, in vivo [1–2]. Phosphorescence lifetime imaging microscopy (PLIM) [3] is a powerful technique for obtaining biologically relevant chemical information through Förster resonance energy transfer and phosphorescence quenching [4–5]. Point-measurement PLIM [6] of phosphorescence quenching probes has recently provided oxygen partial pressure measurements in small rodent brain vasculature identified by high-resolution MPM [7, 8]. However, the maximum fluorescence generation rate, which is inversely proportional to the phosphorescence lifetime, fundamentally limits PLIM pixel rates. Here we experimentally demonstrate a parallel-excitation/parallel collection MPM-PLIM system that increases pixel rate by a factor of 100 compared with conventional configurations while simultaneously acquiring lifetime and intensity images at depth in vivo. Full-frame three-dimensional in vivo PLIM imaging of phosphorescent quenching dye is presented for the first time and defines a new platform for biological and medical imaging.
Current technologies for overcoming the fundamental pixel rate limitation of serial-acquisition MPM require parallel excitation and imaging a sample onto multi-element detectors (typically CCD) [9–10]. While satisfactory for thin tissue slices or non-scattering samples, thick scattering samples typically encountered in in vivo applications cause crosstalk between excited pixels when imaged onto a detector array, resulting in smeared images [11]. State-of-the-art fast fluorescence lifetime imaging microscopy systems utilize parallel excitation (e.g. LED arrays or pulsed diode excitation) or collection (e.g. gated CCD, single photon avalanche diode array, or multichannel PMT) [12] for video rate acquisition [13, 14]. These systems have been applied to oxygen sensing [15, 16], but are similarly limited by excitation and emission crosstalk and cannot resolve 3D optical sections.
PLIM acquisition rates in phosphorescence quenching systems are further limited by long dye lifetime (τ>1μs), which require low repetition rate lasers and long pixel dwell times (T≫τ). Lifetime measurement rates of phosphorescent dyes often-used in oxygen sensing [5, 7, 8, 17, 18, 19] are thus limited to <10Hz at depth [8]. Although these systems provide valuable measurements at specific points within tissue (e.g. partial pressure of oxygen within specific vascular compartments), full-frame optical sectioning measurements of phosphorescent quenching at depth is impractical.
This paper experimentally demonstrates a parallel-excitation/parallel-collection MPM-PLIM system that achieves high-pixel-rate, simultaneous lifetime and intensity imaging at depth in vivo. Our method, unlike prior parallel image acquisition approaches, does not require imaging of signal photons, thus eliminating the impact of signal scattering. Furthermore, in MPM, ballistic photons dominate the nonlinear excitation [20] until the imaging depth is many times the scattering length (e.g., ~ 1 mm in biological tissues) [21]; therefore, cross-talk from scattered excitation photons between neighboring pixels is eliminated. In this technique, called multifocal multiphoton modulation microscopy (M4), each point in the sample is uniquely intensity modulated. The entire emitted signal is collected onto a single element detector. Spatial information is recovered via signal frequency demodulation and pixel location is independent of sample-induced scattering. Each modulation frequency’s magnitude and phase is mapped to fluorescence intensity and lifetime, respectively, for each pixel in the sample. Similar imaging techniques have been employed when detector arrays are impractical [22] and fluorescence imaging [23, 24].
Assuming perfect sinusoidal modulation for simplicity, the modulated illumination excites a two-photon fluorescence response:
| (1) |
where Si is the cycle averaged signal strength; ωi is the modulation angular frequency; θi and ωi are, respectively, the phase delay due to the finite fluorescence lifetime (τi) at the fundamental modulation frequency ωi and its second harmonic 2ωi at the ith-pixel. All fundamental modulation frequencies (ωi) are within a single octave to avoid crosstalk between the fundamental and second harmonic terms. Thus, the number of resolvable pixels is limited by the number of resolvable frequencies, given by , where ω0 is the lowest modulation frequency and T is the dwell time.
Complex demodulation of the emission signal yields the complete set of Si and θi for all ωi. The value of ωi corresponds to the position of the ith-pixel, while Si gives the pixel intensity and θi can be used to calculate the fluorescence lifetime [3]:
| (2) |
For optimum measurement of fluorescence lifetimes near τtarget, the angular modulation frequencies should be near [25, 26]. M4 is capable of variable modulation frequency to increase dynamic range. Furthermore, by restricting the modulation frequencies to one octave, the entire range of modulation frequencies across the sample is within the flat optimum in photon efficiency [25].
The experimental set-up is described in Fig. 1. A mode-locked Ti:Sapphire laser is used as the excitation source (λ = 780 nm, ~100 fs pulse width, and 80 MHz repetition rate with power in the range of 80 to 150 mW at the sample). We first focus the beam to a line using a 10 cm cylindrical lens (CL). This line illumination then impinges onto a one-dimensional spatial light modulator (SLM), generating a linear array of point sources with each point source modulated by different frequency (this process is described in the Methods section “Custom Reflection Based Linear Spatial Light Modulator” and top dashed box in Fig 1). The linear point source array is imaged onto the sample to excite fluorescence, forming a one-to-one mapping between the modulation frequency and the pixel, i.e., the spatial information along the focused line is encoded in the frequency domain by modulating the excitation light intensity. The excited nonlinear signal is epi-collected through the objective and reflected off a dichroic mirror onto a large area photomultiplier tube (PMT) (e.g. Hamamatsu H7422P-40). The dichroic mirror also reflects a small amount (< 1%) of the 780 nm excitation light onto a Si photodiode, which acts as a reference channel for fluorescence/phosphorescence lifetime measurements. The signal and reference channels are then processed as complex spectrograms to reconstruct, respectively, the reference image and sample image: The modulation frequency is mapped to the y-axis, and time is mapped to the x-axis. The brightness of each pixel is determined by the magnitude measured in the signal spectrogram. The fluorescence/phosphorescence lifetime of each pixel is determined by the difference in measured phase between the signal and reference spectrograms. Data is collected on a 10 MHz National Instruments DAQ (PCI-6110) card and calculations are performed in real-time in LabView (National Instruments Corporation). Post processing and further data analysis was performed with custom scripts in MATLAB (The Mathworks Inc.).
Fig. 1.
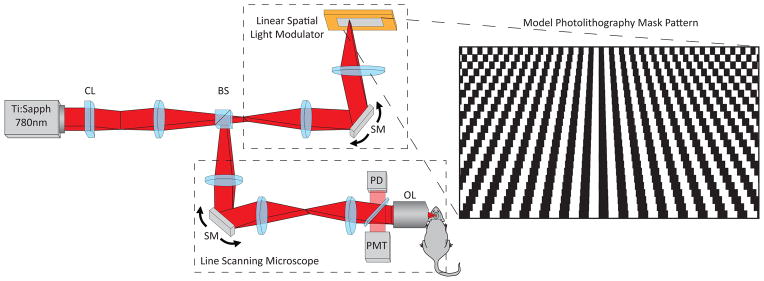
Schematic of the M4 microscope. CL: cylindrical lens; BS: beam splitter; SM: scan mirror; PD: photodiode; PMT: photo-multiplier tube; OL: objective lens. Inset: Illustration of the spatial light modulator
An intuitive understanding of our technique can be obtained by considering sub-carrier multiplexing, a standard communication technique. Each data channel is encoded in its distinct carrier radio frequency (RF). A simple RF tuner then selects the desired band and filters out the rest. In the M4 PLIM system, each pixel in space acts like an independent data channel emitting at distinct frequency that can be decoded to form a spatial image using the frequency-to-space correlation.
The M4 excitation and collection scheme is similar to that of line-scanning MPM. However, the prominent difference is each excitation point along the line is intensity modulated at a unique frequency by a custom, reflection-based linear spatial light modulator capable of modulating up to ~1 MHz and corresponding to emission lifetimes of ~100 ns. For faster fluorescence lifetimes, commercially available polygon scan mirrors [27, 28] (SA24 & 72 sided polygon, Lincoln Laser Corp) can further increase modulation rates to 60 MHz, corresponding to a lifetime resolution of ~50 ps and suitable for a wide range of biological fluorescent lifetime measurements. Alternatively, a 2D digital micromirror device (DMD) or digital MEMs array can replace our linear SLM to achieve simultaneous full-field imaging by uniquely modulating and imaging a 2D array of pixels onto the sample. Commercially available DMD kits (DLP4X00KIT, Texas Instruments) already can achieve 16kHz modulation rates, suitable for wide-field M4 PLIM imaging of oxygen sensing dyes
Fig. 2 demonstrates the M4 concept by imaging a 1951 USAF Resolution Test Chart and collecting the reflected light signal on a large-area silicon photodiode. The signal at the diode is divided into consecutive time windows corresponding to adjacent image lines with spatial information encoded in the frequency domain. Signal demodulation reconstructs the original image.
Fig. 2.

M4 data processing and image reconstruction. Original (a-top) and processed (b-bottom) data of a reflection image of a 1951 Air Force test target with a 60x 1.10NA water immersion objective. The smallest features are 2.2 μm × 11.0 μm. The inset of (a): raw data corresponding to three lines in the image.
M4 axial and lateral resolution of two-photon excited fluorescence were measured by imaging 0.5μm diameter fluorescent (505/515) beads (Invitrogen) in a 3% agarose gel with a 0.75NA 20x objective. The lateral extent (FWHM) of the 0.5 μm bead was measured to be 1.13 μm and 0.73 μm along the frequency and time axes, respectively. The axial extent measured 4.0μm. Lateral resolution along the frequency resolved dimension is limited by the demagnification of the modulator onto the sample.
Although multiplexing significantly increases the pixel rate of M4 versus serial point scanning PLIM systems, M4 suffers additional noise. Shot noise generated at a single pixel (i.e. modulation frequency) is shared among all simultaneously imaged pixels. Since two-photon eliminates cross-talk from the excitation and collection of photons, Shot noise is the dominant noise term. To address this concern, the microscope was adapted to perform both M4 and standard serial acquisition point scanning PLIM. Ru(dpp3)2+ [18] dyed tissue fibers were imaged using both techniques at equivalent sample illumination (i.e. equivalent fluorescence generation rate per pixel). This criterion was chosen since maximum fluorescence generation rate is the ultimate limitation on fluorescence imaging pixel rate for a large class of problems where the generation rate of signal photons poses the fundamental limit to imaging speed. Therefore, the fair comparison is to excite samples in both systems close to the maximum generation rate and determine the relative error. The results shown in Fig. 3 demonstrate two orders of magnitude improvement in pixel acquisition rate for M4 over point scanning MPM-PLIM.
Fig. 3.

Lifetime measurement uncertainty vs. pixel integration time in Ru(dpp3) dyed tissue fiber, comparing M4 against point scanning PLIM.
Significant interest exists in functional imaging of pO2 in brain vasculature during stimulation [16, 29]. Recent work demonstrated functional imaging measurements at depth [8]. However, no oxygen sensing system produced 3D fluorescence/phosphorescence lifetime imaging of a heterogeneous lifetime system in a scattering medium (e.g., in vivo).
To demonstrate M4 in vivo, we injected Ru(dpp3)-pluronic-nanomicelle probes into FVB/n mouse vasculature retro-orbitally. Optical access to the brain was achieved via a cranial window. Simultaneous intensity and lifetime optical sections are acquired by M4 (Fig. 4). Blood vessels are clearly present in the intensity M4 image (Fig. 4a), and phase is mapped to fluorescence lifetime with increasing averaging (Fig. 4b–d; Supplemental Video 1). Lifetime histograms of interior vascular compartments (800 pixels) displayed in Fig. 4(b–d) are presented in (e) from top to bottom, respectively. Image frames are 500×160 pixels with 85 mW optical power at the sample; the modulation rates range from 32–64 kHz. Fig. 4f and Supplemental Video 2 demonstrates simultaneous intensity and lifetime optical sections at 10 micron steps and 3 minute averaging per frame.
Fig 4.
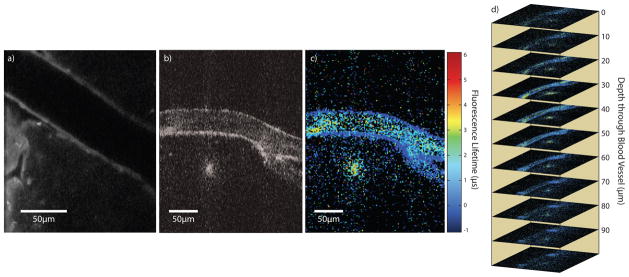
Mouse brain vasculature containing Ru(dpp3)-pluronic-nanomicelle probes imaged by M4. Phosphorescence intensity (a); phosphorescence lifetime after 20 s (b), 1 min (c) and 5 (d) of integration; lifetime histograms (e), from top to bottom, of 800 pixels from the interior of the blood vessel from images (b–d), respectively; and optical sections separated by 10 μm through brain vasculature (f) are presented. Images (b–i) map lifetime to hue and intensity to value to illustrate simultaneous lifetime and intensity acquisition. Images (f–i) are optical sections of brain vasculature each separated by 10 μm.
A heterogeneous in vivo sample was prepared by injecting Ru(dpp3)-pluronic-nanomicelle probes into a fluorescent protein (DsRed) labeled mouse retro-orbitally. Conventional two photon microscopy shows that DsRed is expressed predominately in the blood vessel walls in the absence of dye (Fig. 5a). Optical sections of Ru(dpp3) in DsRed labeled mouse vasculature were obtained in 10 micron steps through a blood vessel. The simultaneously acquired intensity and lifetime images are presented in Figs. 5b and 5c, respectively. It is clear that the blood vessel walls contain fast lifetime (τ ≪ 1 μs) DsRed fluorescence while Ru(dpp3)-nanomicelle dye (τ~2.5μs) is localized in the vessel interior. The M4-PLIM optical stack of 11 full-frames through 110 μm is presented in Fig 5(d) and Supplemental Video 3, and represents, to our knowledge, the deepest in vivo PLIM imaging of phosphorescence quenching dye. The modulation frequencies are between 64 kHz and 128 kHz, the frame period is 3 minutes 20 seconds, and the average photon rate was less than 500 kHz (corresponding to a low photon generation rate per pixel of 1 kHz). The frame size is 256×500 pixels, yielding a PLIM pixel rate of 640 Hz. This is significantly faster than previously reported long lifetime two-photon PLIM imaging in a similar system (pixel rates of ~1 Hz [8]). M4 pixel rates can be greatly improved by increasing the photon generation rate with improved dyes or higher excitation pulse energy at sample.
Fig. 5.
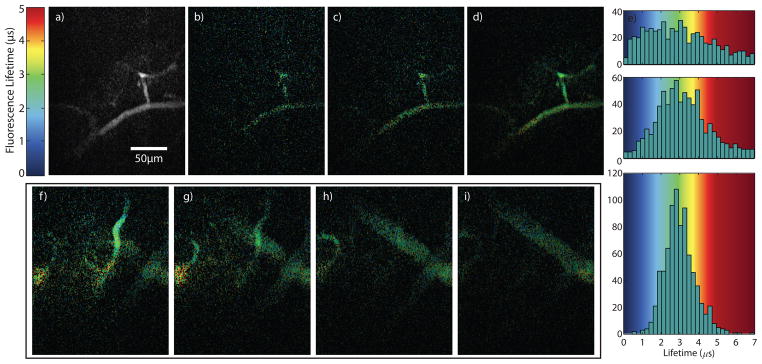
M4 and conventional two-photon microscopy of DsRed labeled mouse brain vasculature, in vivo. Conventional point scanning MPM of mouse brain blood vessel labeled with DsRed (a) prior to Ru(dpp3) injection. M4 intensity (b) and lifetime (c) maps of DsRed labeled mouse brain after injection of phosphorescent Ru(dpp3)2+ dye. Lifetime sections were taken at 10 μm steps through the blood vessel (d) after injection of Ru(dpp3)2+ dye.
In summary, we experimentally demonstrated a parallel-excitation/parallel-collection MPM-PLIM system that achieves high-pixel rate while simultaneously acquiring lifetime and intensity images at depth in vivo. By mapping spatial positions to modulation frequencies, image smearing due to signal scattering is avoided. M4 provides a two orders of magnitude improvement in pixel rate over serial acquisition PLIM, and allows, for the first time, full-frame three-dimensional lifetime imaging of a heterogeneous sample containing phosphorescence quenching probe.
METHODS SECTION
Custom Reflection Based Linear Spatial Light Modulator
High modulation rates are required (e.g., ~ 100 kHz used in our experiments) to resolve distinct points along the line and to optimally match the desired fluorescence/phosphorescence lifetime. Since commercially available linear SLMs with the required pixel numbers cannot modulate at such high speeds, we created a free-space optical chopper (Fig. 1a, dashed box) that can modulate an array of point sources at MHz rates by scanning a line-focused laser beam over a small (10–20 μm period) mirror grating on a photolithography mask (Fig. 1b). Each horizontal line on the photolithography mask has a different spatial frequency. The reflected light is then descanned by the same scan mirror, and is imaged onto the sample by the line scanning microscope. The spatial frequencies are limited to one octave to avoid crosstalk between the fundamental modulation frequency and higher harmonics generated by the nonlinear response of the dye and deviations from a perfect sinusoidal modulation.
Serial Acquisition Two Photon PLIM Microscope
A serial acquisition frequency domain PLIM microscope was built to compare the pixel rate improvement of M4 over serial acquisition PLIM microscopy. The same M4 microscope described in Methods is used for both parallel and serial acquisition. The microscope is modified for serial acquisition by removing the first cylindrical lens. A conventional point focus is then obtained on both the sample and spatial light modulator. The spatial light modulator thus acts as an optical chopper and intensity modulates the excitation beam. The input optical power is adjusted so that the excitation intensity at the sample is identical in both parallel and serial acquisition.
The pixel rate comparison was performed by measuring the relative lifetime uncertainty of identical regions of an Ru(dpp3) dyed lens-paper with both M4 and serial point scanning MPM-PLIM in the frequency domain as a function of pixel dwell time.
Lifetime measurement calibration
The lifetime measurements were calibrated by measuring the phase delay of a signal produced by reflecting the excitation beam off of a mirror surface at the sample. Since optical delay is negligible (<1ns), any measured delay can be attributed to latent delays in the system electronics (detectors and amplifiers). This calibration is performed before PLIM imaging and included in the lifetime calculations.
Preparation and demonstration of phosphorescence quenching Ru(dpp3)2+ encapsulated nanomiscelles
Water soluble Ru(dpp3)2+-pluronics nanomicelles were prepared [30]. For the solution, 4 mg of Ru(dpp3)Cl2 (Alfa Aesar) was dissolved in 100 μl of chloroform and added to 5 ml of Pluronic F68 or F127 (2 wt. %) aqueous solution. The solution was pre-emulsified by stirring for 15 min, followed by 15 min agitation in an ultrasonic bath (150 W). After producing the microemulsion, the chloroform was evaporated off by stirring the mixture while heating in a regulated 50°C bath for 30 minutes.
Phosphorescent quenching of Ru(dpp3)2+ encapsulated in pluronic nanomicelles was demonstrated by comparing the measured phosphorescence lifetimes of pools of oxygenated and deoxygenated dye. Two 100 μL well slides were filled with the dye solution. An excess of enzymatic system for oxygen removal (glucose/glucose oxidase/catalase) was added to one of the wells before both were sealed. The measured lifetime for the oxygenated and deoxygenated solution were 1.5μs (oxygen quenching at atmosphere) and 2.0μs (oxygen depletion), respectively. The lifetime values are within a factor of 2 of the lifetime of Ru(Dpp3)2+ dissolved in ethylene glycol [18], however additional work is needed to properly characterize this dye-nanomicelle dissolved in water if it is to be used as an oxygen sensing probe.
Animal preparation and surgery
All animal procedures were reviewed and approved by the Cornell Institutional Animal Care and Use Committee. FVB/n (Charles River Laboratories) and (Tg(ACTB-DsRed*MST)1Nagy/J) mice were anesthetized using isoflurane (MWI) (4% in O2 for induction, 1.5–2 % in O2 for surgery and imaging) and was hydrated with 50 μL/hour subcutaneous injections of 5% glucose (Sigma) in saline (MWI). Body temperature was maintained with a feedback-controlled heat blanket (Harvard Apparatus). Prior to surgery, glycopyrrolate and dexamethasone were administered by intramuscular injections to quadriceps. After the skull was exposed and cleaned with ethanol (70%) and ferric chloride (10%, VWR), a custom built metal plate was attached to the skull using a cyanocrylate-based glue (Loctite-495) and dental cement (A-M Systems). A 4-mm diameter craniotomy was centered 2 mm posterior and lateral to the Bregma point. The dura was left intact. A 5-mm diameter glass coverslip (Electron Microscopy Sciences) was used to seal the craniotomy.
Supplementary Material
Acknowledgments
This research project is supported in part by NSF/DBI (Grant No. DBI-0546227) and NIH/NCI grant number R01-CA133148. Nicholas G. Horton is supported by NSF Graduate Research Fellowship (Grant No. DGE-0707428). The authors would like to thank Prof. Chris Schafer, Cornell University, and Prof. Sergei Vinogradov, Department of Biochemistry and Biophysics, University of Pennsylvania, for their helpful discussions on brain imaging and phosphorescence quenching dyes for in vivo oxygen sensing, respectively.
Footnotes
AUTHOR CONTRIBUTIONS
S.H. coordinated the project, designed and built the microscope, designed and fabricated the linear spatial light modulator, wrote control and image processing software, performed simulations, wrote analysis algorithms, analyzed data, preformed animal preparation and surgery, prepared dye and calibrations, and wrote the paper. A.S. greatly assisted with microscope design and assembly, performed simulations and analysis, wrote analysis algorithms, significantly contributed to the content of the paper, and performed experiments verifying pixel rate increase. N.H. and D.K. assisted in animal preparation and surgery for imaging. C.X. initiated the project, significantly contributed to the design of M4 and experimental design, and greatly contributed to the theoretical and experimental discussions. All authors contributed to manuscript editing.
Contributor Information
Scott S. Howard, School of Applied and Engineering Physics, Cornell University, 212 Clark Hall, Ithaca, NY 14853. Department of Electrical Engineering, University of Notre Dame, 275 Fitzpatrick Hall, Notre Dame, IN 46556.
Adam Straub, School of Applied and Engineering Physics, Cornell University, 212 Clark Hall, Ithaca, NY 14853.
Nicholas Horton, School of Applied and Engineering Physics, Cornell University, 212 Clark Hall, Ithaca, NY 14853.
Demirhan Kobat, School of Applied and Engineering Physics, Cornell University, 212 Clark Hall, Ithaca, NY 14853.
Chris Xu, School of Applied and Engineering Physics, Cornell University, 212 Clark Hall, Ithaca, NY 14853.
References
- 1.Denk W, Strickler JH, Webb WW. Two-photon laser scanning fluorescence microscopy. Science. 1990;248:73–76. doi: 10.1126/science.2321027. [DOI] [PubMed] [Google Scholar]
- 2.Kobat D, Horton NG, Xu C. In vivo two-photon microscopy to 1.6-mm depth in mouse cortex. J Biomed Opt. 2011;16:106014. doi: 10.1117/1.3646209. [DOI] [PubMed] [Google Scholar]
- 3.Draaijer A, Sanders R, Gerristen HC. In: Handbook of Biological Confocal Microscopy. Pawley JB, editor. Plenum Press; New York: 1995. pp. 491–505. [Google Scholar]
- 4.Wallrabe H, Periasamy A. Imaging protein molecules using FRET and FLIM microscopy. Curr Opin Biotechnol. 2004;16(1):19–27. doi: 10.1016/j.copbio.2004.12.002. [DOI] [PubMed] [Google Scholar]
- 5.Zhong W, Urayama P, Mycek MA. Imaging fluorescence lifetime modulation of a ruthenium-based dye in living cells: the potential for oxygen sensing. J Phys D: Appl Phys. 2003;36:1689–1695. [Google Scholar]
- 6.Gratton E, Breusegem S, Sutin J, Ruan Q, Barry N. Fluorescence lifetime imaging for the two-photon microscope: time-domain and frequency-domain methods. J Biomed Opt. 2003;8:381. doi: 10.1117/1.1586704. [DOI] [PubMed] [Google Scholar]
- 7.Sakadžić S, et al. Two-photon high-resolution measurement of partial pressure of oxygen in cerebral vasculature and tissue. Nat Methods. 2010;7(9):755–759. doi: 10.1038/nmeth.1490. [DOI] [PMC free article] [PubMed] [Google Scholar]
- 8.Lecoq J, et al. Simultaneous two-photon imaging of oxygen and blood flow in deep cerebral vessels. Nat Medicine. 2011;17(7):893–898. doi: 10.1038/nm.2394. [DOI] [PMC free article] [PubMed] [Google Scholar]
- 9.Brakenhoff GJ, et al. Real-time two-photon confocal microscopy using a femtosecond, amplified Ti:sapphire system. J Microsc. 1996;181:253–259. doi: 10.1046/j.1365-2818.1996.97379.x. [DOI] [PubMed] [Google Scholar]
- 10.Buist AH, Muller M, Squier J, Brakenhoff GJ. Real-time two-photon absorption microscopy using multipoint excitation. J Microsc. 1998;192(2):217–226. [Google Scholar]
- 11.Fricke M, Nielsen T. Two-dimensional imaging without scanning by multifocal multiphoton microscopy. Appl Opt. 2005;44(15):2984–2988. doi: 10.1364/ao.44.002984. [DOI] [PubMed] [Google Scholar]
- 12.Li DD-U, et al. Time-Domain Fluorescence Lifetime Imaging Techniques Suitable for Solid-State Imaging Sensor Arrays. Sensors. 2012;12:5650–5669. doi: 10.3390/s120505650. [DOI] [PMC free article] [PubMed] [Google Scholar]
- 13.Li DU, et al. Real-time fluorescence lifetime imaging system with a 32 × 32 0.13 μm CMOS low dark-count single-photon avalanche diode array. Opt Express. 2010;18:10257–10269. doi: 10.1364/OE.18.010257. [DOI] [PubMed] [Google Scholar]
- 14.Li DU, et al. Video-rate fluorescence lifetime imaging camera with CMOS single-photon avalanche diode arrays and high-speed imaging algorithm. J Biomed Opt. 2011;16:096012. doi: 10.1117/1.3625288. [DOI] [PubMed] [Google Scholar]
- 15.Hartmann P, Ziegler W. Lifetime Imaging of Luminescent Oxygen Sensors Based on All-Solid-State Technology. Anal Chem. 1996;68:4512–4514. [Google Scholar]
- 16.Sakadžić S, et al. Simultaneous imaging of cerebral partial pressure of oxygen and blood flow during functional activation and cortical spreading depression. Appl Opt. 2009;48(10):D169–D177. doi: 10.1364/ao.48.00d169. [DOI] [PMC free article] [PubMed] [Google Scholar]
- 17.Dunphy I, Vinogradov SA, Wilson DF. Oxyphor R2 and G2: phosphors for measuring oxygen by oxygen-dependent quenching of phosphorescence. Anal Biochem. 2002;310(2):191–198. doi: 10.1016/s0003-2697(02)00384-6. [DOI] [PubMed] [Google Scholar]
- 18.Morris KJ, Roach MS, Xu W, Demas JN, DeGraff BA. Luminescence Lifetmie Stadnards for the Nanosecond to Microsecond Range and Oxygen Quenching of Ruthenium (II) Complexes. Anal Chem. 2007;89:9310–9314. doi: 10.1021/ac0712796. [DOI] [PubMed] [Google Scholar]
- 19.Finikova OS, et al. Oxygen Microscopy by Two-Photon-Excited Phosphorescence. ChemPhysChem. 2008;9(12):1673–1679. doi: 10.1002/cphc.200800296. [DOI] [PMC free article] [PubMed] [Google Scholar]
- 20.Szmacinski H, Gryczynski I, Lakowicz JR. Spatially Localized Ballistic Two-Photon Excitation in Scattering Media. Biospectroscopy. 1998;4:303–310. doi: 10.1002/(SICI)1520-6343(1998)4:5%3C303::AID-BSPY2%3E3.0.CO;2-X. [DOI] [PubMed] [Google Scholar]
- 21.Theer P, Denk W. On the fundamental imaging-depth limit in two-photon microscopy. JOSA A. 2006;23(12):3139–3149. doi: 10.1364/josaa.23.003139. [DOI] [PubMed] [Google Scholar]
- 22.Sanders JS, Driggers RG, Halford CE, Griffin ST. Imaging with frequency-modulated reticles. Opt Eng. 1991;30(11):1720–1724. [Google Scholar]
- 23.Howard SS, Straub AA, Xu C. Multiphoton modulation microscopy for high-speed deep biological imaging. IEEE/OSA Conf. Lasers Electro-Optics (CLEO); 2010. p. CWD6. [Google Scholar]
- 24.Futia G, Schlup P, Winters DG, Bartels RA. Spatially-chirped modulation imaging of absorption and fluorescent objects on single-element optical detector. Opt Express. 2011;19(2):1626–1640. doi: 10.1364/OE.19.001626. [DOI] [PubMed] [Google Scholar]
- 25.Philip J, Carlsson K. Theoretical investigation of the signal-to-noise ratio in fluorescence lifetime imaging. J Opt Soc Am A. 2003;20(2):368–379. doi: 10.1364/josaa.20.000368. [DOI] [PubMed] [Google Scholar]
- 26.Redford GI, Clegg RM. Polar Plot Representation for Frequency-Domain Analysis of Fluorescence Lifetimes. J Fluoresc. 2005;15(5) doi: 10.1007/s10895-005-2990-8. [DOI] [PubMed] [Google Scholar]
- 27.Nezam SMRM. High-speed polygon-scanner-based wavelength-swept laser source in the telescope-less configurations with application in optical coherence tomography. Opt Lett. 2008;33(15):1741–1743. doi: 10.1364/ol.33.001741. [DOI] [PubMed] [Google Scholar]
- 28.Chen M, Ding Z, Wang L, Wu T, Wang B. Wavelength-swept laser around 1300 nm based on polygon filter in Littrow telescope-less configuration. Proc. SPIE, Optics in Health Care and Biomedical Optics IV; 2010. p. 78452K. [Google Scholar]
- 29.Intaglietta M, Johnson PC, Winslow RM. Microvascular and tissue oxygen distribution. Cardiovalscular Research. 1996;32:632–643. [PubMed] [Google Scholar]
- 30.Maurin M, Stephan O, Vial JC, Marder SR, van der Sanden B. Deep in vivo two-photon imaging of blood vessels with a new dye encapsulated in pluronic nanomicelles. J Biomed Opt. 2011;16(3):036001. doi: 10.1117/1.3548879. [DOI] [PMC free article] [PubMed] [Google Scholar]
Associated Data
This section collects any data citations, data availability statements, or supplementary materials included in this article.