

Abstract
Kinesin and dynein are fundamental components of intracellular transport, but their interactions when simultaneously present on cargos are unknown. We built an optical trap that can be calibrated in vivo during data acquisition for each individual cargo to measure forces in living cells. Comparing directional stall forces in vivo and in vitro, we found evidence that cytoplasmic dynein is active during minus- and plus-end directed motion, whereas kinesin is only active in the plus direction. In vivo, we found outward (∼plus-end) stall forces range from 2 to 7 pN, which is significantly less than the 5- to 7-pN stall force measured in vitro for single kinesin molecules. In vitro measurements on beads with kinesin-1 and dynein bound revealed a similar distribution, implying that an interaction between opposite polarity motors causes this difference. Finally, inward (∼minus-end) stalls in vivo were 2–3 pN, which is higher than the 1.1-pN stall force of a single dynein, implying multiple active dynein.
Keywords: molecular motors, tweezers, tug-of-war, motility, microtubule
Cytoplasmic molecular motors, a fundamental component of cellular machinery, have been extensively characterized in vitro. Using single molecule fluorescence techniques and optical trapping, parameters such as the stepping rate, size, and stall force have all been measured (1–3). However, measurements on motors in vivo are necessary as the motors operate in a radically different environment than motors in vitro. Multiple and different types of motors can be bound to cellular cargo, accessory proteins are present, and cellular signals can impact cargo transport (4, 5). The cellular environment is also viscoelastic, causing viscous drag and elastic tethering to surrounding structures such as organelles and the cytoskeletal matrix (6, 7). This mixture of spring-like elastic behavior and friction-like viscous behavior makes it impossible to correctly calibrate optical traps using previous in vitro methods.
Several experiments have attempted to monitor in vivo stall forces by calibrating the optical trap in vitro. These experiments have led to results that were difficult to interpret and contradictory, some even postulating the stall forces measured in vivo indicate that kinesin has a different stall force in the cell (8, 9). There has also been considerable interest in understanding the mechanism of interaction between plus-end and minus-end directed microtubule motors (which are typically kinesin and dynein), because they are frequently on the same cargos, which are known to undergo stochastic saltatory types of motion (10). It is unclear whether the interaction is coordinated, where an external protein or signal controls which motor is turned on at any given time, or a “tug-of-war,” where the strongest motor(s) wins (11–13). Soppina et al. argued, based on in vivo and in vitro measurements of organelle stretching and pausing before directional switching, for a tug-of-war, but only measured forces for a subset of organelles in vitro (13). In addition, most tug-of-war models assume that the “losing” motor is ripped off the microtubule; we will argue that this is not true. In general, in vivo stall force measurements that support either type of intracellular transport model are lacking to date.
Results
Measurement of In Vivo Stall Forces.
Using a recently developed in vivo calibration technique (Methods) (14, 15), we measured the in vivo stall forces of lipid vesicles in A549 human epithelial cells and phagocytosed polystyrene beads in Dictyostelium discoideum. We used these two cell types to compare stall forces with each other. The data were also compared with previously published data on in vivo stalls in A549 cells that used in vitro calibration (9) and with in vitro stalls from purified Dictyostelium endosomes (13). We separated the runs into those toward the cell membrane (outward) and those toward the cell nucleus (inward) as a proxy for movement toward the plus or minus microtubule end (Fig. 1 A–D, with Fig. 1E being an example of individual traces used to make the histograms). A critical point is that we see a clear asymmetry between the outward (Fig. 1 A and C) and inward (Fig. 1 B and D) in vivo stalls. For outward stalls, there is a broad peak from 2 to 7 pN, whereas for inward stalls, there is a clear peak between 2 and 3 pN. Wilcoxon rank-sum tests were performed to compare the inward and outward stall force distributions, and the tests determined that the inward and outward stalls originate from different distributions to P < 0.05. The asymmetry between distributions supports our mapping of outward and inwards stalls to plus- and minus-end directed stalls. Although there is still certainly mixing due to misaligned microtubules, it is small enough to give us distinct distributions.
Fig. 1.

In vivo stall force measurements differ in the outward and inward directions. Stall force histograms of outward (n = 64) (A) and inward (n = 36) (B) stalls for A549 lipid droplets in vivo. Stall force histograms for Dictyostelium phagosomes (C and D), another in vivo system, are quite similar to A549 measurements and also reveal an asymmetry (outward n = 53, inward n = 38). The inward and outward distributions for both cell types are significantly different as determined by a Wilcoxon rank-sum test to the following P values: A549, P = 0.029; Dictyostelium, P = 0.0126. Both systems reveal outward stall forces that differ from the stall force of kinesin in vitro, which is the motor expected to drive outward motion. These histograms are an accumulation of stall measurements from multiple cells, and each stall force is measured by multiplying the stiffness (calibrated during acquisition independently for each organelle) by the distance moved during the stall. (E) Example stall traces for both directions for both cell types, with red boxes indicating the stalls (a quarter second pause before and after a movement >20 nm; Methods). The first two are outward stalls (2.8 and 5.2 pN) and the last two are inward stalls (1.7 pN for the A549 vesicle and 2.6-, 2.1-, and 2.0-pN stalls for the Dictyostelium trace). Each of these traces is the entirety of a typical 7-s data acquisition, which is judged for stall force and stall directionality after acquisition (Methods). In vivo traces were in two dimensions, but only the dimension along which the majority of motion occurred is displayed here.
Fig. 1 A–D indicates that there is very good qualitative agreement between the mammalian A549 cells and the slime mold (amoeba) D. discoideum. Our measurements are similar to previous measurements in Drosophila embryos (8) but disagree with previous measurements on lipid droplets in A549 cells (9), which showed higher stall force measurements for both outward and inward stalls. Both of these previous studies used in vitro calibration.
Outward-Directed Stalls Can Be Explained by Kinesin Interacting with Dynein.
To understand the cause of the spread in outward stall forces in the cells, we performed several experiments. Our aim was to determine whether the spread is due to the motors themselves or due to factors such as the viscoelasticity of the cellular environment. We first measured the stall force of single mouse kinesin-1 in vitro (Fig. 2A). This histogram has the usual narrow distribution of ∼5–7 pN (16) and does not replicate our outward in vivo data. Second, we purified phagosomes from Dictyostelium and removed the dynein to leave only DdUnc104, a kinesin-3 motor (13, 17). We also attached a kinesin from A549 cells to beads and measured its stall force (potentially a kinesin-2, see Fig. S1). Fig. 2B shows that the histograms are narrow and peaked around the expected 5–7 pN, very similar to Fig. 2A. Hence, the cause of the wide stall-force histograms shown in Fig. 1 A and C is unlikely to be a plus-end directed motor with an inhomogeneous or low stall force [as postulated by Shubeita et al. (8)].
Fig. 2.

In vivo stall force behavior can be replicated by motor-coated beads in vitro. (A) Stall force histogram of single molecules of mouse kinesin-1 in vitro, mean of 6.3 ± 1.1 pN (1 SD). This histogram shows that outward stall behavior cannot be explained by kinesin-1 alone. (B) The in vitro stall forces for purified Dictyostelium phagosomes with only DdUnc104, a kinesin-3, or beads coated with a kinesin purified from A549 cells also cannot explain the outward stall force observed in vivo (6.8 ± 1.2 pN mean for phagosomes, n = 37, and 6.8 ± 1.1 pN, n = 43, for A549 kinesin on beads). However, the stall force for plus-end directed beads coated with both kinesin-1 and dynein in vitro (n = 84) (C) replicates outward stall behavior in vivo (here compared with the outward A549 stall forces seen in Fig. 1A). Stall forces were only measured for beads that had stalls in both directions to ensure both motors were present. This data implies that an interaction between kinesin family motors and dynein through the cargo is likely the cause of the broad outward stall forces in vivo. In vitro single dynein stalls are also quite different from inward stall behavior (D), with a mean stall force of 1.1 ± 0.28 pN. (E) Coating a bead with many dyneins in vitro comes close to replicating in vivo inward behavior, leading to a larger stall force and spread in stall forces. (F) The stall force for minus-end directed in vitro stalls of beads coated with both kinesin-1 and dynein is similar to that for dynein alone, indicating that kinesin has minimal effect on minus-end directed motion.
A third test was to compare our in vivo stalls to in vitro stalls of polystyrene beads coated with both kinesin-1 and bovine brain cytoplasmic dynein (see SI Methods). Is there a possible interaction between motors that causes the broad distribution of outward stall forces seen in vivo? The answer is yes: here the plus-end directed in vitro stalls (Fig. 2C) give a histogram similar to the in vivo measurements (Fig. 1 A and B). We conclude that the broad outward stall forces, measured in vivo, can be reproduced in a simple in vitro system consisting of a cargo, kinesin-1, and dynein.
Inward Directed Stalls Are Driven by Multiple Dyneins.
What information is provided by the inward in vivo stalls at ∼2.5 pN (Fig. 1 B and D)? This value is significantly higher than the in vitro stall force of single molecules of bovine brain dynein (Fig. 2D) or Dictyostelium dynein (18). However, dynein’s in vitro stall force is controversial, and this measurement is on the low end of proposed stall forces for dynein, typically between 1 and 7 pN (2, 18, 19). We attempted to recapitulate the in vivo result by preparing polystyrene beads with multiple bovine brain dyneins but no kinesin, and measuring stall forces in vitro (Fig. 2E; see SI Methods). The stall force peak was ∼1.9 pN. We note that two to four motors appear to be the maximum number that can simultaneously interact with the axoneme when attached to a bead, because of the fact that increasing concentrations of dynein or kinesin did not increase the stall force. Although not as large a stall force as in vivo measurements, it supports the idea that more than one dynein can lead to a larger stall force (20). We therefore estimate that there are two to three dyneins per cargo in our cells, due to a single dynein’s stall force being ∼1 pN. In addition, minus-end directed stalls for in vitro beads coated with both kinesin and dynein are similar to stalls for dynein alone (Fig. 2F; see SI Methods). This data indicates that kinesin has little or no effect on minus-end directed stalls.
In Vivo and In Vitro Motors Are Similar.
In our simplified in vitro system, we measure stall force distributions similar to our in vivo data. The issue then arises that we do not know the plus-end directed motor(s) in vivo (the minus-end directed motor is cytoplasmic dynein). How do we know that the unknown plus-end directed motor is not responsible for the stall behavior we measure in vivo? For example, it could be a collection of motors with weak stall forces or a motor with variable stall force. This would indeed be a problem, although we have good evidence that our unknown motors in Dictyostelium or A549 cells are acting just like kinesin-1, with no strange behavior. Whether or not it is kinesin-1 does not matter as long as it has a high stall force peak with a narrow distribution.
In Dictyostelium, there is strong support for Ddunc-104 (a kinesin-3 motor) being the main or only plus-end directed motor on phagosomes (21, 22). This kinesin-3 is also the motor attached to purified phagosomes in the in vitro stall force assay (Fig. 2B) (17). Even if it is not the only motor present on phagosomes in vivo, the other organelle transport kinesins that appear to exist in Dictyostelium are all conventional kinesin-1s, which have stall forces of 5–7 pN (22). Hence, other potential plus-end directed motors in Dictyostelium, if present, should not alter our conclusions.
In A549, we took kinesin from the cytoplasm (potentially a kinesin-2; Fig. S1), attached it to beads, and measured a stall force similar to kinesin-1 (Fig. 2B). It is possible, however, that the kinesin we examine from A549 cell lysates is not the kinesin on the organelles; there could potentially be another kind. Here we rely on indirect evidence, namely the similarity to our Dictyostelium measurements, and the fact that conventional kinesin-1, 2, and 3 motors all have stall forces around 5–7 pN (21, 23, 24). As long as the stall force for the plus-end directed motor on the vesicle is not much lower than 5–7 pN, our conclusions are valid. See Potential In Vivo Factors That Affect Stall Force for a further discussion into other potential confounding factors in vivo.
Overview of the Technique.
We used a unique method, called the fluctuation-dissipation theorem (FDT) method (14, 15), to calibrate the trap stiffness in vivo. By taking a “passive” and an “active” measurement, we measure the three unknowns in the cellular trapping environment: the local elasticity, the local viscosity, and the trap stiffness. The passive measurement records the trapped cargo’s amplitude of thermal motion in the trap. The active measurement involves oscillating the trap laser and simultaneously measuring the cargo’s response at multiple frequencies (fn). By combining the phase delay and the amplitude measured in the active calibration with the amplitude measured during the passive calibration at every frequency fn, we can obtain the three unknowns and calibrate the trap in vivo. This calibration method allows us to measure, directly, stall forces on individually calibrated cargos at the time and place of data acquisition, as opposed to a post hoc calibration in vitro. The passive and active calibration measurements are occurring during and throughout the stall force measurements. This technique has been shown to work in a variety of viscoelastic materials, including actin polymers (15) and hyaluronic acid (Fig. S2).
Even though in this situation we have similar results to other in vivo calibration techniques, our calibration technique offers many advantages over these techniques. First, most so-called in vivo calibrations actually involve creating a calibration curve in vitro and then applying the calibration in vivo on the basis of organelle size or some other property (8, 9, 25). Second, in every stall force measurement, our calibration is simultaneous with data acquisition. Organelles can change shape, bump into other organelles, leave the trapping area, or otherwise be interfered with in the cell. Unlike in vitro calibration techniques (often incorrectly referred to as in vivo techniques), our calibration will detect this interference even if it is invisible under imaging (Fig. S3). Third, calibration is done for each organelle in the environment the stall force will be measured in and measures the local viscoelasticity for each organelle. No assumptions about size, shape, or index of refraction are necessary. Fourth, although this technique gives stall forces similar to those given by previous methods, they are measured using fewer assumptions than before, thereby lending the measurements more theoretical rigor.
Discussion
Our in vitro and in vivo results support a model that is surprisingly simple. We have an intracellular transport model in which kinesin family motors and dynein have their typical in vitro stall forces of 5–7 and 1.1 pN individually, respectively (or additive multiples thereof). However, when the two motors interact, minus-end directed stall forces are unaffected, whereas plus-end directed stalls are significantly reduced. This data is consistent with a model in which minus-end directed motion is run by dynein(s) alone (with dynein-associated proteins); kinesin does not have any significant effect, presumably because the kinesin detaches from the microtubule. Plus-end directed motion, on the other hand, involves kinesin family motors interacting with zero, one, or several dynein molecules that are being pulled behind. Presumably, the dynein reduces plus-end directed stall forces by resisting as it is pulled backward down the microtubule. That dynein can walk backward is not a new idea: it has been shown to occur in vitro and perhaps in vivo (26). This behavior is consistent with our results here that kinesin is able to move/drag dynein when heading in the plus-microtubule direction but that kinesin simply falls off when forced to move in the minus-end microtubule direction.
Our data do not directly contradict either the tug-of-war (12) or the coordinated motion (26) models of intracellular microtubule transport. They do, however, require a significant modification to both models. Both models currently assume that plus-end and minus-end directed motions are controlled completely by kinesin or dynein, respectively, with minimal movement occurring while both motors are simultaneously attached to the cargo and microtubule. Instead, we propose that the states are as follows: (i) a kinesin family motor and dynein, simultaneously active, leading to plus-end directed motion, or (ii) only dynein is active, leading to minus-end directed motion. Furthermore, the low minus-end stall forces for bidirectional cargos in vivo (Fig. 1 B and D) and in vitro (Fig. 2 A and F) indicate that dynein can rarely win a tug-of-war through force alone. This data indicates that the maximum motor force in a particular direction does not solely determine cargo directionality. Other factors that influence directionality warrant further investigation.
Although our results do not definitively argue for either model, the preponderance of the evidence argues for a tug-of-war model for short-range, bidirectional motion in vivo. Previous results argue for a tug-of-war model for in vitro motion (13, 27). Soppina et al. and Hendricks et al. (13, 27) take in vivo systems (Dictyostelium endosomes or neuronal transport vesicles), purify the organelles involved, and observe their behavior in vitro. As the behavior in vivo and in vitro is similar (bidirectional motion, switching, and other properties), they postulate that there is no external factor for control of these systems, leading to tug-of-war being the only possibility. The fact that in vitro systems with only kinesin and dynein and no accessory proteins undergo directional switching as seen in our system and in ref. 28 also supports the tug-of-war model. In addition, we use similar in vitro systems as these papers and get the same stall behavior in vivo, which also supports the contention that short-range bidirectional motion in vivo is modulated by a tug-of-war.
Our model also argues for the involvement of multiple dyneins, as this would give the wide range of stall forces seen in plus-end directed motion (Fig. 3). When moving in the plus direction, the kinesin family motor is usually fighting against dynein, resulting in a lower stall force [dynein-dragging model (27)]. In the minus direction, the motors are not interacting because the kinesin family motor is detached from the microtubule while motion is driven by dynein(s).
Fig. 3.

Model of intracellular transport. (A) Single dynein version. This simplified single-dynein model shows dynein always attached. Whether or not kinesin is engaged with the microtubule determines the directionality of the cargo. (B) Multiple dynein version. A more complex model showing how the spread in plus-end directed stall forces could occur due to different numbers of dyneins being attached to the cargo during plus-end directed motion. The arrows on the cargos indicate direction of motion, and the plus and minus signs indicate the polarity of the microtubules (plus = kinesin family motor ∼ outward, dynein = minus ∼ inward). The forces indicate the likely stall force for various combinations of motors. The higher stall forces seen in Fig. 1 could be caused by multiple motors, misaligned microtubules, and other rare or chance events (cellular movement, microtubule movement, an unusually large number of motors on an organelle).
How the directionality of long-range cargo motion is determined—why a cargo is biased in a particular direction—is presently unclear. The cell must have a means to bias the directionality of motion—either with a third protein, a chemical signal, or by altering the motor characteristics (such as motor number, motor activity, or binding affinity to the microtubules) (29). Our current results do not address this issue. Further research into dynein’s attachment state during bidirectional transport is necessary to determine whether it is being dragged behind the cargo during plus-end directed motion or if some other motor–motor interaction is occurring.
Methods
Setup and FDT Calibration.
There are three parts to an experiment in our application of the FDT method, discussed in detail in refs. 14 and 15: the positional calibration to obtain the volts to nanometers conversion for the quadrant photo-diode (QPD); the active calibration; and the passive calibration. Converting the QPD’s output of volts to nanometers involves trapping the object of interest with the trapping laser and then oscillating the detection laser over it (Fig. S4A). This technique is different from the one used in the original FDT method. We oscillate the detection laser’s position at the sample plane, using an AOM, in a triangle wave pattern of known amplitude (typically 40–80 nm) and frequency (4,000 Hz), and then divide the known amplitude by the measured voltage amplitude on the detection QPD (obtained from the Fourier transform of the QPD data at 4,000 Hz). This procedure is done once per data acquisition, typically occurring for a few milliseconds at the beginning of the acquisition.
The passive calibration simply records position data for the cargo in the trap, with no active movement of the trap or detection laser, whereas the active spectrum records position data for the cargo in the trap while the trapping laser is being oscillated (Fig. S4 B and C). This oscillation is the sum of many sinusoidal oscillations at different frequencies added together (we typically oscillate at 20 different frequencies, fn, from 300 to 16,000 Hz). During active calibration, the relative phase of the cargo and trapping laser is tracked by comparing the trap laser QPD and the detection QPD signals. Data acquisition typically occurs for slightly more than 7 s, with a short volts-to-nanometers conversion period, and then alternating half second periods of active and passive calibration while the QPDs are read out at 80 kHz. Calibration occurs throughout data acquisition, and although the trap is oscillating, it has minimal effect on the cargo’s position, with the oscillations generally only being visible in the Fourier transform of the position data. Acquisitions are limited to 7 s because of the fact that at the speed we acquire data (80 kHz), our data acquisition (DAQ) card’s buffer overfills, preventing us from taking longer acquisitions.
We record the cargo’s position during the passive calibration, and then during the active calibration, we measure the trap’s position and the cargo’s position. After data acquisition, we analyze these data to get the trap’s stiffness. During analysis, the power spectrum of the passive position data is taken. Then we combine the trap and cargo position of the active calibration to get a magnitude called the active spectrum:
where the tilde indicates a Fourier transform, xac is the cargo’s position during the active calibration, ω is the frequency of oscillation (ω = 2πfn), and xL is the laser’s position during the active calibration. These numbers are complex due to the cargo and laser having a relative phase. We then combine the power spectrum of the passive calibration data and the active spectrum of the active calibration data in Eq. 2 to obtain the stiffness.
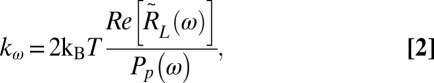 |
where kω is the trap stiffness at ω, kB is the Boltzmann constant, T is the temperature in Kelvin, Re[] indicates the real component, and Pp indicates the power spectrum of the passive calibration data. kω is constant over the frequency range we are measuring in, so we can average it over every frequency of oscillation. For a more thorough explanation of how these equations were obtained and possible alternative techniques to obtain a similar calibration, see refs. 14 and 15. For a description of the trapping setup, see Fig. S5.
Live Cell Stall Force Assays.
Assays were performed in A549 cells from American Type Culture Collection (ATCC; CCL-185) and D. discoideum strain Ax-2 DBS0235518 (Dictybase). A549 cells were grown on glass bottomed Petri dishes (WilcoWells) at 37 °C, 5% (pressure/pressure) CO2, in F-12K (Kaighn’s modification of F-12; purchased from ATCC) with 10% FBS, penicillin, and streptomycin. The assay was carried out at room temperature under standard atmosphere in the same medium. The Dictyostelium cells were grown in flasks at 21 °C in development buffer (DB: 5 mM Na2HPO4, 5 mM KH2PO4, 1 mM CaCl2, and 2 mM MgCl2, pH 6.5) with E. coli strain B/r neomycin resistant. Carboxylated latex beads (1.26 μm diameter; Spherotech) were added to the flask anywhere from 2 to 4 h before the assay. The cells were then placed on a coverslip for at least 30 min, a thin sheet of agar was placed on them to flatten them out, and any excess medium was removed. A microscope slide was then placed on the top of the agar [agar overlay method (30)]. A549 cells were observed at room temperature on the optical trap for up to 3 h; Dictyostelium cells were observed for <2 h as they generally appeared to become unhealthy when left under the agar overlay for longer periods of time. Lipid vesicles were trapped in the A549 cells, whereas phagocytosed beads were trapped in the Dictyostelium cells. A549 lipid vesicles were chosen for trapping on the basis of size (needed to be approximately half a micrometer in size or larger) and for being separated from other vesicles near the cellular periphery where calibration and directionality could be easily determined. These vesicles were distributed throughout the cell; however, when near the nucleus, the vesicles tended to aggregate and to make motions in and out of focus, which interfered with data acquisition.
Stall directionality was determined by observing CCD data and determining whether the stall was moving toward the cell membrane or toward the cell center. Stalls with unclear directionality were discarded [Dictyostelium: 23/114 (20%) of stalls, A549: 23/125 (18%) of stalls were discarded due to unclear directionality]. In vivo stall criteria were as follows: a 0.25-s pause before and after a movement of greater than 20 nm. This criterion was used because the resolution of our position measurement in vivo was typically 5–10 nm, and 20 nm typically corresponded to about 1 pN of force. A release back to the center of the trap was not a required component of a stall, as releases were quite rare in vivo, occurring in around one-third of stalls in A549 cells and essentially not at all in Dictyostelium cells. We note that these criteria are different from those for in vitro stalls and could lead to a mixture of random pauses and true maximum force stalls for the motors. However, these criteria are actually quite restrictive because pauses before and after significant movements were quite rare within the small area of the trap and therefore should show a significant bias toward actual stalls as the trap should force stalls to occur. As in vivo measurements occurred in two dimensions, many stalls had components in both of these dimensions. The two components were added in quadrature to obtain a single stall force. Beads (1.26 μm) were used in Dictyostelium due to the large amounts of activity in these cells. Measurements on smaller beads were affected by this cellular activity, which was manifested as a large amount of noise and calibration failure. The larger beads did not experience this problem to as great of an extent, because they interacted with the trapping and detection beams more strongly than the small organelles around them (the volts to nanometers conversion was larger for larger beads), although as a downside, they did not release back to the center of the trap. Also, Dictyostelium, as a much more active system, experienced much higher levels of noise and flow. Whereas typically A549 cells were stationary, as were the lipid vesicles inside of them, Dictyostelium cells showed large levels of internal and external movement. Any data in which external cellular movement occurred were discarded. However, large internal movements were extremely common and were not discarded unless they interfered with trap calibration.
Trap Centering.
To ensure the trap was centered on the cargo of interest, a program was written that took a CCD image of the cell. When we clicked on a cargo, the program determined its center and then, using the piezo stage, centered the trap on the cargo. This process takes approximately 0.25 s, so if the cargo is in motion, it will sometimes not be correctly centered. This delay is not an issue as a result of two factors. First, our stall force definition requires a pause before and after cargo motion, so our stall forces are measuring only relative changes in force and not the total force imposed by the trap. This definition is reasonable, in that to end a pause, presumably a new motor has activated to start the motion, and we are effectively measuring its stall force. Second, our calibration technique, because it is occurring throughout data acquisition, makes it very clear if the cargo is not well centered in the trap, as the stiffness measurement changes significantly if the cargo leaves the center of the trapping area (Fig. S3).
Stall Force Error Estimate.
The two major components of error in our stall force measurements are from position measurement (the distance the cargo has moved between pauses) and from error in the stiffness calibration. As can be seen in Fig. 1E, the position can generally be determined with an error of <10%, after averaging the position during stall. The stiffness error, seen in Fig. S3, is also <10% when averaged over several seconds of calibration, as is typical. Therefore, the total error in stall force measurement in vivo is <14%.
Note.
While this paper was in submission, a similar paper using a similar technique was published (31). The other paper’s technique involves measuring the passive and forced response of a trapped cargo in vivo, over many frequencies, and then applying a global fit over the frequencies measured. Our technique determines the stiffness at each frequency and then averages the stiffnesses over frequency. One point of interest is that our technique continuously calibrates during data acquisition, thereby allowing us to notice any changes in the organelle or local environment during force measurement (Fig. S3). Their technique calibrates separately from data acquisition, assuming a relatively unchanging stiffness and no interference during force measurement.
Supplementary Material
Acknowledgments
This work was supported in part by grants from National Institutes of Health (068625) and from National Science Foundation (0822613).
Footnotes
The authors declare no conflict of interest.
This article is a PNAS Direct Submission.
This article contains supporting information online at www.pnas.org/lookup/suppl/doi:10.1073/pnas.1219961110/-/DCSupplemental.
References
- 1.Schnitzer MJ, Block SM. Kinesin hydrolyses one ATP per 8-nm step. Nature. 1997;388(6640):386–390. doi: 10.1038/41111. [DOI] [PubMed] [Google Scholar]
- 2.Toba S, Watanabe TM, Yamaguchi-Okimoto L, Toyoshima YY, Higuchi H. Overlapping hand-over-hand mechanism of single molecular motility of cytoplasmic dynein. Proc Natl Acad Sci USA. 2006;103(15):5741–5745. doi: 10.1073/pnas.0508511103. [DOI] [PMC free article] [PubMed] [Google Scholar]
- 3.Yildiz A, Tomishige M, Vale RD, Selvin PR. Kinesin walks hand-over-hand. Science. 2004;303(5658):676–678. doi: 10.1126/science.1093753. [DOI] [PubMed] [Google Scholar]
- 4.Ally S, Larson AG, Barlan K, Rice SE, Gelfand VI. Opposite-polarity motors activate one another to trigger cargo transport in live cells. J Cell Biol. 2009;187(7):1071–1082. doi: 10.1083/jcb.200908075. [DOI] [PMC free article] [PubMed] [Google Scholar]
- 5.Kural C, et al. Kinesin and dynein move a peroxisome in vivo: A tug-of-war or coordinated movement? Science. 2005;308(5727):1469–1472. doi: 10.1126/science.1108408. [DOI] [PubMed] [Google Scholar]
- 6.Tseng Y, Kole TP, Wirtz D. Micromechanical mapping of live cells by multiple-particle-tracking microrheology. Biophys J. 2002;83(6):3162–3176. doi: 10.1016/S0006-3495(02)75319-8. [DOI] [PMC free article] [PubMed] [Google Scholar]
- 7.Yamada S, Wirtz D, Kuo SC. Mechanics of living cells measured by laser tracking microrheology. Biophys J. 2000;78(4):1736–1747. doi: 10.1016/S0006-3495(00)76725-7. [DOI] [PMC free article] [PubMed] [Google Scholar]
- 8.Shubeita GT, et al. Consequences of motor copy number on the intracellular transport of kinesin-1-driven lipid droplets. Cell. 2008;135(6):1098–1107. doi: 10.1016/j.cell.2008.10.021. [DOI] [PMC free article] [PubMed] [Google Scholar]
- 9.Sims PA, Xie XS. Probing dynein and kinesin stepping with mechanical manipulation in a living cell. ChemPhysChem. 2009;10(9-10):1511–1516. doi: 10.1002/cphc.200900113. [DOI] [PMC free article] [PubMed] [Google Scholar]
- 10.Jolly AL, Gelfand VI. Bidirectional intracellular transport: Utility and mechanism. Biochem Soc Trans. 2011;39(5):1126–1130. doi: 10.1042/BST0391126. [DOI] [PMC free article] [PubMed] [Google Scholar]
- 11.Müller MJ, Klumpp S, Lipowsky R. Bidirectional transport by molecular motors: Enhanced processivity and response to external forces. Biophys J. 2010;98(11):2610–2618. doi: 10.1016/j.bpj.2010.02.037. [DOI] [PMC free article] [PubMed] [Google Scholar]
- 12.Müller MJ, Klumpp S, Lipowsky R. Tug-of-war as a cooperative mechanism for bidirectional cargo transport by molecular motors. Proc Natl Acad Sci USA. 2008;105(12):4609–4614. doi: 10.1073/pnas.0706825105. [DOI] [PMC free article] [PubMed] [Google Scholar]
- 13.Soppina V, Rai AK, Ramaiya AJ, Barak P, Mallik R. Tug-of-war between dissimilar teams of microtubule motors regulates transport and fission of endosomes. Proc Natl Acad Sci USA. 2009;106(46):19381–19386. doi: 10.1073/pnas.0906524106. [DOI] [PMC free article] [PubMed] [Google Scholar]
- 14.Fischer M, Berg-Sorensen K. Calibration of trapping force and response function of optical tweezers in viscoelastic media. J Opt A, Pure Appl Opt. 2007;9(8):S239–S250. [Google Scholar]
- 15.Fischer M, Richardson AC, Reihani SN, Oddershede LB, Berg-Sørensen K. Active-passive calibration of optical tweezers in viscoelastic media. Rev Sci Instrum. 2010;81(1):015103. doi: 10.1063/1.3280222. [DOI] [PubMed] [Google Scholar]
- 16.Visscher K, Schnitzer MJ, Block SM. Single kinesin molecules studied with a molecular force clamp. Nature. 1999;400(6740):184–189. doi: 10.1038/22146. [DOI] [PubMed] [Google Scholar]
- 17.Pollock N, Koonce MP, de Hostos EL, Vale RD. In vitro microtubule-based organelle transport in wild-type Dictyostelium and cells overexpressing a truncated dynein heavy chain. Cell Motil Cytoskeleton. 1998;40(3):304–314. doi: 10.1002/(SICI)1097-0169(1998)40:3<304::AID-CM8>3.0.CO;2-C. [DOI] [PubMed] [Google Scholar]
- 18.Mallik R, Carter BC, Lex SA, King SJ, Gross SP. Cytoplasmic dynein functions as a gear in response to load. Nature. 2004;427(6975):649–652. doi: 10.1038/nature02293. [DOI] [PubMed] [Google Scholar]
- 19.Gennerich A, Carter AP, Reck-Peterson SL, Vale RD. Force-induced bidirectional stepping of cytoplasmic dynein. Cell. 2007;131(5):952–965. doi: 10.1016/j.cell.2007.10.016. [DOI] [PMC free article] [PubMed] [Google Scholar]
- 20.Mallik R, Petrov D, Lex SA, King SJ, Gross SP. Building complexity: An in vitro study of cytoplasmic dynein with in vivo implications. Curr Biol. 2005;15(23):2075–2085. doi: 10.1016/j.cub.2005.10.039. [DOI] [PubMed] [Google Scholar]
- 21.Klopfenstein DR, Holleran EA, Vale RD. Kinesin motors and microtubule-based organelle transport in Dictyostelium discoideum. J Muscle Res Cell Motil. 2002;23(7–8):631–638. doi: 10.1023/a:1024403006680. [DOI] [PubMed] [Google Scholar]
- 22.Kollmar M, Glöckner G. Identification and phylogenetic analysis of Dictyostelium discoideum kinesin proteins. BMC Genomics. 2003;4(1):47. doi: 10.1186/1471-2164-4-47. [DOI] [PMC free article] [PubMed] [Google Scholar]
- 23.Imanishi M, Endres NF, Gennerich A, Vale RD. Autoinhibition regulates the motility of the C. elegans intraflagellar transport motor OSM-3. J Cell Biol. 2006;174(7):931–937. doi: 10.1083/jcb.200605179. [DOI] [PMC free article] [PubMed] [Google Scholar]
- 24.Huckaba TM, Gennerich A, Wilhelm JE, Chishti AH, Vale RD. Kinesin-73 is a processive motor that localizes to Rab5-containing organelles. J Biol Chem. 2011;286(9):7457–7467. doi: 10.1074/jbc.M110.167023. [DOI] [PMC free article] [PubMed] [Google Scholar]
- 25.Ashkin A, Schütze K, Dziedzic JM, Euteneuer U, Schliwa M. Force generation of organelle transport measured in vivo by an infrared laser trap. Nature. 1990;348(6299):346–348. doi: 10.1038/348346a0. [DOI] [PubMed] [Google Scholar]
- 26.Dixit R, Ross JL, Goldman YE, Holzbaur EL. Differential regulation of dynein and kinesin motor proteins by tau. Science. 2008;319(5866):1086–1089. doi: 10.1126/science.1152993. [DOI] [PMC free article] [PubMed] [Google Scholar]
- 27.Hendricks AG, et al. Motor coordination via a tug-of-war mechanism drives bidirectional vesicle transport. Curr Biol. 2010;20(8):697–702. doi: 10.1016/j.cub.2010.02.058. [DOI] [PMC free article] [PubMed] [Google Scholar]
- 28.Vale RD, Malik F, Brown D. Directional instability of microtubule transport in the presence of kinesin and dynein, two opposite polarity motor proteins. J Cell Biol. 1992;119(6):1589–1596. doi: 10.1083/jcb.119.6.1589. [DOI] [PMC free article] [PubMed] [Google Scholar]
- 29.Kunwar A, et al. Mechanical stochastic tug-of-war models cannot explain bidirectional lipid-droplet transport. Proc Natl Acad Sci USA. 2011;108(47):18960–18965. doi: 10.1073/pnas.1107841108. [DOI] [PMC free article] [PubMed] [Google Scholar]
- 30.Fukui Y, Yumura S, Yumura TK. Agar-overlay immunofluorescence: High-resolution studies of cytoskeletal components and their changes during chemotaxis. Methods Cell Biol. 1987;28:347–356. doi: 10.1016/s0091-679x(08)61655-6. [DOI] [PubMed] [Google Scholar]
- 31.Hendricks AG, Holzbaur EL, Goldman YE. Force measurements on cargoes in living cells reveal collective dynamics of microtubule motors. Proc Natl Acad Sci USA. 2012;109(45):18447–18452. doi: 10.1073/pnas.1215462109. [DOI] [PMC free article] [PubMed] [Google Scholar]
Associated Data
This section collects any data citations, data availability statements, or supplementary materials included in this article.