Abstract
TOAC (2,2,6,6-tetramethylpiperidine-1-oxyl-4-amino-4-carboxylic acid) spin label was attached at the N-terminal position to interrogate the dynamics of the HIV-1 nucleocapsid Zn-finger protein, NCp7. NCp7 is a 6.4 kDa 55-mer critical to the recognition, packaging, and efficient reverse transcription of viral RNA that has stem-loop structures, such as the RNA Stem-loop 3 used in this work. The NCp7, made by solid-phase peptide synthesis with TOAC incorporated into the α-carbon backbone at the N-terminal “0” position, showed analytical purity and biological activity. EPR spectra of the N-terminal TOAC indicated rapid temperature-sensitive motion of the probe (≤ 0.33 ns correlation time) on the flexible N-terminal segment. This N-terminal TOAC-NCp7 reported a RNA-NCp7 interaction at a 1:1 ratio of NCp7 to RNA which caused the tumbling time to be slowed from about 0.3 ns to about 0.5 ns. NCp7 is a largely disordered protein that adapts to its RNA targets. However, as shown by circular dichroism, ≥ 90% TFE (trifluoroethanol, an α-helix enhancer) caused the TOAC-NCp7 without zinc in its fingers to change to a fully helical conformation, while the TOAC spin label was concurrently reporting a tumbling time of well over a nanosecond as the N-terminal TOAC became inflexibly enfolded. Even with TFE present, the existence of intact Zn-finger regions in NCp7 prevented complete formation of helical structure, as shown by circular dichroism, and decreased the N-terminal TOAC tumbling time, as shown by EPR. This study demonstrated TOAC at the N-terminal of NCp7 to be a reporter for the considerable conformational lability of NCp7.
Keywords: CD, EPR, NCp7, spin label, TFE, TOAC, ΨRNA
INTRODUCTION
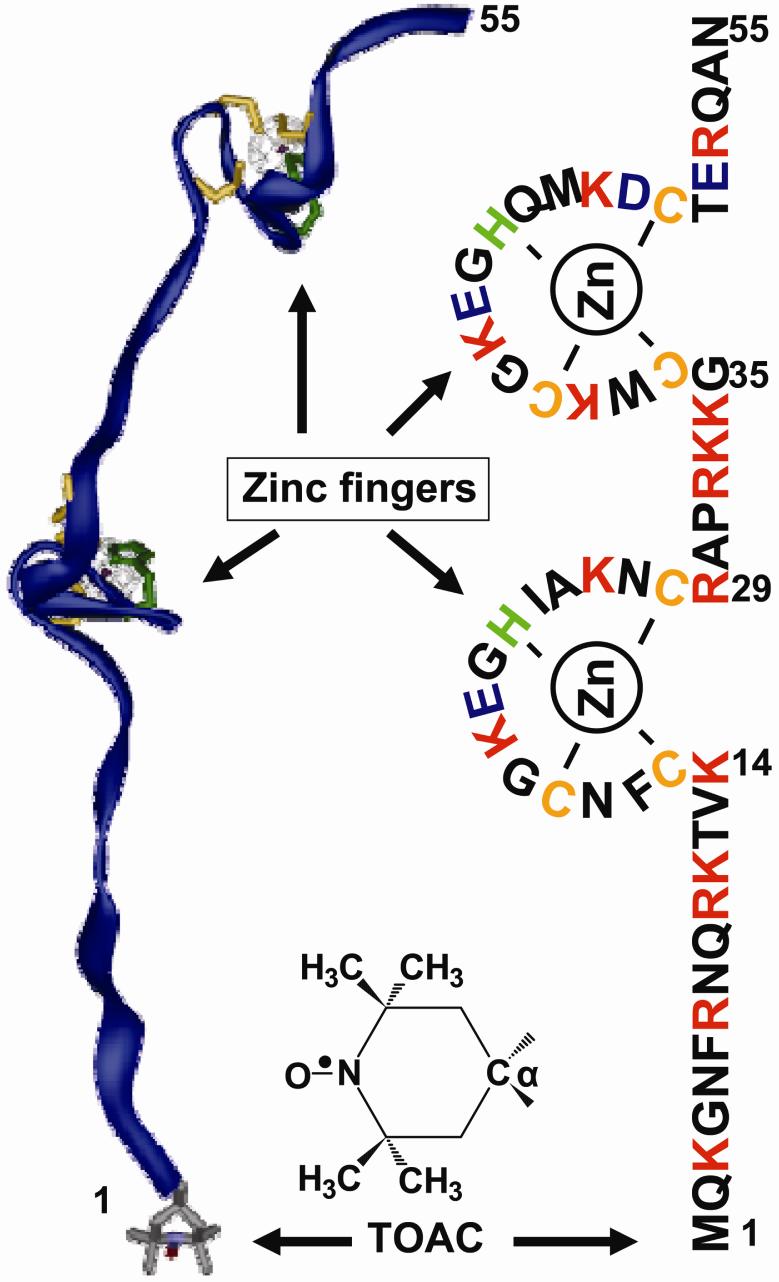
NCp7 is a small, basic 55 amino acid protein with sequence shown in Figure 1 that contains two weakly interacting Zn-finger domains.1,2 It has numerous critical functions in HIV-1 replication, notably, in reverse transcription, tRNA primer annealing, DNA strand elongation, DNA integration, and RNA genomic condensation and packaging.3-7 In these functions, NCp7's two main activities are destabilization of nucleic acid duplex structures (e.g., stem-loops)8-11 and nucleic acid aggregation-condensation.5,12-15 NCp7 functions over a range of differing oligonucleotide/NCp7 stoichiometries. NCp7 appears to have a specific loop-recognizing function due to its Zn-fingers, and a more general capacity for non-specific ionic interaction with oligonucleotide polyanions16 because of its overall positive (+9) charge.17 Its ability to anneal depends on its overall coverage of oligonucleotides due to both specific Zn-finger/stem-loop interactions and non-specific NCp7-cation/oligonucleotide anion interactions.6
Figure 1.
Amino acid sequence of (1-55)NCp7. The TOAC label has its 6-member nitroxide ring intimately incorporated at the C α carbon at the “0” position. The ribbon diagram of NCp7 (Modeling software, ViewerPro™, Accelrys) is taken from the NMR PDB structure of NCp722 with the TOAC placed at the N terminus.
The structure and function of NCp7 have been heavily studied in its interaction with the four contiguous stem-loop structures, SL1-SL4, of the HIV-1 ψ recognition site.18-21 RNA Stem-loop 3 is of particular interest because its sequence is highly conserved among different strains of HIV-1. In the absence of RNA, the NCp7 is structured in the vicinity of its Zn-fingers but relatively unstructured elsewhere.22 Under conditions of moderate ionic strength favoring a well-defined 1:1 complex of NCp7 with the RNA Stem-loop 3 stem-loop, the NMR structure has shown interaction of the RNA stem-loop with the NCp7 Zn-finger region via hydrogen bonds and with the NCp7 N-terminal tail via ionic interaction with the negatively charged RNA.18
NCp7 has an inherent flexibility and disorder23 as shown from NMR studies by the adaptation of NCp7 to a range of RNA and DNA oligonucleotide structures.20-22,24-26 Obtaining information from flexible structures requires diverse spectroscopic methods since structural information on the NMR time scale need not be fully representative of the complexity of NCp7 motion. EPR of spin probes reports rapidly fluctuating dynamic motions, and a strong point of EPR is its facility to probe the structure and local mobility of flexible components that are less amenable to high resolution NMR, e.g., fibrils in neurodegenerative Parkinson's27,28 and Alzheimer's29 diseases. These motions include local motion at a particular amino acid or oligonucleotide site, segmental motion in the vicinity of that site, and conceivably, if local and segmental motions are sufficiently restricted, overall tumbling of the entire structure. Such motions may also pertain in NCp7/oligonucleotide complexes at stoichiometries that are not the 1:1 stoichiometries that are amenable to NMR structural determination but which show annealing function,30 Such motions have recently been probed by a complementary NCp7/RNA Stem-Loop 3 study where the spin label is on the RNA.31
Recently developed peptide synthesis methods32 were used for making the NCp7 and then attaching the spin probe into NCp7. The nitroxide label was TOAC (2,2,6,6-tetramethylpiperidine-N-oxyl-4-amino-4-carboxylic acid), where the nitroxide ring was explicitly attached to an amino acid α-carbon so that it would be more thoroughly integrated into the peptide backbone than would be a probe attached to a side chain. Figure 1 provides the sequence of NCp7 with TOAC attached at the N-terminal (i.e., the “0” position) and a ribbon diagram taken from the NMR structure of NCp7 with TOAC placed at the N-terminus. The TOAC probe is several times smaller in size and molecular weight than commonly used fluorescent probes33 and thus is less likely to perturb the function of the NCp7, especially if attached at an N-terminal rather than in the Zn-finger vicinity. The alternative to a direct probe attachment via peptide synthesis would have been to attach probes to amino acid side chains, the standard method being cysteine-directed attachment at a mutated cysteine site,34-37 but because of the potential for damage to the essential Zn-finger cysteines, cysteine-specific spin labeling was considered unsuitable.
Thus the purpose of this paper was to monitor motion of the NCp7 by itself in dilute buffer, by itself with a solvent which favored higher helical order, and together with stem-loop RNA. An important methodological aspect was the preparation of NCp7 by peptide synthesis in the course of which the EPR probe was directly attached.
MATERIALS AND METHODS
Synthesis and Purification of N-terminal Spin-labeled NCp7
Figure 1 shows the sequence of the synthesized spin-labeled HIV-1 (1-55)NCp7 and the attached N-terminal spin label TOAC (2,2,6,6-tetramethyl-piperidine-N-oxyl-4-amino-4-carboxylic acid). The protein was assembled on Fmoc-Asn-PEG-PS resin (initial load 0.2 mmol/g), by Fmoc chemistry using a PE Biosystems Pioneer™ protein synthesis system. Standard (HATU)/N,N-di-isopropylethylamine (DIEA) (1/2.4 eq.) activation, in (NMP), was applied. TOAC, synthesized as reported previously 38,39, was introduced during solid-phase protein synthesis at the N-terminus (position 0).32 Fmoc deprotection was achieved with 20% piperidine in NMP. The final release of the NCp7, with removal of the side chain protecting groups, was accomplished by exposure of the protein-resin to 82.5% TFA, 5% phenol, 5% thioanisol, 2.5% 1,2-ethanedithiol, 5% water (Reagent K40). The protein was precipitated with cold methyl t-butyl ether, vortexed, centrifuged, decanted, and dried over argon. The dried protein was dissolved in degassed water and purified by HPLC on a Diphenyl-column (Vydac, 219TP510; 5 μm, 300Å; 10 × 250 mm). Protein elution was achieved with a linear gradient from 0 to 23% B (95% CH3CN/5% H2O/0.1% TFA) in 40 min at a flow rate of 2.5 mL/min with detection at 280 nm using a System Gold Beckman Coulter system. The HPLC fractions were collected and analyzed by SDS-PAGE. The pooled fractions found to be essentially pure were lyophilized to yield 29.5 mg (12.6% yield based on starting resin). The purified, N-terminal TOAC-NCp7 (i.e., 0-TOAC-NCp7) was submitted to alkaline treatment (pH 10, 20 min, 80 °C) for complete reversion of the N-O protonation that occurs during TFA cleavage and HPLC purification. A Microcon Centrifugal Filter Devices YM-3 (Millipore) was used for buffer exchange to 50 mM Hepes, pH 7.5, and 5 mM β-Mercaptoethanol. The final NCp7 concentration of 2 mM was determined by using an extinction coefficient of ε280 = 6050 M-1cm-1.41 Zinc chloride was added in a 2:1 molar ratio to NCp7, which was lyophilized and stored in liquid nitrogen.
Characterization of the Labeled NCp7 Derivatives
ESI-MS Characterization
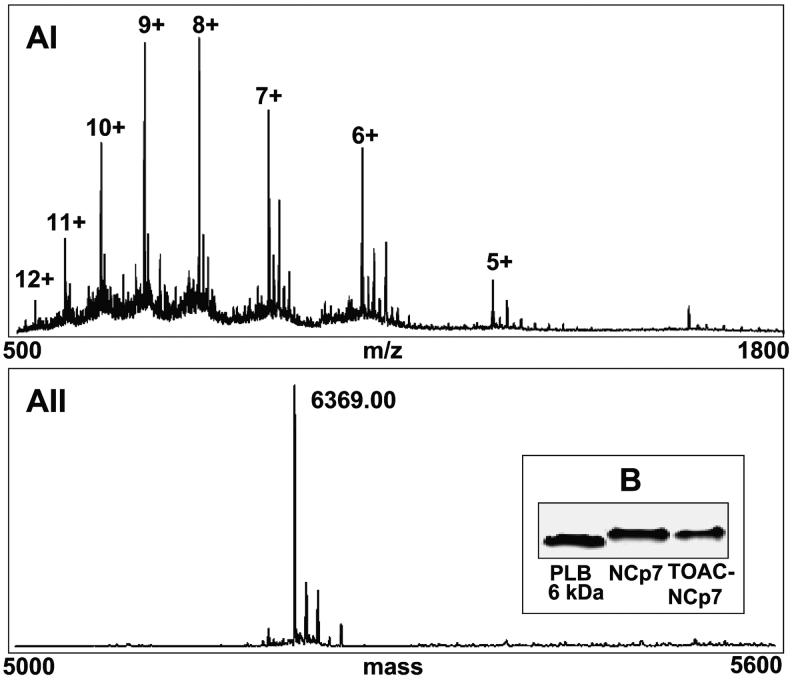
Mass spectrometry (ESI-MS) was performed in the positive ion mode using a Q Star (Applied Biosystems) instrument. The lyophilized NCp7 sample was dissolved in 70 % Acetonitrile/30 % water/0.1 % formic acid and diluted to a final concentration in the micro molar range. The NCp7 solution was introduced by direct infusion using the ion spray source at a flow rate of 15μL/min and a voltage of 5000 V. The TOF region acceleration voltage was 4 kV. The injection pulse repetition rate was 6.0 kHz; pulse duration was 13 μs. A two point calibration of the instrument was performed using renin substrate (586.9830, triply charged ion and 879.9705, doubly charged ion). The data were processed using Bio Analyst software (Bayesian protein reconstruct) from Applied Biosystems. The deconvoluted mass spectra of the unlabeled NCp7 showed one major peak at a molecular mass at 6369.00 Da., fully consistent with the calculated mass of 6369.05 Da, as shown in Figure 2A. EPR is the proof of TOAC coupling.
Figure 2.
ESI-MS spectra of NCp7 (calculated MW 6369.05 Da). AI) Raw mass spectrum from scans 500-1800. AII) The deconvoluted mass spectrum of NCp7 obtained by using Bio Analyst software (Applied Biosystems) results in a major peak at 6369.00 Da., consistent with a calculated mass of 6369.05 Da. B) SDS-PAGE of synthesized (1-55)NCP7 and 0-TOAC-(1-55)NCP7 and comparison to phospholamban PLB, showing that NCP7 migrates as a monomer in comparison to monomeric phospholamban (PLB) at 6 kDa.
SDS-PAGE Characterization
The covalently labeled 0-TOAC-NCp7 derivative was characterized by gel SDS PAGE electrophoresis and found to migrate as a monomer at the same position as the unlabeled NCp7. SDS-PAGE was performed using 10-20% Tris/Tricine gel (Bio-Rad). 40 μL of sample loading buffer (Bio-Rad) was added to the sample, which contained 5 μg of NCp7 in 50 mM Hepes, pH 7.5. The NCp7 band was quantitated by using phospholamban (PLB), a 6 kDa protein as a reference.42 Both proteins migrated as a monomer at the same position as the unlabeled NCp7 as shown in Figure 2B.
Activity Measurements
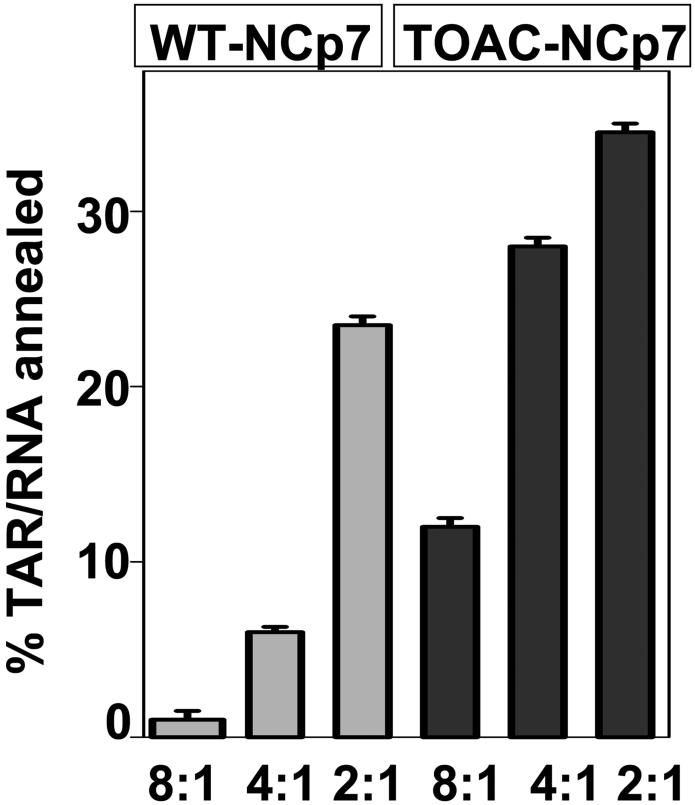
The chaperone activity of unlabeled and 0-TOAC-NCp7 proteins was characterized in a mini-TAR RNA/DNA annealing assay as shown in Figure 3 with the method previously described.30 The annealing assay showed that the presence of 0-TOAC on the NCp7 did not compromise the annealing activity of NCp7.
Figure 3.
Annealing Activity after Vo et al.30 of unlabeled (i.e., WT) NCp7 and 0-TOAC-NCp7 in the presence of Trans-Activation Response element (TAR) DNA at the specified ratios of TAR DNA to NCp7.
Spectroscopic Methods
Circular Dichroism
CD spectra were recorded on a Jasco J-710 spectrophotometer at 5 °C using a 0.01 cm path-length quartz cuvette. The NCp7 concentration was 0.1-0.5 mM. Acquisition was performed using 50 nm/min scan rate, 1 nm bandwidth, and 2 s response. The corresponding baseline (buffer) was subtracted from each spectrum. Reported spectra are averages of six scans and are expressed as mean residue ellipticity, [θ]. CD basis spectra were measured with poly(lysine) and poly(glutamic acid) (Sigma) using conditions and parameters reported previously.43,44 Linear combinations of α-helix and random coil basis spectra were used to estimate secondary structure contributions from fits to experimental CD spectra.45
EPR Spectroscopy
X-band (9.5 GHz) EPR spectra were acquired with a Bruker EleXsys 500 spectrometer equipped with the SHQ cavity, using 100 kHz field modulation with a peak-to-peak amplitude of 1.0 G, and a 120 G sweep width. A typical sample contained 8 μL of 0.5 mM NCp7 and was loaded into a 0.6 mm inside diameter TPX capillary with a total sample length of approximately 10 mm. Sample temperature was maintained using the Bruker temperature controller, with the sample cell inside a quartz dewar.
EPR Line Shape Analysis for Estimation of Tumbling Correlation Times
Tumbling, as it modulates the anisotropic hyperfine and Zeeman interactions, causes the three hyperfine lines of the I = 114N nucleus to vary differently in amplitude and line width. As a spin label becomes more mobile, there will be a relative increase in outer derivative (M = ± 1) peak heights with respect to the central (M = 0) peak. The spin-spin relaxation rate [T2(M)]-1 for these three lines can be represented by:
| (Eq. 1) |
(M = +1, 0, -1, correspond to left, central and right EPR lines, respectively. The peak heights between derivative extrema for these lines are taken as h(+1), h(0), and h(-1).) The A term is common to all three EPR lines, but B and C can be determined for correlation times < 1 ns from relative intensities and line widths of the three EPR lines. The details for determining B and C from empirical line shape analysis and their relation to tumbling correlation times are provided by Marsh (1989, pp 259-26246) and Miick et al.47 and methods for obtaining B and C are explicitly outlined in the Supporting Information of Qu et al.,48 where B and C, if different, yield anisotropic tumbling times. The average of B and C will yield an approximate, effective isotropic correlation time, τiso. If the tumbling is truly isotropic, B and C yield the same isotropic correlation time, τiso, given by Qin et al,49 according to Eq. 2 with minor changes to K and DH to reflect the specific spin probes that we use.
| (Eq. 2) |
For TOAC-labeled NCp7, K = 5.5 × 10⁻¹⁰ s, and ΔH = line width of the central EPR feature = 1.0 Gauss.
EPR line shape simulations and correlation time determinations based on the stochastic Liouville equation were carried out using the non-linear least squares stochastic Liouville (NLSL) fitting programs developed by Freed and co-workers.50 These programs simulated the EPR line shape under conditions that need not be restricted to correlation times less than 1 ns. These simulations modeled the motion of the nitroxide by a rotational diffusion tensor, R. For isotropic diffusion Riso = 1/(6τiso), and for axial anisotropic diffusion R|| = 1/(6τ||) and R⊥ = 1/(6τ⊥). The NLSL methods50 with additional constraints given by the MOMD model (Microscopic Order, Macroscopic Disorder) were included in several simulations to reflect a possible local ordering potential for the spin label. The MOMD method provided an isotropic correlation (τiso) and an order parameter (S).32 The correlation times from application of the MOMD model were comparable with those determined for the rest of the simulations by a simple isotropic diffusion tensor, and the order parameter, S, was small, S ~ 0.1. The small order parameter implies dynamic disorder with very little residual order, i.e., little need for an order parameter. In summary, for the present samples a potential restricting the motion of the spin label51 was not required and not statistically justified for fitting line shape data.
The following set of g and A values: gxx = 2.0095 ± 0.0001, gyy = 2.0067 ± 0.0001 gzz = 2.0027 ± 0.0001, Axx = 6.5 ± 0.5 G, Ayy = 6.5 ± 0.5 G, Azz = 34.7 ± 0.2 G, have been obtained from cryogenic W-band EPR of the related TOAC- phospholamban PLB.52 Our best NLSL fits were obtained with the same set of g-values but slightly larger hyperfine couplings of Axx = 6.95G, Ayy = 6.95 G, Azz = 35.15 G, which better reproduced the hyperfine splittings of the TOAC in our samples. An intrinsic Gaussian line width of 1.0 Gauss peak-to-peak was used in the simulations. This was the experimental central feature line width of the rapidly tumbling free TOAC molecule, and this width reflects small proton hyperfine couplings of methyl groups near the nitroxide moiety. In accord with previous structural information on nitroxides,53 we take the magnetic “z” direction along the NO-nitrogen π orbital, the magnetic “x” direction along the NO bond in Figure 1, and the magnetic “y” direction in the plane of the piperidine-N-oxyl and perpendicular to the x and z directions. The simulations (Figure 8, below) requiring anisotropic motion took the axis of rapid diffusive motion as the “y” axis.
Figure 8.
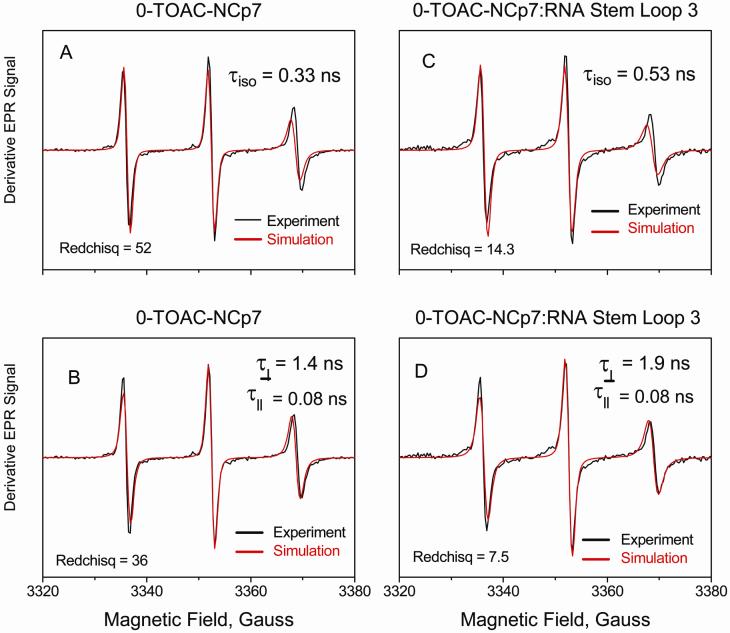
These traces compare the simulations via NLSL 50 of derivative X-band EPR line shapes from 0-TOAC-NCp7 (A, B) and from 0-TOAC-NCp7:RNA Stem-loop3 in a 1:1 ratio (C, D). The top spectra (A & C) were simulated by an isotropic diffusion tensor having one diffusion time τiso. The bottom spectra were simulated by an anisotropic diffusion tensor having separate τ⊥ and τ∥. As a measure of goodness of fit, Chi-squared per point values (Redchisq) provided by the NLSL routine are provided. On the basis of Chi-square comparison, the two-parameter fit (τ⊥ and τ∥) is better than the one parameter fit (τiso) by about 30 % for the 0-TOAC-NCp7 by itself and by nearly 50 % for the 0-TOAC-NCp7:RNA. The exact and independent values of τ⊥ and τ∥are questionable due to the high statistical correlation between them, a complication which is common at X-band.
Analysis using the NLSL program50 would be considered more rigorous than the empirical peak height method to obtain correlation times, e.g., τiso. However, we have found that the NLSL fitting of very narrow spectra due to rapid tumbling (τiso < 0.3 ns) can additionally be sensitive to the precise value of the average hyperfine coupling and to the intrinsic line width. The empirical peak height method lacks this sensitivity to hyperfine couplings and the intrinsic line width parameters, and therefore we report here the τiso results of both empirical and NLSL methods for short correlation times in Tables 1 and 2. It will be noted that the tumbling times obtained from the empirical method are generally shorter than those of the NLSL method, but there is consistency in the τiso differences regardless of method.
Table 1.
Dynamics of TOAC - NCp7
Table 2.
0-TOAC- NCp7 Tumbling Dynamics as Altered by TFE, T = 5 C
| Solvent | Sample | τiso, ns |
|---|---|---|
| 100% TFE | TOAC by self | 0.15a ± 0.02; 0.23b ± 0.02 |
| 50 mM Hepes buffer, pH 7.5 | 0-TOAC-NCp7, no Zn++ | 0.3b ± 0. 04 |
| 30% TFE | 0-TOAC-NCp7, no Zn++ | 0.8b ± 0.1 |
| 70% TFE | 0-TOAC-NCp7, no Zn++ | 1.2b ± 0.2 |
| 90% TFE | 0-TOAC-NCp7, no Zn++ | 2.9b ± 0.3 |
| 100% TFE | 0-TOAC-NCp7, with Zn++ | 2.8b ± 0.3 |
| 100% TFE | 0-TOAC-NCp7, no Zn++ | 6.6b ± 0.6 |
RESULTS
Rotational Dynamics of Spin-Labeled NCp7 in Buffer
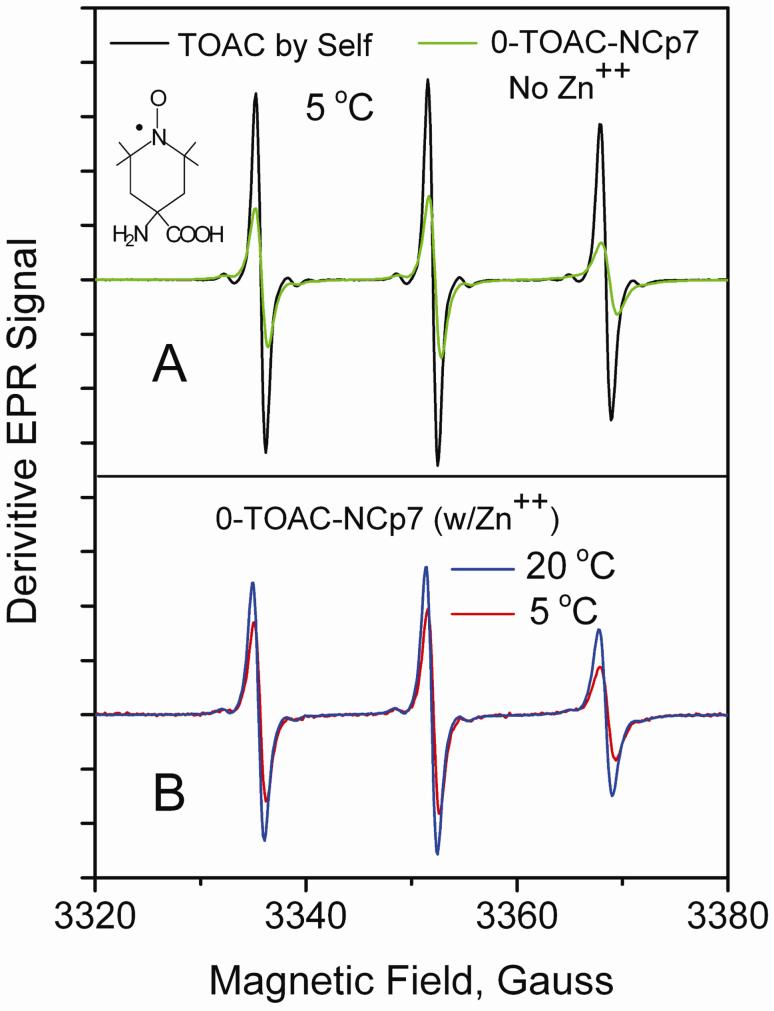
The spectrum of the free TOAC molecule, shown in Figure 4A (black trace), had very narrow lines, as typically are observed for rapid isotropic tumbling of a small molecule (TOAC spin label has a MW 215 g/mol) with τiso < 0.1 ns. To characterize the rotational dynamics of the N-terminal 0-TOACNCp7, EPR spectra were performed on the holo- (Zn++-containing) and the apo- (non-Zn++) protein. The spectra of the 0-TOAC-NCp7 in both the absence of Zn++ (Figure 4A, green trace) or its presence (Figures 4B, blue and red traces) displayed broader lines than free TOAC. The binding of Zn++ at the Zn-fingers led to no detectable difference in EPR-detected motion of the 0-TOAC in aqueous solvent. The EPR spectrum of 0-TOAC-NCp7 yielded via NLSL methods50 an isotropic correlation time, τiso, of 0.19 ns at 20 C and 0.33 ns at 5 C. The simpler peak height methods46,49 for estimating isotropic correlation times also indicated comparable times (See Table 1).
Figure 4.
Trace A compares at 5 C the rapidly tumbling, narrow-line spectrum of TOAC spin label by itself (MW 215), typical for a small molecule tumbling fast in solution, with the broader line 0-TOAC-NCp7, lacking Zn++, indicating that the EPR time scale is able to distinguish between TOAC by itself and NCP7 labeled at position 0 with TOAC. Trace B compares the EPR spectra of 0-TOAC-NCp7, having Zn++, at 5 and 20 C to show faster tumbling at the higher temperature. The buffer was 50 mM Hepes buffer, pH 7.5. Spectra were all normalized on their second integral and all spectra are shown to the same vertical scale.
Rotational Dynamics of Spin-Labeled NCp7 upon Binding of RNA Stem-loop 3
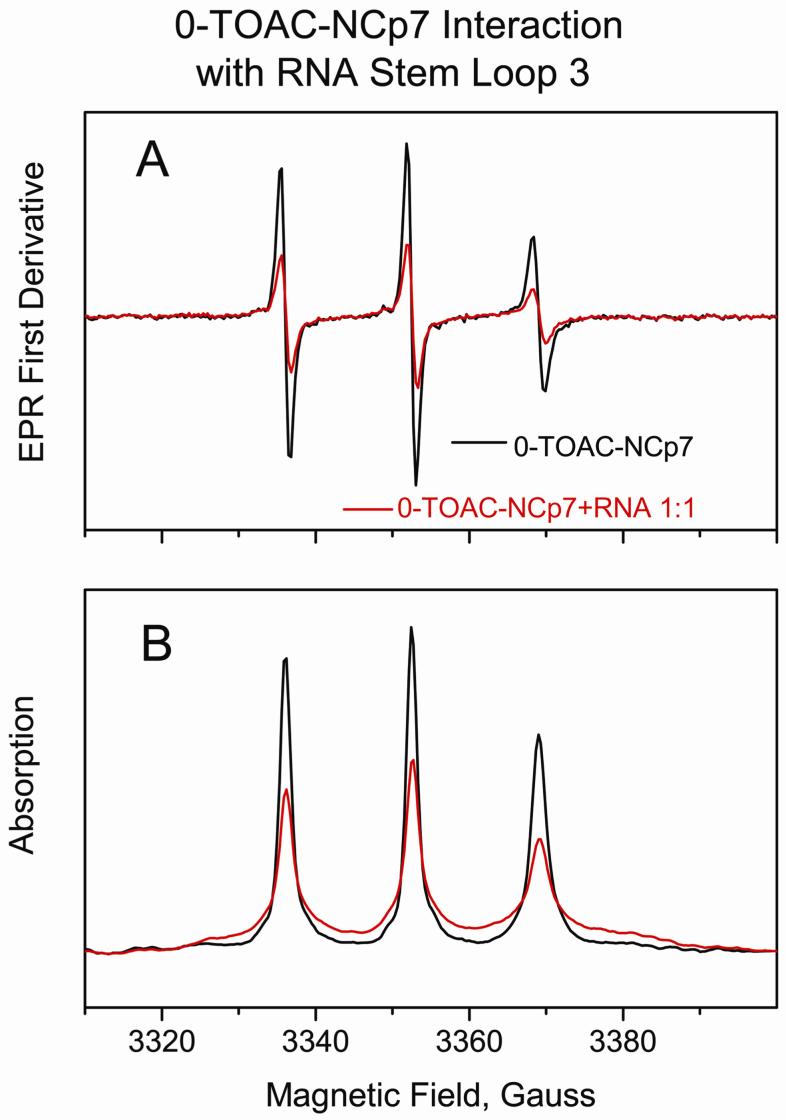
Upon exposure to RNA Stem-loop 3 at a 1:1 ratio, the EPR spectrum of 0-TOAC-NCp7 showed an increase in tumbling time and a broadened first derivative and absorption EPR line shape (Figure 5), indicating a slowing perturbation to the motion of the N-terminal tail of NCp7. τiso estimated from the spectra at 5 C in Figure 5 increased upon binding of RNA Stem-loop 3 from approximately 0.3 ns to 0.5 ns. The same change in the 0-TOAC-NCp7 line shape was observed when the RNA was added in a 1.5:1 ratio. The EPR line shapes (not shown) of 0-TOAC-NCp7 in the presence of 1:1 RNA Stem-loop 3 were identical at low ionic strength (50 mM Hepes) and high ionic strength (50 mM Hepes buffer plus 200 mM NaCl).
Figure 5.
This figure compares the EPR first derivative (A) and the direct absorption (B) EPR spectra of 0-TOAC-NCp7 (black trace) with a 1:1 mixture of 0-TOAC-NCp7/RNA-Stem-loop 3 (red trace). These spectra were obtained in 50 mM Hepes buffer, pH 7.5, at 5 C. Spectra were normalized on the second integral.
Rotational Dynamics in TFE. EPR of 0-TOAC-NCp7 Showing a Disorder-to-Order Conformational Change Induced by α-Helix-Enhancing TFE
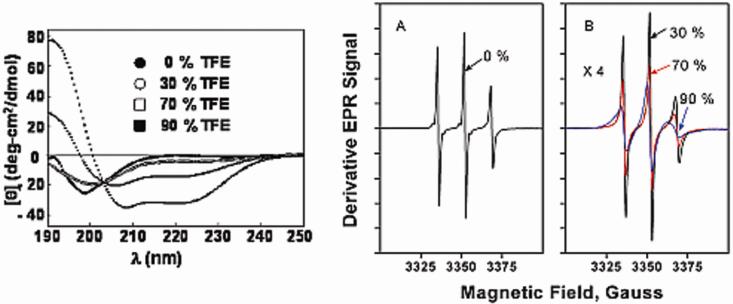
To elucidate the effectiveness of TOAC-labeled NCp7 at monitoring the rotational dynamics of NCp7 when NCp7 changes its conformation, we next investigated the dependence of the rotational dynamics upon 2,2,2-trifluoroethanol (TFE). TFE favors conversion of flexible regions of peptides to more ordered α-helical structures. CD was used to check the alteration of NCp7 secondary structure in buffer/TFE mixtures (Figure 6, left), where it should be noted that the studies shown in Figure 6 were conducted on 0-TOAC-apo-NCp7 lacking Zn++. As described previously,54,55 NCp7 in its apo form exhibits a typical random coil conformation in buffer, characterized by a strong negative CD band near 200 nm. Addition of TFE induced a shift from a disordered to an ordered conformation with a classical α-helical CD signature. At the higher TFE concentrations (≥ 70 %), apo-NCp7 displayed CD spectra typical of α-helical structures, with an upward band at 190 nm and two negative bands near 207 and 222 nm. Analysis of these spectra as linear combinations of basis CD spectra indicated 5% helical content in 50 mM Hepes, pH 7.5, and 95 % helical content in 90% TFE.
Figure 6.
Left: CD spectra of apo-NCp7 as a function of TFE concentration at 5 C. Shown to the right are the results (●) in 50 mM Hepes, pH 7.5, and upon addition of (○) 30% TFE, (□) 70% TFE, and (■) 90% TFE. EPR spectra right, A: 0-TOAC-apo-NCp7 in 50 mM Hepes, pH 7.5, B: upon addition of 30% TFE, 70% TFE, and: 90 % TFE. Spectra were normalized on the second integral. The scales of both graphs A and B are the same; the vertical amplitude of the traces in graph B has been multiplied by a factor of 4. Scan width 120 G.
EPR spectra of the 0-TOAC-NCp7 (Figure 6 A, B on the right) were obtained under the same conditions as those employed for CD. Large changes in the correlation times (estimated by an isotropic correlation time, τiso) accompanied the structural changes induced by TFE.56 τiso increased from (See Table 2), from 0.3 ns (0 % TFE), 0.8 ns (30 % TFE), 1.2 ns (70 % TFE), to 2.9 ns (90 % TFE). Since some of this change could be due to the greater microviscosity of TFE as it affects molecular tumbling, we measured the change in the tumbling time τiso of the small molecule, 215 MW TOAC between water and TFE at 5 C. τiso for TOAC changed from a value of 0.085 ns in water (average of empirical peak height and NLSL τiso values in Table 1) to an average of 0.19 ns in 100 % TFE (average of empirical peak height and NLSL τiso values in Table 2). The microviscosity-related tumbling time change for this small molecule in going from water to 100 % TFE was 2.2 ± 0.4. (The macroscopic viscosity increases by 1.4 in going from water to 100 % TFE. 57) Thus the increase in tumbling time for 0-TOAC-NCp7 due to increasing TFE was much larger than the expected increase of just the microviscosity of TFE.
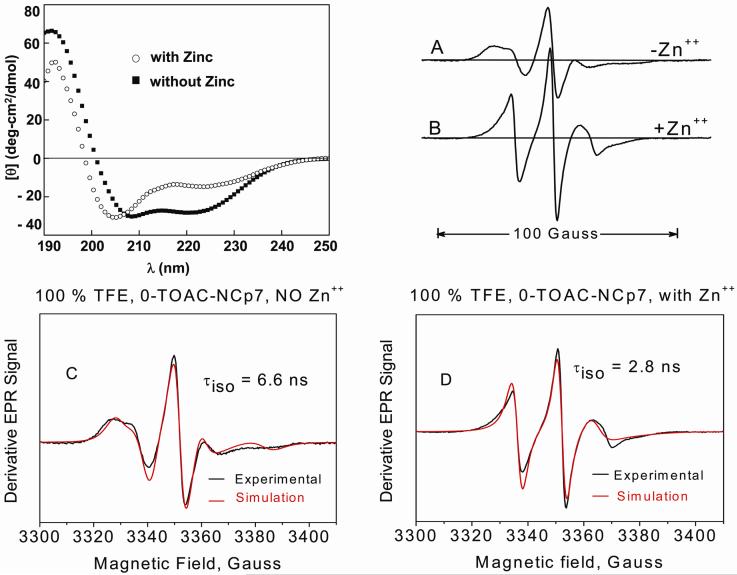
Circular dichroism (CD) was also used to monitor the conformational change of holo-NCp7 (Figure 7, left). As shown by CD, zinc binding was associated with a decreased α-helical component. EPR spectra obtained under similar conditions (Figure 7, right) showed by their narrower line shapes and shorter values of τiso clear differences between the apo- (Figure 7A) and holo-form (Figure 7B). Analysis of these spectra by the NLSL method50 is shown by the comparison of simulations and experimental spectra in Figures 7C and 7D from which isotropic correlation times of 6.6 ns at 100 % TFE for the apoprotein and 2.8 ns for the holoprotein were obtained. Such a comparison strongly suggests in 100% TFE a more dynamic conformation for the holoprotein than for the apoprotein and failure of TFE to convert non-flexible intact Zn-finger regions to α-helices.
Figure 7.
Left: CD spectra of NCp7 in the (■) absence and (○) presence of zinc in TFE at 5 C. Zinc was added in a 2 fold molar excess to NCp7. EPR spectra right, A: 0-TOAC-NCp7 in the absence (i.e., the apoprotein) and B presence of zinc (i.e., the holoprotein) in 100 % TFE. Spectra were normalized on the second integral. EPR were taken at 5 °C. Spectra C and D respectively compare the experimental EPR spectra of apo-0-TOAC-NCp7 in 100 % TFE and holo-0-TOAC-NCp7 in 100 % TFE with spectral simulations (in red) derived through NLSL methods.50
DISCUSSION
Probe Attachment by Solid-Phase Peptide Synthesis
Site-directed cysteine labeling has become the standard for attaching spin labels to proteins.34 The cysteine-directed/cysteine reactive method was deemed inappropriate for NCp7 because NCp7 had 6 essential cysteines associated with its Zn-fingers. We used recently developed and expanded methods for intimately attaching via peptide synthesis a spin label (TOAC) directly at an α-carbon.32 The N-terminal 0-position was the primary choice as a labeling site because its end position was expected not to perturb the structure and function of NCp7 with its RNA Stem-loop 3 complex. This expectation was functionally verified by the biological annealing assay30 of Figure 3.
EPR Dynamics
EPR study of the 0-TOAC-NCp7 (Figures 4 B) in aqueous buffer reported a fast probe tumbling motion on the time scale of tenths of nanoseconds, albeit motion by no means as fast as the tumbling of the unattached TOAC probe (Figure 4A). The isotropic tumbling correlation time of 0-TOAC-NCp7 decreased with increasing temperature, consistent with decrease in viscosity of aqueous buffer. The tumbling time of holo NCp7 in the 1:1 presence of RNA Stem-loop 3 was increased by more than 50 % (from ~0.3 to~ 0.5 ns at 5 C, Figure 5). Thus, the N-terminal TOAC spin label, even at the flexible N-terminal end, sensed the presence of RNA Stem-loop 3, probably through restriction of the segmental motion of the N-terminal peptide chain. Although the immediate vicinity of the basic N-terminal of NCp7 has been predicted from NMR study18 to interact with the stem of RNA Stem-loop 3 by ionic interaction, increasing the ionic strength by increasing NaCl concentration from 50 to 200 mM so as to reduce the ionic interaction did not alter the N-terminal TOAC tumbling time.
In trying to understand the probe motion, we discovered that a better EPR line shape simulation via NLSL methods50 for both the 0-TOAC-NCp7 and the 0-TOAC-NCp7:RNA Stem-loop 3 at a 1:1 ratio was obtained with an anisotropic diffusion tensor (τ||, τ⊥) rather than an isotropic diffusion tensor (τiso). A comparison of fitted spectra for 0-TOAC-NCp7 and for 0-TOAC-NCp7:RNA Stem-loop 3 at 1:1 ratio is shown in Figure 8, where the upper simulations in 8A & 8C utilized an isotropic diffusion tensor and the lower simulations 8B & 8D utilized an anisotropic diffusion tensor. For 0-TOAC-NCp7, τiso = 0.33 ns from Figure 8A; τ⊥ = 1.4 ns, τ|| = 0.08 ns from Figure 8B. For 0-TOAC-NCp7:RNA Stem-loop 3, τiso = 0.53 ns from Figure 8C; τ⊥ = 1.9 ns, τ|| = 0.08 ns from Figure 8D. Anisotropic simulations require identification of the direction for rapid diffusive motion with respect to the magnetic x, y, z axis of the g and A tensors. The most successful anisotropic simulations shown in Figure 8 B&D took the axis of rapid diffusive motion as the magnetic “y” axis which lies in the plane of the nitroxide-containing piperidine-N-oxyl ring perpendicular to the NO bond direction.53 Such motion would likely reflect rotation of the piperidine-N-oxyl ring about the C-a carbon. A 6.6 kDa rigid sphere (0-TOAC-NCp7 molecular weight ~6.6 kDa) should tumble with ~1.8 ns correlation time at room temperature in dilute buffer (h ≈ 1 cP) and at 5 C about 1.5 times slower with a 2.7 ns correlation time due to the 1.5 times higher water viscosity (See formula 5 of Qin et al.58). Thus, τ⊥ from the anisotropic simulation is comparable with the overall molecular tumbling time expected for the NCp7 and is consistently longer for the NCp7:RNA complex than for the NCp7 by itself. On the other hand, τ|| conceivably reflects fast local rotation of the nitroxide about the α-carbon bond at the 0-position, unaffected by binding of RNA. It must be pointed out that these X-band (~9.5 GHz) EPR simulations via the NLSL methods50 provide fitted values of τ|| and τ⊥ that were statistically highly correlated, and so the unique values of τ|| and τ⊥ are problematic. The probe rotational tumbling may well be anisotropic rather than isotropic, but multi-frequency EPR measurements (up to 230 GHz) are needed and planned to unravel the potentially anisotropic diffusion tensor59 (K. Earle, private communication).
The EPR spectra of apo-0-TOAC-NCp7 in the presence of increasing amounts of TFE reported a progressively longer tumbling time than 0-TOAC-NCp7 in dilute buffer. There would be an expected increase in tumbling time due to the increase in microviscosity of solvent in going from aqueous buffer to 100 % TFE. This increase, as monitored by the change in τiso reported by small molecule TOAC (not attached to NCp7), was about 2.2, and the increase in τiso even at 30 % TFE was greater than 2.2. Thus the increase in tumbling time for apo-0-TOAC-NCp7 due to increasing TFE was much larger than the expected increase due to the viscosity and was concomitant with formation of the α-helical conformation
We estimate here what the tumbling time of a globular protein with the 6.6 kDa molecular weight of 0-TOAC-NCp7 in high viscosity TFE at 5 C should be. We have previously estimated the tumbling time of a 6.6 kDa sphere in dilute buffer at 5 C as 2.7 ns. We then use the ~2.2-fold increase in microviscosity between dilute buffer and TFE at 5 C to arrive at an estimate of 5.9 ns (= 2.7 ns X 2.2) as the expected tumbling time, τiso, for the globular protein in 100 % TFE. This time is comparable with the experimentally measured 6.6 ns correlation time of 0-TOAC-NCp7 in 100 % TFE. However, we do point out that peptides comparable in size to NCp7 have been known to self-associate at high concentrations of TFE 57 to form dimers and trimers.60 It is possible that the 2-fold difference in τiso occurring for apo-0-TOAC-NCp7 between in 90 % TFE and 100 % TFE could reflect some self-association of the peptide as well as a TFE-induced α-helical structure.
By application of TFE the peptide fold of apo-NCp7 lacking zinc was converted, as shown by its CD signature, to an α-helical fold. However the CD signature (Figure 7, upper left) showed that holo-NCp7 did not convert entirely to α-helical form. The strong binding of zinc to the cysteines and histidine of a zinc finger must cause retention of the local non-helical conformation of zinc finger regions even in the presence of 100 % TFE. When there were intact Zn-fingers, there was significant a decrease in tumbling time sensed at the N-terminal TOAC position as shown in Figure 7 B&D. The implication is that intact Zn-fingers diminish the tumbling volume47 sensed by the 0-TOAC probe while they simultaneously interfere with the TFE-induced tendency to form an overall compact helical secondary structure. Although TFE is a non-biological solvent, the preservation of the local Zn-finger structure in it implies a strong and biologically relevant tendency for NCp7 to retain local structure in the Zn-finger regions while altering its fold elsewhere in response to perturbation. The perturbation here is the presence of TFE; in a biologically relevant situation the perturbation could be the electrostatic attraction of NCp7 to an oligonucleotide
CONCLUSIONS
We have demonstrated that a TOAC spin labeled derivative of NCp7 can be synthesized directly by continuous solid phase peptide synthesis, resulting in biologically active material. The TOAC, as placed at the N-terminal 0-position, was sensitive to fast local and segmental motions with correlation times of order 0.3 ns, rather than overall tumbling motion of the NCp7 peptide complex, which would be occurring on the order of several ns. There was evidence from simulation that there could be anisotropy to the probe tumbling (τ⊥ >> τ||) where τ⊥ was comparable with the overall molecular tumbling time expected for NCp7. The N-terminal TOAC, though in a region of flexibility, does sense the binding of the RNA Stem-loop 3 partner by substantial slowing of its fast probe motion, regardless of whether the tumbling was assumed isotropic or anisotropic. Marked changes in EPR spectra in the presence of the α-helical enhancer TFE showed that N-terminal TOAC is a reporter for the considerable lability of NCp7. Because the N-terminal 0-TOAC-NCp7 does sense RNA binding without perturbing function, the N terminal spin location will be an appropriate starting point for: 1) stopped-flow EPR kinetic study61,62 to determine the time course of stem-loop/NCp7 recognition-binding when larger quantities of 0-TOAC-NCp7 become available; 2) determination through bi-label study of distances to positions on the RNA stem-loop partner; 3) verification of the anisotropic probe motion, including possible tilt of the diffusion tensor with respect to magnetic axes, by high frequency EPR.
Acknowledgments
CPS acknowledges support from NIH grant GM066253-01A1. CBK acknowledges the support of a Minnesota Medical Foundation (MMF Grant). We are grateful to Dr. Edmund Howard (Dept. of Biochemistry, Molecular Biology, and Biophysics, University of Minnesota) for simulations using the MOMD model, to Dr. My-Nuong Vo (Department of Chemistry, University of Minnesota) for assistance with activity assays, to Prof. David Thomas (Dept. of Biochemistry, Molecular Biology, and Biophysics, University of Minnesota) for detailed guidance, and to Prof. Keith Earle (Dept. of Physics, University at Albany) for guiding us in dealing with the non-linear least-squares stochastic Liouville (NLSL) simulations
REFERENCES
- 1.Berg JM. Science. 1986;232:485–487. doi: 10.1126/science.2421409. [DOI] [PubMed] [Google Scholar]
- 2.Green LM, Berg JM. Proc Natl Acad Sci U S A. 1990;87:6403–6407. doi: 10.1073/pnas.87.16.6403. [DOI] [PMC free article] [PubMed] [Google Scholar]
- 3.Carteau S, Gorelick RJ, Bushman FD. J Virol. 1999;73:6670–6679. doi: 10.1128/jvi.73.8.6670-6679.1999. [DOI] [PMC free article] [PubMed] [Google Scholar]
- 4.Cristofari G, Darlix JL. Prog Nucleic Acid Res Mol Biol. 2002;72:223–268. doi: 10.1016/s0079-6603(02)72071-0. [DOI] [PubMed] [Google Scholar]
- 5.Darlix JL, Lapadat-Tapolsky M, de Rocquigny H, Roques BP. J Mol Biol. 1995;254:523–537. doi: 10.1006/jmbi.1995.0635. [DOI] [PubMed] [Google Scholar]
- 6.Rein A, Henderson LE, Levin JG. Trends Biochem Sci. 1998;23:297–301. doi: 10.1016/s0968-0004(98)01256-0. [DOI] [PubMed] [Google Scholar]
- 7.Tsuchihashi Z, Brown PO. J Virol. 1994;68:5863–5870. doi: 10.1128/jvi.68.9.5863-5870.1994. [DOI] [PMC free article] [PubMed] [Google Scholar]
- 8.Hargittai MR, Gorelick RJ, Rouzina I, Musier-Forsyth K. J Mol Biol. 2004;337:951–968. doi: 10.1016/j.jmb.2004.01.054. [DOI] [PubMed] [Google Scholar]
- 9.Urbaneja MA, Wu M, Casas-Finet JR, Karpel RL. J Mol Biol. 2002;318:749–764. doi: 10.1016/S0022-2836(02)00043-8. [DOI] [PubMed] [Google Scholar]
- 10.Williams MC, Gorelick RJ, Musier-Forsyth K. Proc Natl Acad Sci U S A. 2002;99:8614–8619. doi: 10.1073/pnas.132128999. [DOI] [PMC free article] [PubMed] [Google Scholar]
- 11.Williams MC, Rouzina I, Wenner JR, Gorelick RJ, Musier-Forsyth K, Bloomfield VA. Proc Natl Acad Sci U S A. 2001;98:6121–6126. doi: 10.1073/pnas.101033198. [DOI] [PMC free article] [PubMed] [Google Scholar]
- 12.Dib-Hajj F, Khan R, Giedroc DP. Protein Sci. 1993;2:231–243. doi: 10.1002/pro.5560020212. [DOI] [PMC free article] [PubMed] [Google Scholar]
- 13.Kankia BI, Barany G, Musier-Forsyth K. Nucleic Acids Res. 2005;33:4395–4403. doi: 10.1093/nar/gki741. [DOI] [PMC free article] [PubMed] [Google Scholar]
- 14.Stoylov SP, Vuilleumier C, Stoylova E, De Rocquigny H, Roques BP, Gerard D, Mély Y. Biopolymers. 1997;41:301–312. doi: 10.1002/(SICI)1097-0282(199703)41:3<301::AID-BIP5>3.0.CO;2-W. [DOI] [PubMed] [Google Scholar]
- 15.You JC, McHenry CS. J Biol Chem. 1994;269:31491–31495. [PubMed] [Google Scholar]
- 16.Cruceanu M, Gorelick RJ, Musier-Forsyth K, Rouzina I, Williams MC. J Mol Biol. 2006;363:867–877. doi: 10.1016/j.jmb.2006.08.070. [DOI] [PubMed] [Google Scholar]
- 17.Shubsda MF, Paoletti AC, Hudson BS, Borer PN. Biochemistry. 2002;41:5276–5282. doi: 10.1021/bi016045+. [DOI] [PubMed] [Google Scholar]
- 18.De Guzman RN, Wu ZR, Stalling CC, Pappalardo L, Borer PN, Summers MF. Science. 1998;279:384–388. doi: 10.1126/science.279.5349.384. [DOI] [PubMed] [Google Scholar]
- 19.Vuilleumier C, Bombarda E, Morellet N, Gerard D, Roques BP, Mély Y. Biochemistry. 1999;38:16816–16825. doi: 10.1021/bi991145p. [DOI] [PubMed] [Google Scholar]
- 20.Amarasinghe GK, De Guzman RN, Turner RB, Chancellor KJ, Wu ZR, Summers MF. J Mol Biol. 2000;301:491–511. doi: 10.1006/jmbi.2000.3979. [DOI] [PubMed] [Google Scholar]
- 21.Amarasinghe GK, Zhou J, Miskimon M, Chancellor KJ, McDonald JA, Matthews AG, Miller RR, Rouse MD, Summers MF. J Mol Biol. 2001;314:961–970. doi: 10.1006/jmbi.2000.5182. [DOI] [PubMed] [Google Scholar]
- 22.Summers MF, Henderson LE, Chance MR, Bess JW, Jr., South TL, Blake PR, Sagi I, Perez-Alvarado G, Sowder RC, 3rd, Hare DR, et al. Protein Sci. 1992;1:563–574. doi: 10.1002/pro.5560010502. [DOI] [PMC free article] [PubMed] [Google Scholar]
- 23.Tompa P, Csermely P. Faseb J. 2004;18:1169–1175. doi: 10.1096/fj.04-1584rev. [DOI] [PubMed] [Google Scholar]
- 24.Tisne C, Roques BP, Dardel F. J Mol Biol. 2001;306:443–454. doi: 10.1006/jmbi.2000.4391. [DOI] [PubMed] [Google Scholar]
- 25.Johnson PE, Turner RB, Wu ZR, Hairston L, Guo J, Levin JG, Summers MF. Biochemistry. 2000;39:9084–9091. doi: 10.1021/bi000841i. [DOI] [PubMed] [Google Scholar]
- 26.Lee BM, De Guzman RN, Turner BG, Tjandra N, Summers MF. J Mol Biol. 1998;279:633–649. doi: 10.1006/jmbi.1998.1766. [DOI] [PubMed] [Google Scholar]
- 27.Chen M, Margittai M, Chen J, Langen R. J Biol Chem. 2007;34:24790–24797. doi: 10.1074/jbc.M700368200. [DOI] [PubMed] [Google Scholar]
- 28.Margittai M, Langen R. Methods Enzymol. 2006;413:122–139. doi: 10.1016/S0076-6879(06)13007-4. [DOI] [PubMed] [Google Scholar]
- 29.Hatters DM, Budamagunta MS, Voss JC, Weisgraber KH. J Biol Chem. 2005;280:34288–34295. doi: 10.1074/jbc.M506044200. [DOI] [PubMed] [Google Scholar]
- 30.Vo MN, Barany G, Rouzina I, Musier-Forsyth K. J Mol Biol. 2006;363:244–261. doi: 10.1016/j.jmb.2006.08.039. [DOI] [PubMed] [Google Scholar]
- 31.Xi X, Sun Y, Karim CB, Grigoryants VM, Scholes CP. Biochemistry. 2008;47:0000–0000. doi: 10.1021/bi800602e. in press. [DOI] [PubMed] [Google Scholar]
- 32.Karim CB, Kirby TL, Zhang Z, Nesmelov Y, Thomas DD. Proc Natl Acad Sci U S A. 2004;101:14437–14442. doi: 10.1073/pnas.0402801101. [DOI] [PMC free article] [PubMed] [Google Scholar]
- 33.Cosa G, Zeng Y, Liu HW, Landes CF, Makarov DE, Musier-Forsyth K, Barbara PF. J Phys Chem B Condens Matter Mater Surf Interfaces Biophys. 2006;110:2419–2426. doi: 10.1021/jp054189i. [DOI] [PubMed] [Google Scholar]
- 34.Hubbell WL, Cafiso DS, Altenbach C. Nat Struct Biol. 2000;7:735–739. doi: 10.1038/78956. [DOI] [PubMed] [Google Scholar]
- 35.Columbus L, Kalai T, Jeko J, Hideg K, Hubbell WL. Biochemistry. 2001;40:3828–3846. doi: 10.1021/bi002645h. [DOI] [PubMed] [Google Scholar]
- 36.Hubbell WL, McHaourab HS, Altenbach C, Lietzow MA. Structure. 1996;4:779–783. doi: 10.1016/s0969-2126(96)00085-8. [DOI] [PubMed] [Google Scholar]
- 37.McHaourab HS, Lietzow MA, Hideg K, Hubbell WL. Biochemistry. 1996;35:7692–7704. doi: 10.1021/bi960482k. [DOI] [PubMed] [Google Scholar]
- 38.Toniolo C, Valente E, Formaggio F, Crisma M, Pilloni G, Corvaja C, Toffoletti A, Martinez GV, Hanson MP, Millhauser GL, et al. J Pept Sci. 1995;1:45–57. doi: 10.1002/psc.310010107. [DOI] [PubMed] [Google Scholar]
- 39.Marchetto R, Schreier S, Nakaie CR. J Am Chem Soc. 1993;115:11042–11043. [Google Scholar]
- 40.King DS, Fields CG, Fields GB. Int J Pept Protein Res. 1990;36:255–266. doi: 10.1111/j.1399-3011.1990.tb00976.x. [DOI] [PubMed] [Google Scholar]
- 41.Tummino PJ, Scholten JD, Harvey PJ, Holler TP, Maloney L, Gogliotti R, Domagala J, Hupe D. Proc Natl Acad Sci U S A. 1996;93:969–973. doi: 10.1073/pnas.93.3.969. [DOI] [PMC free article] [PubMed] [Google Scholar]
- 42.Karim CB, Marquardt CG, Stamm JD, Barany G, Thomas DD. Biochemistry. 2000;39:10892–10897. doi: 10.1021/bi0003543. [DOI] [PubMed] [Google Scholar]
- 43.Adler AJ, Greenfield NJ, Fasman GD. Methods in Enzymology. 1973;27:675–735. doi: 10.1016/s0076-6879(73)27030-1. [DOI] [PubMed] [Google Scholar]
- 44.Greenfield N, Fasman GD. Biochemistry. 1969;8:4108–4116. doi: 10.1021/bi00838a031. [DOI] [PubMed] [Google Scholar]
- 45.Lockwood NA, Tu RS, Zhang Z, Tirrell MV, Thomas DD, Karim CB. Biopolymers. 2003;69:283–292. doi: 10.1002/bip.10365. [DOI] [PubMed] [Google Scholar]
- 46.Marsh D. In: Biological Magnetic Resonance. Berliner L, Ruben J, editors. Plenum; New York: 1989. pp. 255–303. [Google Scholar]
- 47.Miick SM, Todd AP, Millhauser GL. Biochemistry. 1991;30:9498–9503. doi: 10.1021/bi00103a016. [DOI] [PubMed] [Google Scholar]
- 48.Qu K, Vaughn JL, Sienkiewicz A, Scholes CP, Fetrow JS. Biochemistry. 1997;36:2884–2897. doi: 10.1021/bi962155i. [DOI] [PubMed] [Google Scholar]
- 49.Qin PZ, Butcher SE, Feigon J, Hubbell WL. Biochemistry. 2001;40:6929–6936. doi: 10.1021/bi010294g. [DOI] [PubMed] [Google Scholar]
- 50.Budil DE, Lee S, Saxena S, Freed JH. (Ser A).J Magn Reson. 1996;120:155–189. [Google Scholar]
- 51.Earle KA, Budil DE. In: Advanced ESR Methods in Polymer Research. Schlick S, editor. John Wiley and Sons; New York: 2006. [Google Scholar]
- 52.Nesmelov YE, Karim CB, Song L, Fajer PG, Thomas DD. Biophys J. 2007;93:2805–2812. doi: 10.1529/biophysj.107.108910. [DOI] [PMC free article] [PubMed] [Google Scholar]
- 53.Griffith OH, Cornell DW, McConnell HM. Journal of Chemical Physics. 1965;43:2909–2910. [Google Scholar]
- 54.Gregoire CJ, Gautheret D, Loret EP. J Biol Chem. 1997;272:25143–25148. doi: 10.1074/jbc.272.40.25143. [DOI] [PubMed] [Google Scholar]
- 55.Surovoy A, Dannull J, Moelling K, Jung G. J Mol Biol. 1993;229:94–104. doi: 10.1006/jmbi.1993.1011. [DOI] [PubMed] [Google Scholar]
- 56.Schreier S, Barbosa SR, Casallanovo F, Vieira Rde F, Cilli EM, Paiva AC, Nakaie CR. Biopolymers. 2004;74:389–402. doi: 10.1002/bip.20092. [DOI] [PubMed] [Google Scholar]
- 57.Yao S, Howlett GJ, Norton RS. J Biomol NMR. 2000;16:109–119. doi: 10.1023/a:1008382624724. [DOI] [PubMed] [Google Scholar]
- 58.Qin PZ, Hideg K, Feigon J, Hubbell WL. Biochemistry. 2003;42:6772–6783. doi: 10.1021/bi027222p. [DOI] [PubMed] [Google Scholar]
- 59.Barnes JP, Liang Z, McHaourab HS, Freed JH, Hubbell WL. Biophys J. 1999;76:3298–3306. doi: 10.1016/S0006-3495(99)77482-5. [DOI] [PMC free article] [PubMed] [Google Scholar]
- 60.Barnham KJ, Catalfamo F, Pallaghy PK, Howlett GJ, Norton RS. Biochim Biophys Acta. 1999;1435:127–137. doi: 10.1016/s0167-4838(99)00214-9. [DOI] [PubMed] [Google Scholar]
- 61.Grigoryants VM, DeWeerd KA, Scholes CP. Journal of Physical Chemistry B. 2004;108:9463–9468. [Google Scholar]
- 62.Grigoryants VM, Veselov AV, Scholes CP. Biophys J. 2000;78:2702–2708. doi: 10.1016/S0006-3495(00)76814-7. [DOI] [PMC free article] [PubMed] [Google Scholar]


