Abstract
Adiponectin has anti-diabetic properties and patients with obesity, diabetes and insulin resistance have low plasma adiponectin levels. However, although kidney disease is associated with insulin resistance, adiponectin is elevated in end stage renal disease. Here we determine if adipose tissue production of adiponectin is increased in renal disease in a case-control study of 36 patients with end stage renal disease and 23 kidney donors. Blood and tissue samples were obtained at kidney transplantation and donation. The mean plasma adiponectin level was significantly increased to 15.6 mg/ml in cases compared to 8.4 mg/ml in controls. Plasma levels of the inflammatory adipokines tumor necrosis factor α, interleukin 6 and high sensitivity C-reactive protein were significantly higher in cases compared to controls. Adiponectin mRNA and protein expression in visceral and subcutaneous fat was significantly higher in cases than controls while adiponectin receptor 1 mRNA expression was significantly increased in peripheral blood cells, muscle and adipose tissue in cases compared to controls. Thus, our study suggests that adipose tissue production of adiponectin contributes to the high plasma levels seen in end stage renal disease.
Keywords: adiponectin, inflammation, end-stage renal disease
Introduction
Adiponectin is a protein produced primarily by adipocytes from white and brown adipose tissue(1). Adipose tissue also produces several other pro-inflammatory cytokines and hormones including plasminogen activator inhibitor-1 (PAI-1), interleukin 6 (IL-6), tumor necrosis factor alpha (TNFα), leptin and resistin, but adiponectin is the most abundant (2). Other tissues such as the myocardium (3), skeletal muscle (4), liver (5), bone (6) and salivary gland (7) also have the capacity to produce adiponectin. Adiponectin production by non-adipose tissue is markedly lower than in fat and is unlikely to contribute significantly to plasma levels. Adiponectin levels in plasma vary from 2–30 mg/L representing 0.01% of the total plasma protein (8). Full length adiponectin is found as different multimers in human plasma: the low molecular weight trimer (LMW) that consists of 3 adiponectin molecules that bind through their collagen domain is the most abundant form of adiponectin in plasma. There is also a middle molecular weight (MMW) hexamer and the HMW isoform that is composed of multiple species depending on the number of adiponectin molecules that are associated (9, 10). Although little is known about adiponectin’s isoform function, HMW adiponectin seems to be the more biologically active component (10).
Adiponectin has two membrane receptors: Adiponectin Receptor-1 and Adiponectin Receptor-2 (AdipoR1, AdipoR2) (11). These are ubiquitously expressed in human tissues, but more predominantly in muscle and liver where they exert their major antidiabetic functions. Based on rodent experiments, adiponectin appears to have anti-diabetic, anti-atherogenic and anti-inflammatory properties (12). These findings are consistent with human clinical data which show an association between low plasma adiponectin levels and obesity, insulin resistance, metabolic syndrome and diabetes mellitus (12). Low adiponectin levels in humans have also been associated with increased atherosclerotic cardiovascular events, hypertension and dyslipidemia (13).
Contrary to expectations, plasma adiponectin levels are high in chronic kidney disease (CKD) (14) and end stage renal disease (ESRD) (15) despite greater insulin resistance (16), cardiovascular disease and dyslipidemia (17). Levels of the HMW adiponectin isoform are also elevated in ESRD although the distribution of all the adiponectin isoforms in chronic kidney disease and ESRD has not been well studied (18).
The underlying cause for the higher levels of circulating adiponectin in kidney disease is still unclear (14). It has been suggested that decreased renal clearance is the cause of increased plasma levels of adiponectin in patients with failing kidney function (19). We postulate that the cause may be adiponectin resistance, with an abnormal receptor-ligand interaction, or augmented adiponectin production secondary to chronic inflammation. There is currently no definitive data to favor one hypothesis over the other.
Cardiovascular disease (CVD) is the leading cause of death in CKD patients (17). Nontraditional CVD risk factors such as vascular calcification, inflammation, oxidative stress and endothelial dysfunction (20) may contribute to CVD development in CKD patients. An abnormal pattern of adipokines, including both adiponectin as well as pro-inflammatory cytokines, are factors that may also contribute to CVD. Although adiponectin levels are higher in CKD patients compared to those with normal kidney function, within the CKD population relatively low levels of adiponectin are predictive of poor CVD outcomes (15) and are inversely related to glucose abnormalities (21). Moreover, both subcutaneous and visceral adipose tissues from patients with ESRD express higher levels of pro-inflammatory cytokines (22). Increased expression of inflammatory cytokines may contribute significantly to the chronic inflammatory state of uremia and subsequently play a role in CVD risk.
Further delineation of the adiponectin axis in CKD is needed to delineate the function and regulation of this hormone in ESRD patients and its relationship to insulin sensitivity and CVD. The purpose of this study was to determine whether there is greater adiponectin and adiponectin receptor production in tissues, including visceral fat, subcutaneous fat, and muscle, of ESRD patients compared to healthy controls. We also compared plasma levels of adiponectin and proinflammatory cytokines in these ESRD patients and healthy controls.
Results
Participants Characteristics
Our study sample included 36 ESRD patients and 23 controls. The clinical characteristics of the study population are highlighted in Table 1. The mean age of the ESRD cohort was 50 years and the controls were younger, with a mean age of 41 years. There were more females in the control group (65% versus 33% in the ESRD group). The mean body mass index (BMI) of the ESRD cases was 27 kg/m2 and 25 kg/m2 for the controls. In our study sample, 59% of the ESRD and 74% of the controls were white. Fasting blood sugar was significantly higher in the ESRD group than in the control group. In the ESRD group, 70% were receiving renal replacement therapies (4 patients receiving peritoneal dialysis and 22 receiving hemodialysis), 38% had DM, 8% had hepatitis C virus infection, and 16% had a prior kidney transplant. The main cause of kidney disease in our ESRD cases was DM and hypertension (47%) followed by glomerulonephritis (31%), polycystic kidney disease (11%) and miscellaneous causes of ESRD (11%)
Table 1.
Baseline characteristics of study subjects
| Variable | Controls | ESRD (Cases) |
||
|---|---|---|---|---|
| (N=23) | All (N=36) | NonDM (N=21) | DM (N=15) | |
| Age (yrs) | 41.9 (10.63) | 50.27 (12.45) | 45 (12.3) | 57.1 (9.2) |
| Sex (female) | 15 (65) | 12 (33) | 6 (28) | 6 (40) |
| Height (inch) | 68.16 (4.87) | 67.21 (4.69) | 68.14 (5.7) | 68.2 (3.4) |
| Weight (lb) | 167.69 (32.38) | 183.63 (41.52) | 184.3 (42) | 182.6 (37.9) |
| BMI (kg/m2) | 25.87 (4.01) | 27.27 (4.42) | 27.1 (4.7) | 27.4 (4.1) |
| Normal | 10 (45%) | 10 (28%) | 6 (29%) | 4 (27%) |
| Overweight | 10 (45%) | 13 (36%) | 9 (43%) | 4 (27%) |
| Obese | 3 (10%) | 13 (36%) | 6 (29%) | 7 (47%) |
| Race | ||||
| White | 17 (74%) | 21 (59%) | 15 (71%) | 6 (40%) |
| Black | 4 (17%) | 12 (34%) | 4 (19%) | 8 (53%) |
| Other | 2 (9%) | 3 (7%) | 2 (10%) | 1 (7%) |
| FBS (mg/dl) | 85.14 (10.7) | 108.13 (43.12) | 90.6 (6.5) | 132.6 (59) |
| Creatinine (mg/dl) | 0.76 (0.12) | 6.89 (2.67) | 7 (2.9) | 6.5 (2) |
| Ccr(ml/min) a | 127.46 (26.28) | 11 (3.55) | 11.1 (3.9) | 10.5 (2.1) |
Categorical Variables: Frequencies (Percents), Continuous Variables: Mean (SD) BMI: Body mass index, FBS: fasting blood sugar, Ccr Creatinine Clearance
Clearance in controls measured by 24h urine collection, in cases by MDRD equation
Plasma Adipokine Levels
Table 2 shows the plasma adipokine values in our study groups. All the inflammatory adipokines, except PAI-1, were significantly higher in ESRD cases even after stratification for DM status (p<0.001 for all). Adiponectin was also significantly higher in ESRD patients compared to controls (P=0.001). In addition, subgroup analysis demonstrated significantly higher adiponectin in both nonDM (P=0.05) and DM ESRD subjects (P<0.001) compared to controls. The DM ESRD cases had the highest levels of adiponectin, IL-6 and hsCRP. Women had higher adiponectin levels than men (14.94±9.2 versus 11.59±7.72 respectively, p=0.14) which is consistent with the expected sexual dimorphism of the hormone. On further stratification by our study groups, women continue to have higher adiponectin levels than men although the differences were statistically significant only in the DM ESRD cases (control males 6±4.25 versus females 9.77±4.53, p=0.08; nonDM ESRD cases-males 12.19±7.79 versus females 15.7±8.71, p=0.37; and DM ESRD cases-males 14.94±7.94 versus females 25.4±8.95, p=0.03). The peritoneal dialysis participants had higher adiponectin levels than the hemodialysis patients but the difference was not statistically significant (19.6±8.7 versus 15.1±9.1, p= 0.36). Further analysis using linear regression models with adjustment for obesity and renal function again revealed that IL-6, TNFα, hsCRP, as well as adiponectin were significantly higher in the ESRD group compared with the control group independent of obesity status (p<0.001 for IL-6 and adiponectin, p=0.007 for TNFα, and p=0.001 for hsCRP). Alternatively, when all participants (both ESRD and controls) were stratified according to BMI status (normal weight, overweight, obese), the overweight or obese participants have higher inflammatory cytokines and lower adiponectin compared to participants of normal weight independent of their renal function status (P<0.05 for adiponectin; P<0.05 for hsCRP).
Table 2.
Cytokines for diabetic and non-diabetic cases and controls (N=59)
| Variable | Controls | ESRD (Cases) |
||
|---|---|---|---|---|
| (N = 23) | All (N=36) | NonDM (N = 21) | DM (N = 15) | |
| Adiponectin (ug/ml) | 8.46 (4.70) | 15.66 (9) | 13.20 (8.01) | 19.13 (9.64) |
| p value | 0.001a | 0.001b | ||
| IL-6 (pg/ml)c | 2.9 [2.1, 2.9] | 6.2 [3.8, 10.4] | 5.3 [3.4, 6.7] | 7.9 [4.3, 16.0] |
| p value | 0.02a | <0.001b | ||
| PAI-1 (ng/ml) | 50.60 (19.7) | 44.63 (22.67) | 47.73 (25.1) | 40.30 (17.8) |
| p value | 0.30a | 0.30b | ||
| TNFα (pg/ml) | 10.17 (3.35) | 19.17 (12.14) | 21.12 (15.2) | 16.46 (4.88) |
| p value | 0.002 a | <0.001b | ||
| hsCRP (mg/dl) | 1.26 (0.94) | 4.16 (3) | 3.61 (2.94) | 4.94 (3.18) |
| p value | <0.001 a | <0.001b | ||
Continuous Variables: Mean (SD) or Geometric Mean [1st quartile, 3rd quartile]
t test: differences between controls and all cases.
ANOVA F-test: any groups different (3-way comparison test: controls vs nonDM cases vs DM cases)
Data natural log transformed: geometric means with [first quartile, third quartile] presented
Adiponectin and AdipoR mRNA expression levels in Tissue and blood
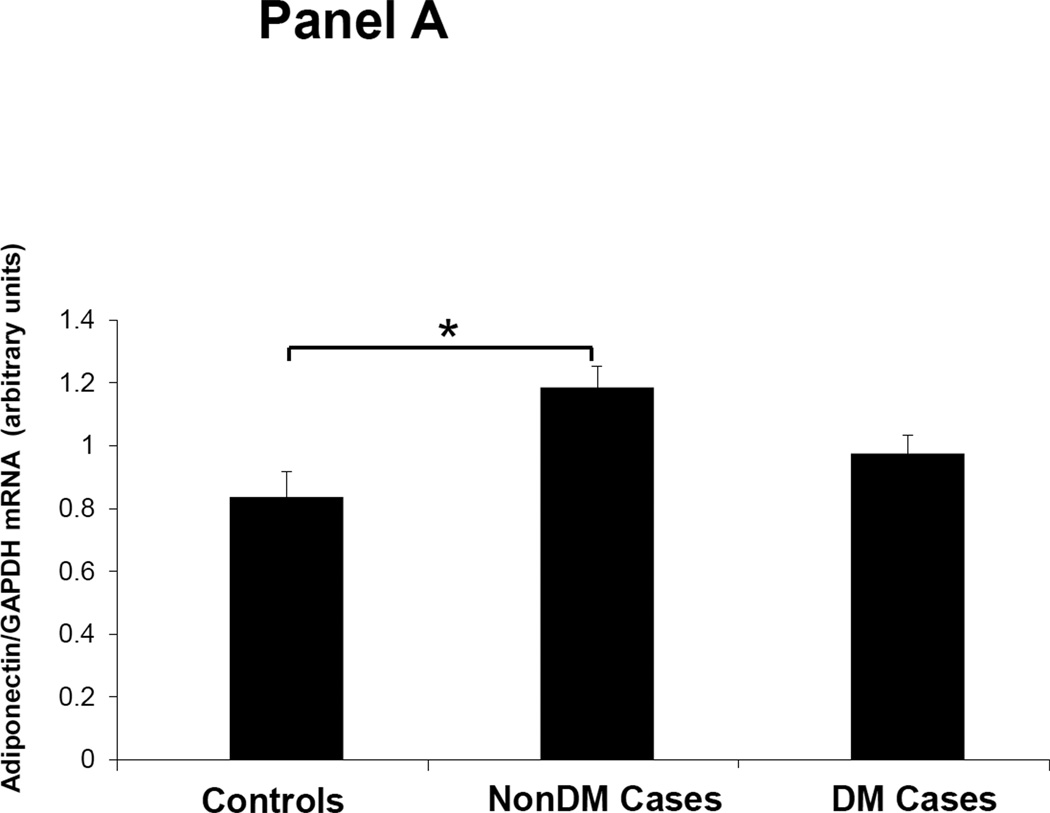
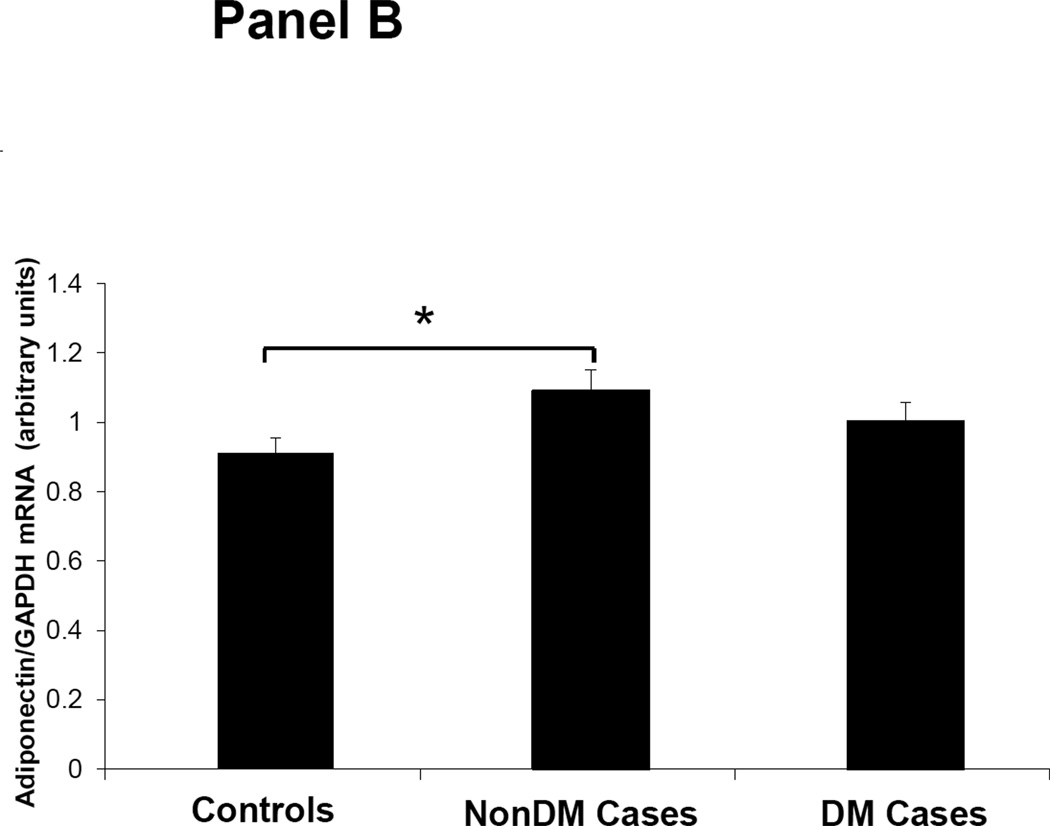
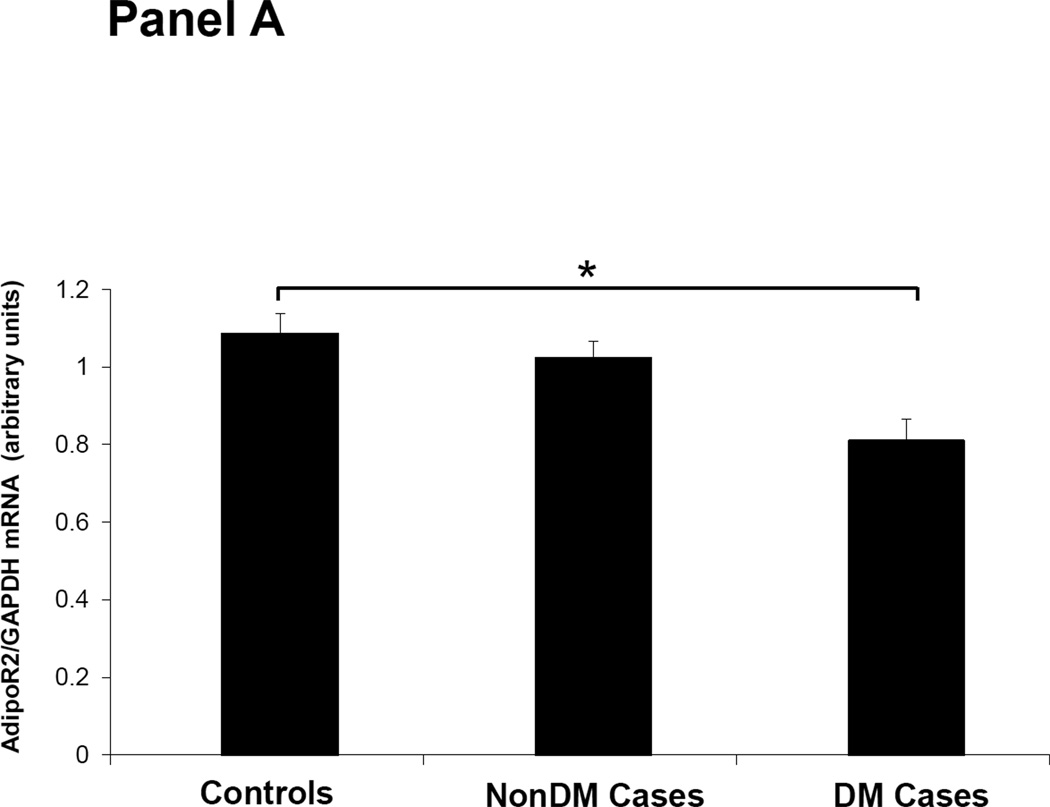
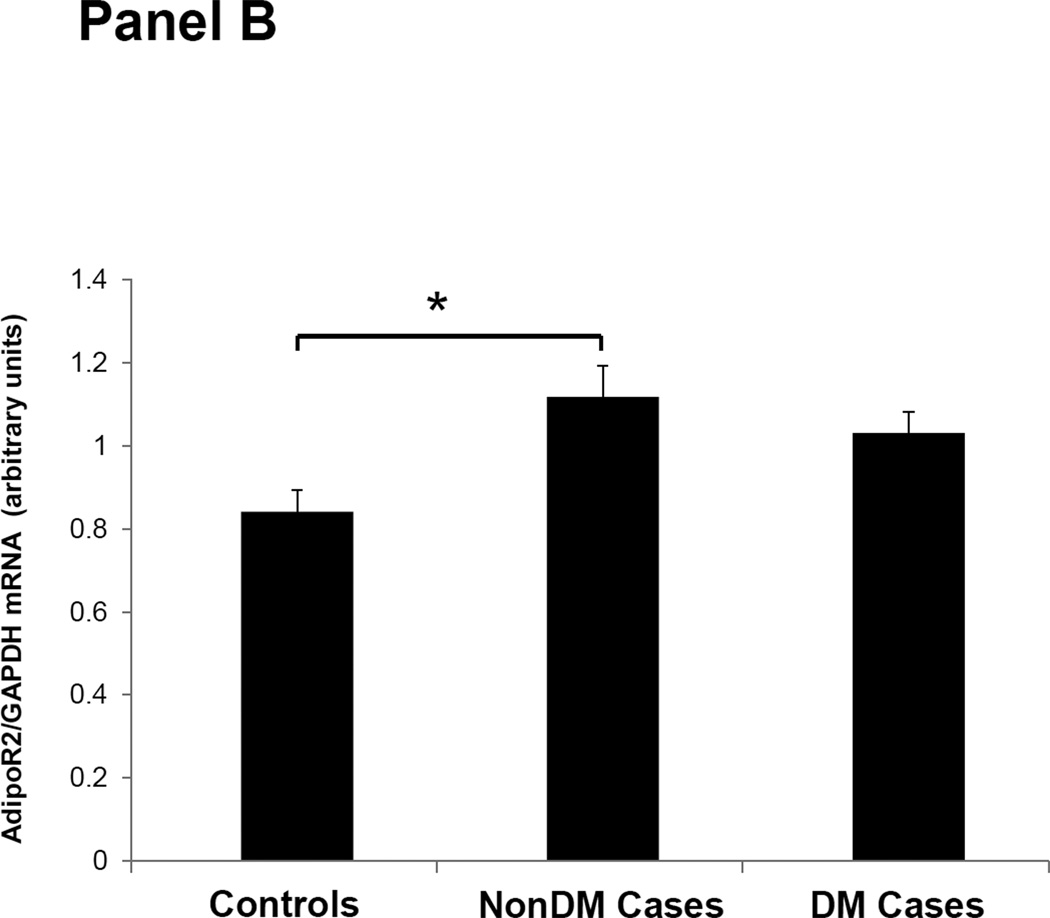
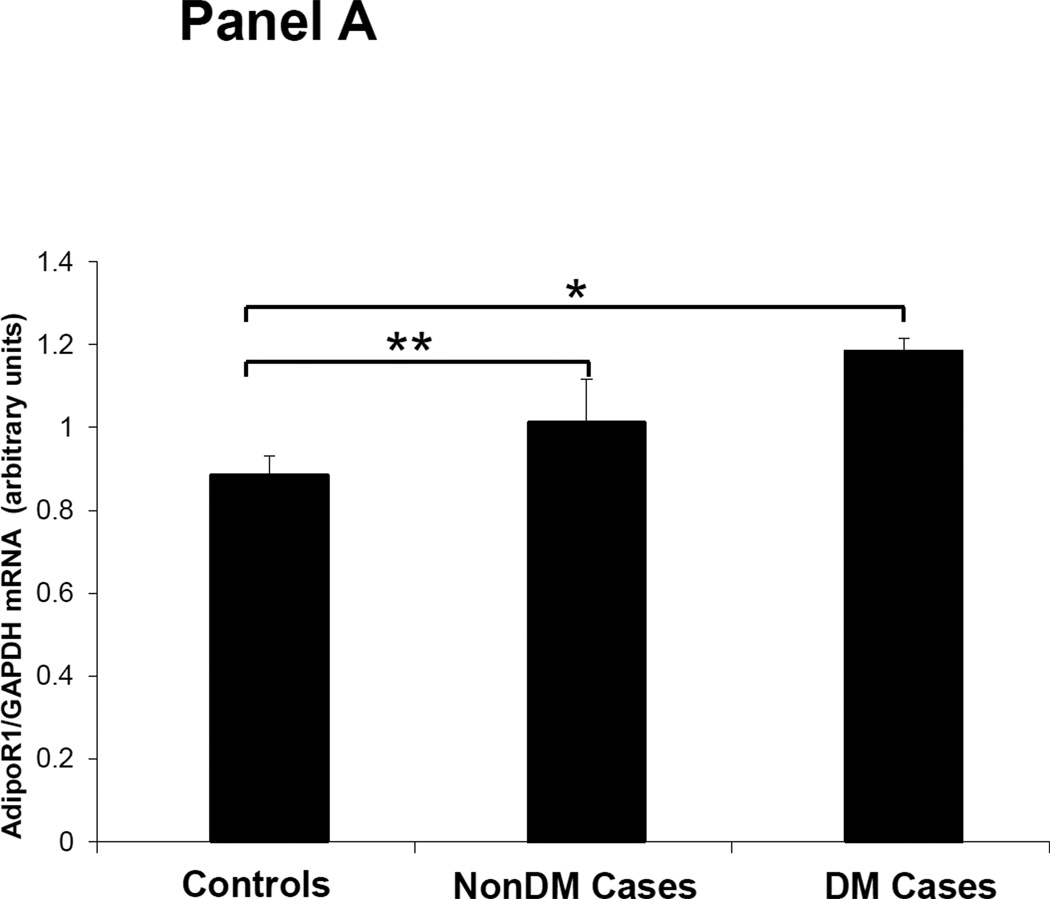
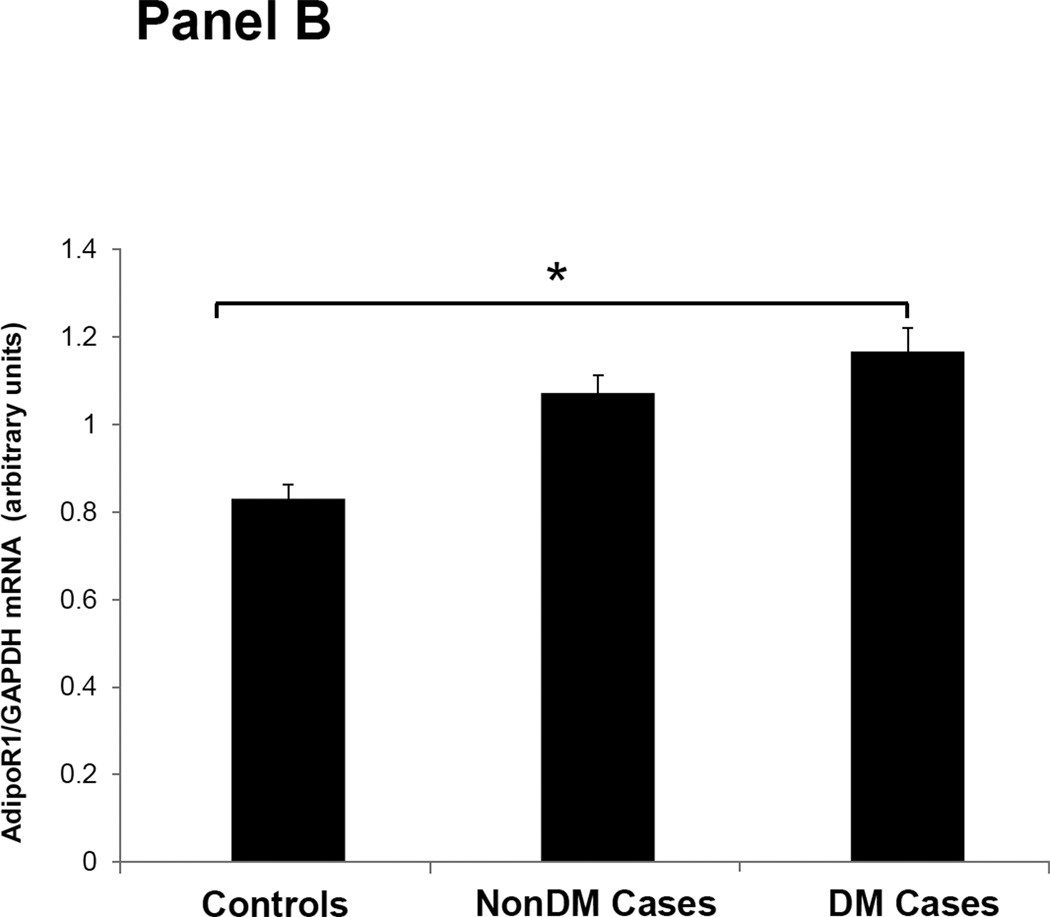
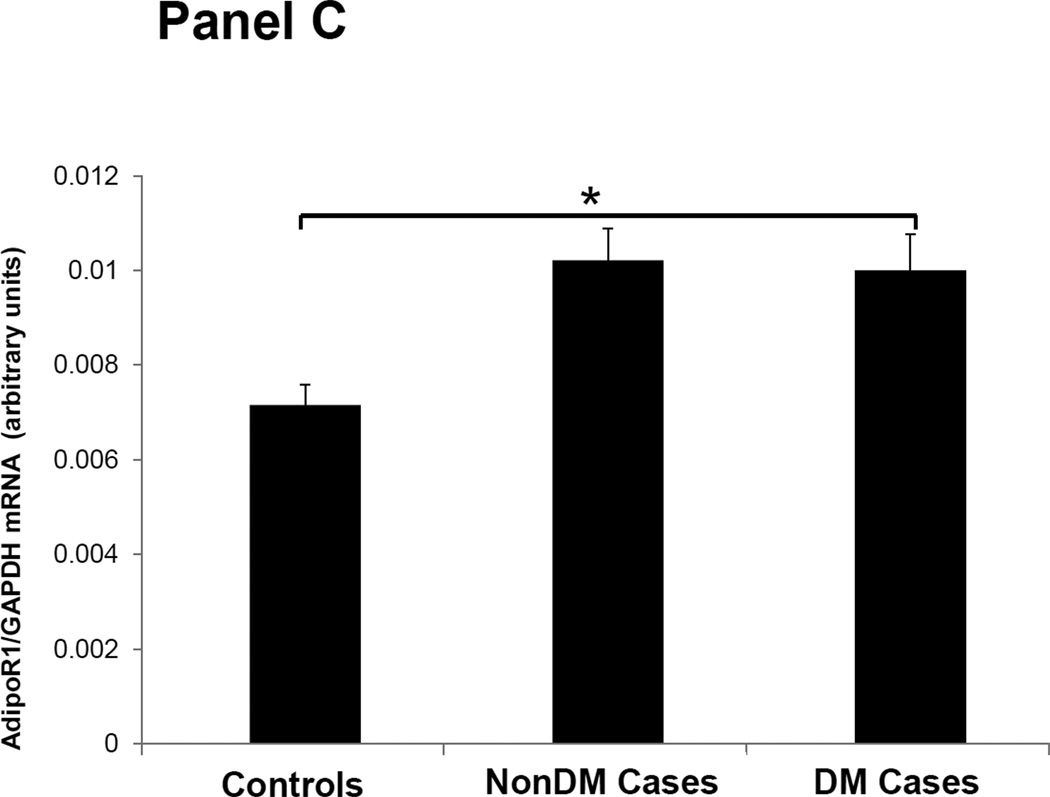
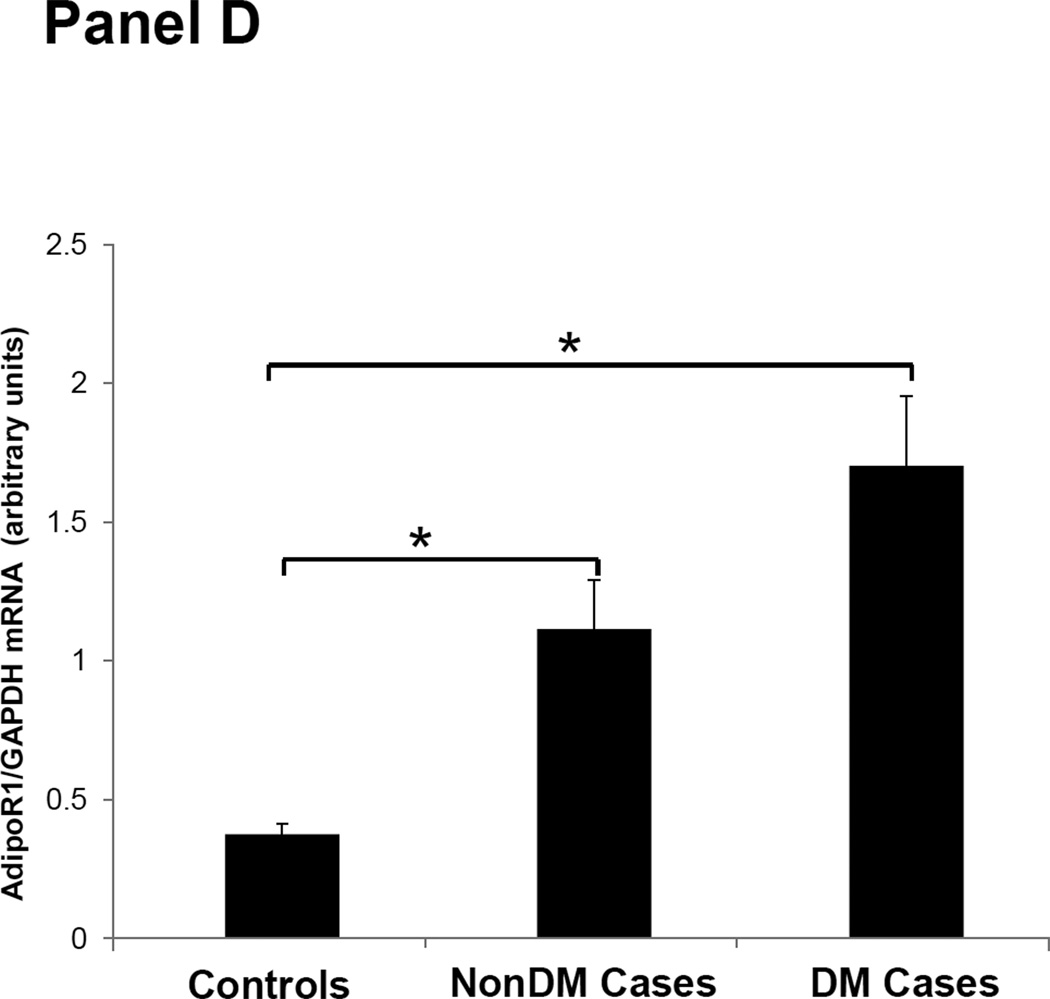
Figures 1–3 depicts the mRNA expression of adiponectin and the AdipoR1/2 in visceral fat, subcutaneous fat, muscle and peripheral blood mononuclear cells (PBMN) in ESRD cases and controls. In visceral fat, adiponectin mRNA expression was 40% higher in nonDM ESRD cases than in controls. AdipoR1 mRNA expression was 20% higher in nonDM ESRD cases and 30% higher in DM ESRD cases than controls. AdipoR2 was 30% lower in DM ESRD cases than controls. In subcutaneous fat, adiponectin mRNA expression was 20% higher in nonDM ESRD cases than controls; AdipoR1 was 20% higher in nonDM ESRD cases and 30% higher in DM ESRD cases than controls. Skeletal muscle of ESRD patients showed a 30% higher mRNA expression of AdipoR1 than controls. The largest differences in mRNA expression of adiponectin receptors were seen in peripheral blood where the expression of AdipoR1 in nonDM ESRD cases was 70% higher and the expression in DM ESRD cases was 140% higher than controls while AdipoR2 was 25% higher in nonDM ESRD cases than controls. There were no significant differences in the expression of AdipoR2 in subcutaneous fat or muscle in ESRD patients compared to controls (data not shown). Therefore, AdipoR1 mRNA expression was consistently higher in all tissues of ESRD patients compared to controls, whereas there was no consistent pattern detected for AdipoR2.
Figure 1. Adiponectin mRNA expression in adipose tissue.
Panel A. Visceral Fat. Panel B. Subcutaneous fat. Controls are compared with ESRD on RRT or CKD5 pre-RRT (cases). Cases are stratified by diabetes status in non-diabetics (NonDM) or diabetics (DM).* p<0.005, Student’s t test.
Figure 3. Adiponectin receptor 2 (AdipoR2) mRNA expression in tissue and blood.
Panel A; Visceral adipose tissue, Panel B; Peripheral blood mononuclear cells. Controls are compared with ESRD cases. Cases are stratified by diabetes status in non-diabetics (NonDM) or diabetics (DM).* p value <0.01, Student’s t test.
Overall, adiponectin and AdipoR1 mRNA expression in visceral and subcutaneous fat were significantly greater in ESRD cases compared to controls, independent of their DM status (p<0.005 for all). There was also a significant increase in the expression of the AdipoR1 in muscle of ESRD cases compared to controls (p<0.001). Both AdipoR1 and AdipoR2 mRNA expression were significantly higher in PBMN of ESRD cases compared with controls but the difference was greatest in ESRD DM cases (p<0.001).
Adiponectin Protein Expression in Adipose Tissue
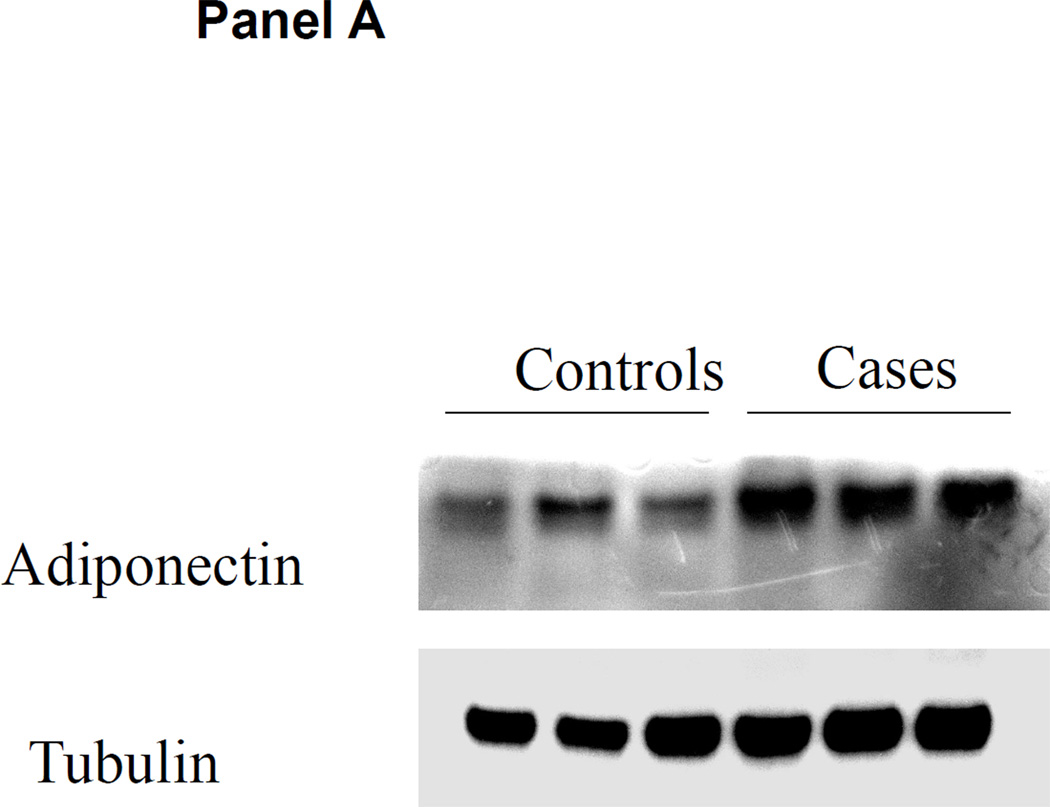
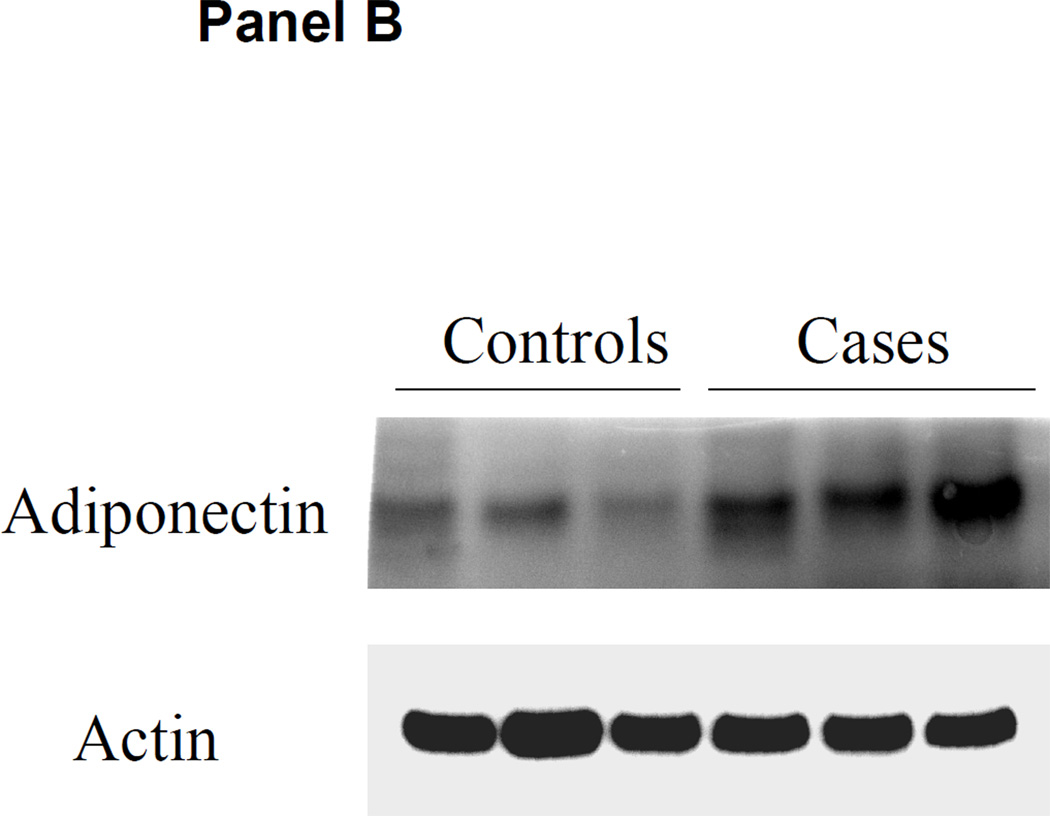
Adipose tissue adiponectin protein content by western blot is shown in Figure 4. Both visceral fat and subcutaneous fat adiponectin protein expression were higher in the ERSD cases than in controls with normal kidney function.
Figure 4. Adiponectin protein content in adipose tissue.
Visceral and subcutaneous adipose tissue was obtained at the time of kidney transplantation or kidney donation in ESRD cases and controls. Panel A: representative western blot of adiponectin content in subcutaneous fat compared with control tubulin in controls versus ESRD cases. Panel B: representative western blot of adiponectin content in visceral fat compared with control actin in controls versus ESRD cases.
Discussion
We show for the first time that increased plasma adiponectin levels observed in ESRD are accompanied by an increase in adiponectin protein and mRNA expression in human subcutaneous and visceral adipose tissue. Our data also demonstrate that mRNA expression of the adiponectin receptor is increased in the target tissues, fat and muscle, in ESRD patients compared to controls with normal kidney function. Our data also detected a difference in plasma adiponectin levels between ESRD patients with and without DM.
Increased adiponectin mRNA expression and protein content in adipose tissue suggests that decreased renal clearance of adiponectin may not be the only factor contributing to elevated circulating levels in subjects with chronic kidney disease. Under normal conditions (non-obese, non-diabetic and normal kidney function), chronic expression of adiponectin in adipose tissue results in down-regulation of adiponectin mRNA expression in adipose tissue and lowered plasma levels (23). These findings indicate that adiponectin follows the common hormone-receptor interaction axis, where the increase in circulating hormone levels triggers down-regulation of hormone production in order to resume baseline circulating protein levels. If decreased clearance were the main cause of elevated adiponectin circulating levels, we should see a decrease in hormone production by the adipose tissue. Reports that describe a correlation between adiponectin levels and estimated glomerular filtration rate (eGFR) (14) or a decrease in adiponectin levels after kidney transplantation (24, 25) have not demonstrated a direct effect of renal clearance on adiponectin levels. On the other hand, studies that include direct measurement of adiponectin in plasma from the aorta and renal veins of patients with renal artery stenosis demonstrate that the fractional extraction of adiponectin is low, around 3 to 5%, with similar findings when adiponectin extraction rates are compared in a kidney with renal artery stenosis to the contralateral non-diseased kidney (26). Previous reports also show that adiponectin is rapidly cleared from plasma with a short half-life (75min) and that the liver seems to be the primary clearance site as the kidney excretes only terminal degradation products (27). Data from our study support the hypothesis that increased production of adiponectin contributes to increased adiponectin plasma levels. Therefore it is unlikely that decreased renal clearance is the only cause of elevated plasma adiponectin levels in patients with ESRD.
Our data demonstrate higher levels of both anti-inflammatory and inflammatory adipokines in ESRD patients compared to controls. These findings may reflect the adiponectin response to the inflammatory environment that characterizes uremia. Pro-inflammatory cytokines such as TNFα, IL-6, and interleukin 8 (IL-8) have been shown to down-regulate adiponectin expression (28) but high levels of adiponectin have been described in other chronic inflammatory states such as systemic lupus erythematosus, rheumatoid arthritis, inflammatory bowel disease, type I diabetes and chronic systolic heart failure (29). Therefore, it remains unclear whether an inflammatory condition directly up-regulates or down-regulates adiponectin production or if there are other mediators associated with chronic inflammation that regulate adiponectin production.
There are functional differences between AdipoR1 and R2 receptors. In liver tissue, AdipoR1 down regulates genes associated with hepatic gluconeogenesis while AdipoR2 up regulates genes involved in glucose uptake and reduces reactive oxygen species and inflammation (30). Insulin resistance in uremia is mainly characterized by peripheral tissue insensitivity to insulin with normal hepatic gluconeogenesis and normal uptake of glucose by the liver (16). In the current study, we find increased tissue AdipoR1 expression. If the increased AdipoR1 inhibits liver gluconeogenesis this could partially explain why patients with renal disease have increased insulin resistance but gluconeogenesis in the liver is not increased. AdipoR2 expression levels in ESRD are similar to that of controls. Subjects with ESRD have chronic inflammation with increased oxidative stress and the fact that AdipoR2 is not increased suggests a lack of a compensatory increase in AdipoR2 expression in face of high oxidative stress. Increased oxidative stress has also been associated with insulin resistance (31, 32). Thus adiponectin resistance with high levels of adiponectin but relatively low AdipoR2 may contribute to the inflammatory state and insulin resistance seen in ESRD patients.
Our data on tissue gene expression are not entirely consistent with a previous report by Marchlewska et al. (33). These investigators studied adiponectin mRNA expression in adipose tissue of 18 ESRD patients including 9 with atherosclerotic vascular disease and a small sample of controls. Therefore there was an overrepresentation of ESRD patients with cardiovascular disease. They reported a decrease in adiponectin gene expression in subcutaneous fat tissue of patients with ESRD. Because low adiponectin levels are associated with worse cardiovascular outcomes (34), it is possible that their study selected ESRD participants with a CVD phenotype that is associated with lower adiponectin. Our study population differs significantly from their study participants. We enrolled patients with stage 5 chronic kidney disease, including dialysis patients of different vintage, without specific risk stratification for CVD. Our participants underwent kidney transplantation and were considered intermediate risk for CV events in the immediate post-transplant period per AHA criteria (35). Our results are more consistent with the data by Roubicek et al. (22) that showed an increase in AdipoR1 in visceral fat. In addition, the number of ESRD patients in our study is significantly larger. This enabled us to detect differences in adiponectin expression between visceral and subcutaneous adipose tissue of cases and controls.
Our data demonstrates an increase in adiponectin mRNA and protein production by adipose tissue despite elevated circulating adiponectin levels in subjects with ESRD compared to controls. These results suggest that there is a stimulus to produce more adiponectin protein despite elevated plasma levels. The mechanism for increased adiponectin production in ESRD is currently unclear. However, our data are consistent with the theory that there is tissue resistance to adiponectin at the level of the hormone-receptor interaction or in the downstream effectors. Adiponectin resistance has been suggested in obesity related insulin resistance and also in chronic heart failure (12, 36). However, unlike ESRD, in obesity related insulin resistance there is a decrease in the levels of circulating adiponectin as well as a reduction in adiponectin receptors in adipose and muscle tissues with decreased downstream adiponectin effectors in muscle (12). In chronic heart failure, the elevated adiponectin circulating levels are accompanied by decreased expression of adiponectin receptors and downstream adiponectin effectors in skeletal muscle (36). Another possible explanation for the increase in adiponectin production could be up-regulation of adiponectin expression in response to non-adipose tissue derived inflammation or in response to a uremia mediated metabolic toxin independent of inflammation.
Our data also describe an increase in adiponectin receptor-1 expression in visceral fat and muscle of ESRD patients. Consequently, adiponectin resistance could be either at the receptor-ligand interaction or in the downstream effectors of adiponectin signaling.
Our study has some limitations. Our data are derived from a cross-sectional study that examined adipokine levels and adipose tissue adiponectin expression at one time point in a chronic disease state. This limits our data to associations. We did not adjust p-values for the possible inflation of false-positive error rates that could result from conducting multiple tests. However, a Bonferroni correction to the significance level (p< 0.01) for the five inflammatory adipokines tested (Table 2) will not change our conclusions, except that IL-6 falls to the borderline of the rejection region for the comparison of controls to all cases. Our study groups were not perfectly balanced. More controls were females with lower BMI and our cases were more frequently men with higher BMI. The distributions of our ESRD and control samples resemble the ESRD population and the kidney donor population in the U.S. (17, 32). Since females and leaner individuals will have higher adiponectin levels, imbalance in the groups has likely shifted our results towards the null hypothesis compared to a study where cases and controls were matched. Despite that, we were able to find statistically significant differences in the plasma adiponectin values. More balanced groups may show bigger differences in plasma and tissue adipokine levels between the groups, but the conclusion of the study would likely be similar. We did not study adiponectin isoforms to determine whether elevated circulating adiponectin or tissue production is limited to a particular fraction such as the high molecular weight isoform. Due to the limited number of participants, we were unable to stratify the sample for cardiovascular risk or glucose tolerance. On the other hand our data represents the largest case control study to investigate visceral fat, subcutaneous fat, and muscle tissue expression of adiponectin and adiponectin receptors in ESRD patients and healthy controls. Our data should be considered as groundwork in the study of adiponectin metabolism in kidney disease as the mRNA expression analysis and tissue protein level analysis will need to be validated in larger study samples from similar populations and also in participants with different stages of chronic kidney disease.
In summary, patients with ESRD have elevated circulating levels of both inflammatory adipokines and the anti-inflammatory cytokine adiponectin. Concurrently, ESRD patients express increased adiponectin mRNA and protein expression in visceral and subcutaneous fat than control subjects with normal kidney function. Adiponectin receptor 1 mRNA expression in target tissues is also increased in ESRD, whereas expression of adiponectin receptor 2 does not appear to be modified by uremia. It remains unclear if adiponectin is functionally active in ESRD and if the elevated levels of adiponectin are a compensatory mechanism for adiponectin resistance or a response to chronic inflammation. Further studies to unravel regulation and function of adiponectin in renal disease will be needed to assess this adipokine’s role in cardiovascular disease and glucose abnormalities in patients with kidney disease.
Methods
Design and Subjects
We designed a case control study to compare adipokine plasma levels and adiponectin and adiponectin receptor mRNA and protein expression in adipose tissue of ESRD patients compared to healthy controls. Participants were recruited from the Thomas Jefferson University Hospital (TJUH) transplant program from August 2010 until August 2011. Criteria for inclusion in the study included undergoing kidney transplantation or kidney donation at TJUH. ESRD subjects on renal replacement therapy or CKD stage 5 pre-renal replacement therapy were included as cases. The control group consisted of normal renal function kidney donors. Multi-organ transplants and subjects with a functional pancreas transplant were excluded. Cases were further stratified into 2 groups: subjects without diabetes (DM) prior to transplantation were designated NonDM ESRD cases and subjects with diabetes before transplant were designated DM ESRD cases. Subjects were classified as diabetics prior to transplantation if diabetes was the cause of kidney disease or a co-morbidity at the time of transplant, if the patient was receiving treatment for diabetes pre-transplant, and if laboratory values were diagnostic of DM as per ADA criteria (37). The study protocol was approved by the Institutional Review Board at TJU and written informed consent was obtained from every subject.
Demographic data and baseline characteristics were obtained from the medical records at the time of admission for surgery. Plasma was obtained fasting the morning of transplantation or donation.
Procedures
Total plasma adiponectin, IL-6, high sensitivity C-reactive protein (hsCRP), TNFα, and PAI-1 assays were carried out by ELISA, utilizing a commercial kit from R&D Systems (Minneapolis MN) and Hyphen Biomed (Elitest PAI-1, Mason, OH). The intra-assay coefficient of variation (c.v.) was < 10% and inter-assay c.v. was also < 10% for each of the cytokines. While participants were under general anesthesia, approximately 250 mg of omental visceral fat and subcutaneous fat from just below the abdominal skin and 100 mg of skeletal muscle from the rectus abdominis were obtained. Around 100 mg of adipose tissue and 50 mg of muscle were submerged in RNAlater (Ambion, Carlsbad, CA) and blood was stored in Paxgene blood RNA tubes (Preanalytix, Hombrechtikon, Switzerland). RNA extraction from blood was performed with Paxgene blood RNA kit (Preanalytix, Hombrechtikon, Switzerland) and RNA extraction from tissue was performed with RNeasy Lipid Tissue Mini Kit (Qiagen, Valencia, CA). Adiponectin, AdipoR1 and AdipoR2 mRNA differential expression was performed by TaqMan Assays-on-Demand (Applied Biosystems, Foster City, CA, USA). Reverse transcription was performed in a thermal cycler under universal conditions. For the real time reaction, template cDNA was mixed with TaqMan Gene Expression Assays for Adiponectin, AdipoR1, AdipoR2 and GAPDH as control gene and TaqMan Gene Expression Master Mix containing AmpliTaq Gold enzyme (Applied Biosystems, Foster City, CA). The reactions were run on the Applied Biosystems 7500 Sequence Detection System under universal cycling conditions. cDNA from one of the controls was serially diluted to generate a standard curve for each set of gene primers and tissue. Standard curve and samples were run in triplicate. The relative values for the samples were determined by plotting the sample log cDNA dilution versus the Ct value on the standard curve. The final expression value was normalized to GAPDH. Data are presented as the average ratios of target mRNA to a reference gene in tissue in arbitrary units. 150 mg of subcutaneous and visceral fat tissue form ESRD cases and controls were homogenized in 400 ul of cold lysis buffer containing 1M Tris, 250 mM DTT, 250mM PMSF, 250mM EDTA and 250mM EGTA. The homogenate was spun at 3000 rpm for 10 minutes at 4C and the middle layer was retrieved for protein quantification using the Bradford method (BioRad laboratories, Hercules, CA). 20 ug of sample was mixed with 4X NuPAGE LDS sample buffer (Life Technologies, Grand Island, NY) and mercaptoethanol and loaded in a polyacrylamide gel (NuPAGE Novex 4–12% Bis Tris gels, Life Technologies, Grand Island, NY) under reducing and heated conditions. Proteins were then transferred to a polyvinylidene fluoride membrane (Life Technologies, Grand Island, NY) and, after transfer, membranes were blocked with 5% bovine serum albumin. Membranes were incubated with the primary antibody (Adiponectin 1:200 and actin 1: 500 both from Santa Cruz Biotechnology, Santa Cruz, CA) overnight at 4° C. Horseradish peroxidase conjugate secondary antibodies were incubated for 1 hour and immunoreactivity for adiponectin and controls was detected by an enhanced chemiluminescence system (SuperSignal West Dura Chemiluminescent Substrate, Thermo Scientific, Rockford, IL).
Data Analysis
Continuous and categorical data were analyzed. The variables were generally summarized in terms of arithmetic means and standard deviations or counts and percentages. Most of the continuous data variables were approximately normally distributed. IL-6 was substantially skewed, but was approximately normally distributed after log transformation prior to statistical testing. IL-6 data was summarized by geometric mean (GM) with first and third quartiles of the untransformed data. To test for differences in means across the cases and control groups, unadjusted analysis of variance (ANOVA) F-tests and t-tests were conducted on continuous variables. Fisher’s exact test was used to detect dependencies between categorical variables. Student t-test was used to compare differences in mRNA expression between cases and controls. Linear regression models were fitted in order to investigate how cytokines relate to obesity and renal status. All statistical analyses were conducted using SAS version 9.2 (SAS Institute, Cary, NC, USA).
Figure 2. Adiponectin receptor 1 (AdipoR1) mRNA expression in tissue and blood.
Panel A Visceral adipose tissue, Panel B Subcutaneous adipose tissue, Panel C Skeletal muscle, Panel D Peripheral blood mononuclear cells. Controls are compared with ESRD cases. Cases are stratified by diabetes status in non-diabetics (NonDM) or diabetics (DM). *p<0.001, **p<0.05, Student’s t test.
Acknowledges
The authors would like to acknowledge the help of the transplant coordinators Karen O’Neill, Linda Wright, Bethany Hosier, Jean Berte, Vanessa Vuong, Christina Petyo and Kim Phillips for their help in the recruitment of the participants.
Sources of Support
This work was supported in part by NIH grants (R01-HL092030 for Dr. Bonita Falkner and T32GM008562 for Dr. Martinez), ADA grants (7-12-JF-41 for Dr. Martinez) and by a grant from the Pennsylvania Department of Health. The Department disclaims responsibility for any analysis, interpretations, or conclusions.
Footnotes
Disclosure Declaration
The authors report no conflicts of interest.
References
- 1.Scherer PE, Williams S, Fogliano M, et al. A novel serum protein similar to C1q, produced exclusively in adipocytes. J Biol Chem. 1995;270:26746–26749. doi: 10.1074/jbc.270.45.26746. [DOI] [PubMed] [Google Scholar]
- 2.Maeda K, Okubo K, Shimomura I, et al. cDNA cloning and expression of a novel adipose specific collagen-like factor, apM1 (AdiPose Most abundant Gene transcript 1) Biochem Biophys Res Commun. 1996;221:286–289. doi: 10.1006/bbrc.1996.0587. [DOI] [PubMed] [Google Scholar]
- 3.Ding G, Qin Q, He N, et al. Adiponectin and its receptors are expressed in adult ventricular cardiomyocytes and upregulated by activation of peroxisome proliferator-activated receptor gamma. J Mol Cell Cardiol. 2007;43:73–84. doi: 10.1016/j.yjmcc.2007.04.014. [DOI] [PMC free article] [PubMed] [Google Scholar]
- 4.Delaigle AM, Jonas JC, Bauche IB, et al. Induction of adiponectin in skeletal muscle by inflammatory cytokines: in vivo and in vitro studies. Endocrinology. 2004;145:5589–5597. doi: 10.1210/en.2004-0503. [DOI] [PubMed] [Google Scholar]
- 5.Yoda-Murakami M, Taniguchi M, Takahashi K, et al. Change in expression of GBP28/adiponectin in carbon tetrachloride-administrated mouse liver. Biochem Biophys Res Commun. 2001;285:372–377. doi: 10.1006/bbrc.2001.5134. [DOI] [PubMed] [Google Scholar]
- 6.Berner HS, Lyngstadaas SP, Spahr A, et al. Adiponectin and its receptors are expressed in bone-forming cells. Bone. 2004;35:842–849. doi: 10.1016/j.bone.2004.06.008. [DOI] [PubMed] [Google Scholar]
- 7.Katsiougiannis S, Kapsogeorgou EK, Manoussakis MN, Skopouli FN. Salivary gland epithelial cells: a new source of the immunoregulatory hormone adiponectin. Arthritis Rheum. 2006;54:2295–2299. doi: 10.1002/art.21944. [DOI] [PubMed] [Google Scholar]
- 8.Nakano Y, Tobe T, Choi-Miura NH, et al. Isolation and characterization of GBP28, a novel gelatin-binding protein purified from human plasma. J Biochem. 1996;120:803–812. doi: 10.1093/oxfordjournals.jbchem.a021483. [DOI] [PubMed] [Google Scholar]
- 9.Waki H, Yamauchi T, Kamon J, et al. Impaired multimerization of human adiponectin mutants associated with diabetes. Molecular structure and multimer formation of adiponectin. J Biol Chem. 2003;278:40352–40363. doi: 10.1074/jbc.M300365200. [DOI] [PubMed] [Google Scholar]
- 10.Hada Y, Yamauchi T, Waki H, et al. Selective purification and characterization of adiponectin multimer species from human plasma. Biochem Biophys Res Commun. 2007;356:487–493. doi: 10.1016/j.bbrc.2007.03.004. [DOI] [PubMed] [Google Scholar]
- 11.Yamauchi T, Kamon J, Ito Y, et al. Cloning of adiponectin receptors that mediate antidiabetic metabolic effects. Nature. 2003;423:762–769. doi: 10.1038/nature01705. [DOI] [PubMed] [Google Scholar]
- 12.Kadowaki T, Yamauchi T, Kubota N, et al. Adiponectin and adiponectin receptors in insulin resistance, diabetes, and the metabolic syndrome. J Clin Invest. 2006;116:1784–1792. doi: 10.1172/JCI29126. [DOI] [PMC free article] [PubMed] [Google Scholar]
- 13.Wang ZV, Scherer PE. Adiponectin, cardiovascular function, and hypertension. Hypertension. 2008;51:8–14. doi: 10.1161/HYPERTENSIONAHA.107.099424. [DOI] [PubMed] [Google Scholar]
- 14.Nanayakkara PW, Le Poole CY, Fouque D, et al. Plasma adiponectin concentration has an inverse and a non linear association with estimated glomerular filtration rate in patients with K/DOQI 3 - 5 chronic kidney disease. Clin Nephrol. 2009;72:21–30. doi: 10.5414/cnp72021. [DOI] [PubMed] [Google Scholar]
- 15.Zoccali C, Mallamaci F, Tripepi G, et al. Adiponectin, metabolic risk factors, and cardiovascular events among patients with end-stage renal disease. J Am Soc Nephrol. 2002;13:134–141. doi: 10.1681/ASN.V131134. [DOI] [PubMed] [Google Scholar]
- 16.DeFronzo RA, Alvestrand A, Smith D, et al. Insulin resistance in uremia. J Clin Invest. 1981;67:563–568. doi: 10.1172/JCI110067. [DOI] [PMC free article] [PubMed] [Google Scholar]
- 17.United States Renal Data System: USRDS 2011 Annual Data Report. Bethesda, MD: National Institutes of Health, NIDDK; 2011. [Google Scholar]
- 18.Shen YY, Charlesworth JA, Kelly JJ, et al. Up-regulation of adiponectin, its isoforms and receptors in end-stage kidney disease. Nephrol Dial Transplant. 2007;22:171–178. doi: 10.1093/ndt/gfl552. [DOI] [PubMed] [Google Scholar]
- 19.Adamczak M, Chudek J, Wiecek A. Adiponectin in patients with chronic kidney disease. Semin Dial. 2009;22:391–395. doi: 10.1111/j.1525-139X.2009.00587.x. [DOI] [PubMed] [Google Scholar]
- 20.Stenvinkel P, Carrero JJ, Axelsson J, et al. Emerging biomarkers for evaluating cardiovascular risk in the chronic kidney disease patient: how do new pieces fit into the uremic puzzle? Clin J Am Soc Nephrol. 2008;3:505–521. doi: 10.2215/CJN.03670807. [DOI] [PMC free article] [PubMed] [Google Scholar]
- 21.Becker B, Kronenberg F, Kielstein JT, et al. Renal insulin resistance syndrome, adiponectin and cardiovascular events in patients with kidney disease: the mild and moderate kidney disease study. J Am Soc Nephrol. 2005;16:1091–1098. doi: 10.1681/ASN.2004090742. [DOI] [PubMed] [Google Scholar]
- 22.Roubicek T, Bartlova M, Krajickova J, et al. Increased production of proinflammatory cytokines in adipose tissue of patients with end-stage renal disease. Nutrition. 2009;25:762–768. doi: 10.1016/j.nut.2008.12.012. [DOI] [PubMed] [Google Scholar]
- 23.Bauche IB, Ait El Mkadem S, Rezsohazy R, et al. Adiponectin downregulates its own production and the expression of its AdipoR2 receptor in transgenic mice. Biochem Biophys Res Commun. 2006;345:1414–1424. doi: 10.1016/j.bbrc.2006.05.033. [DOI] [PubMed] [Google Scholar]
- 24.Shen YY, Charlesworth JA, Kelly JJ, Peake PW. The effect of renal transplantation on adiponectin and its isoforms and receptors. Metabolism. 2007;56:1201–1208. doi: 10.1016/j.metabol.2007.04.016. [DOI] [PubMed] [Google Scholar]
- 25.Adamczak M, Szotowska M, Chudek J, et al. Plasma adiponectin concentration in patients after successful kidney transplantation--a single-center, observational study. Clin Nephrol. 2007;67:381–390. doi: 10.5414/cnp67381. [DOI] [PubMed] [Google Scholar]
- 26.Adamczak M, Czerwienska B, Chudek J, Wiecek A. Renal extraction of circulating adiponectin in patients with renovascular hypertension. Acta Physiol Hung. 2007;94:143–148. doi: 10.1556/APhysiol.94.2007.1-2.13. [DOI] [PubMed] [Google Scholar]
- 27.Halberg N, Schraw TD, Wang ZV, et al. Systemic fate of the adipocyte-derived factor adiponectin. Diabetes. 2009;58:1961–1970. doi: 10.2337/db08-1750. [DOI] [PMC free article] [PubMed] [Google Scholar]
- 28.Bruun JM, Lihn AS, Verdich C, et al. Regulation of adiponectin by adipose tissue-derived cytokines: in vivo and in vitro investigations in humans. Am J Physiol Endocrinol Metab. 2003;285:E527–E533. doi: 10.1152/ajpendo.00110.2003. [DOI] [PubMed] [Google Scholar]
- 29.Fantuzzi G. Adiponectin and inflammation: consensus and controversy. J Allergy Clin Immunol. 2008;121:326–330. doi: 10.1016/j.jaci.2007.10.018. [DOI] [PubMed] [Google Scholar]
- 30.Yamauchi T, Nio Y, Maki T, et al. Targeted disruption of AdipoR1 and AdipoR2 causes abrogation of adiponectin binding and metabolic actions. Nat Med. 2007;13:332–339. doi: 10.1038/nm1557. [DOI] [PubMed] [Google Scholar]
- 31.Houstis N, Rosen ED, Lander ES. Reactive oxygen species have a causal role in multiple forms of insulin resistance. Nature. 2006;440:944–948. doi: 10.1038/nature04634. [DOI] [PubMed] [Google Scholar]
- 32.2011 Annual Report of the U.S. Organ Procurement and Tranplantation Network and the Scientific Registry of Transplant Recipients: Transplant Data 2011. Rockville, MD: Department of Health and Human Services, Health Resources and Service Administration, Healthcare Systems Bureau, Division of Transplantation; Richmond, VA: United Network for Organ Sharing; Ann Arbor, MI: University Renal Reseach and Education Association; [Google Scholar]
- 33.Marchlewska A, Stenvinkel P, Lindholm B, et al. Reduced gene expression of adiponectin in fat tissue from patients with end-stage renal disease. Kidney Int. 2004;66:46–50. doi: 10.1111/j.1523-1755.2004.00705.x. [DOI] [PubMed] [Google Scholar]
- 34.Menon V, Li L, Wang X, et al. Adiponectin and mortality in patients with chronic kidney disease. J Am Soc Nephrol. 2006;17:2599–2606. doi: 10.1681/ASN.2006040331. [DOI] [PubMed] [Google Scholar]
- 35.Fleisher LA, Beckman JA, Brown KA, et al. ACC/AHA 2007 guidelines on perioperative cardiovascular evaluation and care for noncardiac surgery: a report of the American College of Cardiology/American Heart Association Task Force on Practice Guidelines (Writing Committee to Revise the 2002 Guidelines on Perioperative Cardiovascular Evaluation for Noncardiac Surgery): developed in collaboration with the American Society of Echocardiography, American Society of Nuclear Cardiology, Heart Rhythm Society, Society of Cardiovascular Anesthesiologists, Society for Cardiovascular Angiography and Interventions, Society for Vascular Medicine and Biology, and Society for Vascular Surgery. Circulation. 2007;116:e418–e499. doi: 10.1161/CIRCULATIONAHA.107.185699. [DOI] [PubMed] [Google Scholar]
- 36.Van Berendoncks AM, Garnier A, Beckers P, et al. Functional adiponectin resistance at the level of the skeletal muscle in mild to moderate chronic heart failure. Circ Heart Fail. 2010;3:185–194. doi: 10.1161/CIRCHEARTFAILURE.109.885525. [DOI] [PubMed] [Google Scholar]
- 37.Standards of medical care in diabetes--2011. Diabetes Care. 34(Suppl 1):S11–S61. doi: 10.2337/dc11-S011. [DOI] [PMC free article] [PubMed] [Google Scholar]


