

Abstract
The renal distal tubule Na-Cl cotransporter (NCC) reabsorbs <10% of the filtered Na+ but is a key control point for blood pressure regulation by angiotensin II (ANG II), angiotensin-converting enzyme inhibitors (ACEI), and thiazide diuretics. This study aimed to determine whether NCC phosphorylation (NCCp) was regulated by acute (20–30 min) treatment with the ACEI captopril (12 μg/min × 20 min) or by a sub-pressor dose of ANG II (20 ng·kg−1·min−1) in Inactin-anesthetized rats. By immuno-EM, NCCp was detected exclusively in or adjacent to apical plama membranes (APM) in controls and after ACEI or ANG II treatment, while NCC total was detected in both APM and subapical cytoplasmic vesicles (SCV) in all conditions. In renal homogenates, neither ACEI nor ANG II treatment altered NCCp abundance, assayed by immunoblot. However, by density gradient fractionation we identified a pool of low-density APM in which NCCp decreased 50% in response to captopril and was restored during ANG II infusion, and another pool of higher-density APM that responded reciprocally, indicative of regulated redistribution between two APM pools. In both pools, NCCp was preferentially localized to Triton-soluble membranes. Blue Native gel electrophoresis established that APM NCCp localized to ∼700 kDa complexes (containing γ-adducin) while unphosphorylated NCC in intracellular membranes primarily localized to ∼400 kDa complexes: there was no evidence for native monomeric or dimeric NCC or NCCp. In summary, this study demonstrates that phosphorylated NCC, localized to multimeric complexes in the APM, redistributes in a regulated manner within the APM in response to ACEI and ANG II.
Keywords: blood pressure, trafficking, captopril, γ-adducin, subcellular fractionation, immuno-EM
the renal distal convoluted tubule (DCT) is a key control point for extracellular volume and blood pressure regulation. The Na-Cl cotransporter (NCC), expressed in the apical membrane of the DCT, is the target of thiazide diuretics prescribed widely to reduce extracellular fluid volume in edema and to lower blood pressure (1, 20, 32, 38). In addition, inactivating mutations of either NCC or the NCC regulator SPAK (STE20/SPS1-related proline/alanine-rich kinase) provoke salt wasting and lower blood pressure (37, 46, 60). In contrast, mutations in WNK (“with no lysine”) kinases, which directly or indirectly activate NCC, provoke familial hyperkalemic hypertension (12, 14, 58). Taken together, these findings suggest that conditions that increase NCC activity elevate blood pressure (which drives pressure natriuresis to match salt output to input) while conditions that decrease NCC activity lower blood pressure (by increasing salt excretion). However, transgenic overexpression of NCC does not itself cause familial hyperkalemic hypertension, indicating the importance of NCC activation by phosphorylation and/or trafficking to the plasma membrane (27). Thus, understanding the cellular mechanisms that regulate NCC activation are central to understanding and treating hypertension and disorders of extracellular fluid volume.
Theoretically, NCC activity in the DCT apical plasma membrane (APM) can be altered by changing any one of the following: NCC synthesis or degradation rates, NCC redistribution between APM and subapical cytoplasmic vesicles (SCV), or by covalent or allosteric modification of NCC. All of these mechanisms appear to operate in the DCT, as summarized below.
Total NCC abundance is decreased by high-salt diet, mineralocorticoid blockade and during aldosterone escape (34, 44, 48, 55), and increased by low-salt diet or chronic ANG II treatment (4, 23, 52). These studies have examined NCC abundance after hours or days.
Our in vivo studies (by both immuno-EM and density gradient membrane fractionation) demonstrated trafficking of NCC between APM and SCV during high-salt diet in response to ACE inhibitor treatment (to block ANG II production) or acute hypertension (17, 44, 45, 59), and net redistribution from SCV into APM in response to acute non-pressor ANG II infusion (45), indicating that these responses can occur rapidly. Acute stimulation with vasopressin has been reported to have no effect on distribution of NCC (36) and also reported to increase NCC traffic to the APM (31).
Regarding covalent or allosteric regulation, NCC can be phosphorylated at a number of sites by the WNK-SPAK cascade (39). In vivo, NCC is phosphorylated (8), likely mediated by the WNK-SPAK cascade, in response to low-salt diet (5, 51), chronic ANG II or aldosterone infusion (4, 52, 53), acute vasopressin (31, 36), insulin treatment (47), and treatment with the calcineurin inhibitor tacrolimus (13). That NCC phosphorylation increases NCC activity in the plasma membrane was first established in Xenopus oocytes (35) and subsequently in HEK293 cells (39). In both expression systems, replacing threonine 58 (Thr60 in human) with alanine eliminated thiazide-sensitive 22Na uptake while replacing Thr53 or Ser71 with alanine did not eliminate activity. These findings suggest that phosphorylation of NCC at T58 is a primary determinant of NCC activity.
We aimed to investigate the acute regulation of NCC distribution by ACE inhibition and ANG II in vivo with a focus on the role of NCC phosphorylation (NCCp). Specifically, we asked whether acute infusion of the ACE inhibitor captopril decreased NCCp in the APM, whether subsequently adding ANG II to the captopril infusion increased NCCp in the APM, and whether either treatment redistributed NCCp between APM and SCV. In addition, we investigated the membrane domain properties and mobilities in native gels of NCC total versus NCCp. The results provide evidence that, in vivo, NCC phosphorylation is not increased by acute non-pressor ANG II treatment, that NCCp is restricted to the APM yet redistributes within the APM in response to captopril or ANG II treatment, and that NCC and NCCp exist in multimeric complexes in distinct membrane domains.
Glossary
- ACEI
angiotensin-converting enzyme inhibitor
- ANG II
angiotensin II
- AP2
clathrin adapter protein 2
- APM
apical plasma membrane
- BN-PAGE
Blue Native polyacrylamide gel electrophoresis
- DCT
distal convoluted tubule
- DDM
n-dodecyl-β-d-maltoside
- IB
immunoblot
- ICM
intracellular membrane
- IP
immunoprecipitation
- MAP
mean arterial pressure
- NCC
renal distal tubule Na-Cl cotransporter
- NCCp
phosphorylated NCC
- NCCpS71
NCC phosphorylated at serine 71
- NCCpT53
NCC phosphorylated at threonine 53
- NCCpT58
NCC phosphorylated at threonine 58
- NKCC
thick ascending limb Na-K-2Cl cotransporter
- NKCCpT96pT101
NKCC phosphorylated at threonines 96 and 101
- PBS
phosphate-buffered saline
- PM
plasma membrane
- PV
parvalbumin
- SCV
subapical cytoplasmic vesicle
- SPAK
STE20/SPS1-related proline/alanine-rich kinase
- SPAKpS373
SPAK phosphorylated at serine 373
- TAL
thick ascending limb
- WNK
with no lysine kinases
METHODS
Animal Protocols
All animal experiments were approved by the University of Southern California Keck School of Medicine Institutional Animal Care and Use Committee and were conducted in accord with the National Institutes of Health Guide for the Care and Use of Laboratory Animals. All experiments were performed on male Sprague-Dawley rats (300–350 g body wt) that were kept under diurnal light conditions and had free access to food and water. Rats were anesthetized intraperitoneally with Inactin (Sigma; 100 mg/kg). During surgery, body temperature was maintained thermostatically at 37°C. Euvolemia was maintained by infusion of 4% BSA in 0.9% saline into the jugular vein at 20–50 μl/min. Blood pressure was measured via a polyethylene catheter (PE-50) placed in the carotid artery. The left ureter was cannulated with a Surflo IV catheter (Terumo) for measurement of urine output. At the completion of surgery, there was a 30- to 60-min period to establish baseline before infusion of drugs and collection of in vivo data. During protocols, urine output rate was determined gravimetrically and mean arterial pressure (MAP) was continuously recorded {MAP = [(2 × diastolic) + systolic]/3}. At the end of each protocol, organs were removed while animals remained under deep Inactin anesthesia. Animals were euthanized by pneumothorax.
Protocol 1.
Protocol 1, from our previous study (45), examined the effects of the angiotensin-converting enzyme inhibitor (ACEI) captopril versus effects of non-pressor ANG II coinfused with captopril via the jugular: 1) control infusion of vehicle (4% BSA in 0.9% saline), 2) captopril infusion in vehicle at 12 μg/min for 20 min, and 3) following 20 min captopril infusion (12 μg/min), ANG II (20 ng·kg−1·min−1) in vehicle coinfused with captopril (12 μg/min) for an additional 20 min. We combined samples from a previous analysis of effects of ANG II on proximal tubule (41; no. 2554; n = 5) with samples newly prepared using the identical protocol (n = 4–5).
Protocol 2.
Protocol 2 examined the effects of acute ANG II infusion (without coinfusion of captopril) versus angiotensin 1 receptor (AT1R) blockade (n = 4 each group): 1) control infusion of vehicle; 2) ANG II in vehicle, 50 ng·kg−1·min−1; and 3) losartan infusion in vehicle, 10 mg/kg bolus over 30 min at 20 μl/min.
Protocol 3.
Protocol 3 examined the effect of feeding rats a sodium-depleted diet for 1 wk as previously described (44; n = 5 each group): 1) control vivarium chow (0.4% Na) and 2) Na-depleted chow (0.07% Na).
Animals were euthanized at the end of all procedures while under deep anesthesia by cutting the diaphragm.
Immunoelectron Microscopy
As described previously (25, 45), at the end of the experimental protocol, kidneys were perfusion-fixed with a 4% paraformaldehyde solution containing 0.1 M sodium cacodylate at pH 7.2 and excised. Tissue blocks were trimmed from the cortex and fixed for 2 h, rinsed in PBS, and infiltrated with 2.3 M sucrose, mounted on holders, and frozen in liquid nitrogen.
Immuno-EM was performed on thin (∼70 nm) cryosections prepared with random orientation from the frozen cortical tissue on a Reichert Ultracut S cryoultramicrotome (Leica), as previously described (25). The cryosections were first blocked by incubation in PBS containing 0.05 M glycine and 0.1% skim milk powder. Sections were labeled with one of the following: polyclonal antiserum against NCC total [D. Ellison, Oregon Health and Science University (OHSU), Portland, OR] at 1:1,600, anti-NCCpT58 (Division of Signal Transduction Therapy, University of Dundee, UK) at 1:800, or with anti-NCCpT53 (36) at 1:2,000. The anti-rabbit antibodies were visualized using goat anti-rabbit IgG conjugated to 10 nm colloidal gold particles (GAR EM10, BioCell Research Laboratories, Cardiff, UK), diluted 1:50 in PBS with 0.1% skim milk powder and polyethyleneglycol (5 mg/ml), and the anti-sheep IgG was visualized with donkey anti-sheep IgG conjugated to 5 or 15 nm colloidal gold particles (BioCell Research Laboratories) diluted 1:50 in PBS with 0.1% skim milk powder and polyethyleneglycol (5 mg/ml). For simultaneous labeling with both anti-NCC total and anti-NCCpT58 antisera, sections were probed with sheep anti-NCCpT58 at 1:800 detected with donkey anti-sheep IgG conjugated to 15 nm colloidal Au and total NCC detected with rabbit antibodies at 1:1,600 probed with goat anti-rabbit IgG tagged with 5 nm Au. The cryosections were stained with 0.3% uranyl acetate in 1.8% methyl-cellulose for 10 min before examination in a FEI Morgagni electron microscope. Electron micrographs were recorded at ×16,000–25,000 on Kodak 163 film and printed at ×50,000. Immunolabeling controls consisted of substitution of the specific primary antibody with nonimmune rabbit or sheep IgG or incubation without primary antibody.
Confocal Microscopy
As previously described in detail (41), kidneys were perfusion-fixed via the dorsal aorta with PLP fixative (2% paraformaldehyde, 75 mM lysine, and 10 mM Na-periodate, pH 7.4) at a rate that did not alter blood pressure (measured via carotid cannula), and were then post-fixed in PLP for another 2–3 h. The fixed tissue was cryoprotected by incubation overnight in 30% sucrose in PBS, embedded in Tissue-Tek OCT compound (Sakura Finetek, Torrance, CA), and frozen in liquid nitrogen. Cryosections (5 μm) were cut and transferred to Fisher Superfrost Plus-charged glass slides and air dried. For immunofluorescence labeling, the sections were rehydrated in PBS, followed by a 10-min wash in 50 mM NH4Cl in PBS, then incubated in 1% SDS in PBS for 5 min for antigen retrieval. Dual labeling was performed by incubating with polyclonal rabbit antiserum against NCC at 1:1,600 and polyclonal sheep antiserum against NCCpT58 also at 1:1,600. The sections were then incubated with a mixture of AlexaFluor 488-conjugated goat anti-rabbit (green) and Alexa 568-conjugated goat anti-sheep (red) (both from Molecular Probes) diluted 1:500 for 1 h and mounted in Prolong Antifade containing the nuclear dye DAPI (Molecular Probes, Invitrogen). Slides were viewed with a Zeiss LSM 510 microscope with differential interference contrast (DIC) overlay.
Homogenization
At the end of the protocols, kidneys were collected and renal cortices were dissected, diced, suspended in 5 ml isolation buffer [5% sorbitol, 5 mM histidine/imidazole buffer, pH 7.5, 0.5 mM disodium EDTA, 0.2 mM phenylmethylsulfonyl fluoride, 9 μg/ml aprotinin, 5 μl/ml of a phosphatase inhibitor cocktail (Sigma P2850)], homogenized for 5 min at a low setting with an Ultra-Turrax T25 (IKA-Labortechnik), and centrifuged at 2,000 g for 10 min. The supernatant was saved, the pellet was rehomogenized in 5 ml isolation buffer and recentrifuged, and the two supernatants were pooled. This 2,000 g supernatant is equivalent to a homogenate; little or no NCC was detected in the final pellet (not shown). Protein concentration was determined in triplicate using the BCA assay (Pierce Biotechnology, Rockford, IL) according to the manufacturer's instructions. Aliquots were frozen at −80°C or immediately subjected to subcellular fractionation.
Density Gradient Fractionation of Renal Cortex
Renal cortices were subjected to subcellular fractionation on sorbitol density gradients as previously described in detail (45). In brief, a 4-ml aliquot of kidney cortex 2,000 g supernatant homogenate was mixed with 6 ml 87.4% sorbitol with protease and phosphatase inhibitors, equilibrated on ice for 1 h, loaded between the two hyperbolic sorbitol gradients (35–55% sorbitol and 55–70% sorbitol), and centrifuged at 100,000 g for 5 h. Twelve fractions were collected, diluted in isolation buffer, pelleted at 250,000 g for 75 min, resuspended in 1 ml isolation buffer, and stored in aliquots at −80°C pending assay.
Differential Fractionation of PM and ICM
Plasma and intracellular membranes were enriched as described by Sachs et al. (43). In brief, the 2,000 g supernatant was spun at 17,000 g; the resultant 17,000 g pellet, enriched in plasma membranes (PM), was resuspended in isolation buffer (see Homogenization). The 17,000 g supernatant was spun at 150,000 g for 80 min, and the pellet, enriched in intracellular membranes (ICM), was resuspended in isolation buffer. Aliquots of the PM and ICM fractions were frozen at −80°C pending assay.
Immunoprecipitation Under Denaturing Conditions
Density gradient fractions enriched in NCC were denatured in 2% SDS and then diluted 10-fold (to 0.2% SDS) in a buffer containing 20 mM Tris·HCl (pH 7.4), 150 mM NaCl, 1 mM EDTA, 1 mM EGTA, 0.5% Triton X-100, and protease and phosphatase inhibitor cocktails (according to the manufacturers' guidelines; Roche and Sigma, respectively). The diluted membranes were preabsorbed with 30 μl of a 50% slurry of protein A/G agarose beads (Pierce) to reduce non-specific protein binding (2 h at 4°C), spun at 3,500 g for 5 min, and the supernatant was incubated with polyclonal anti-NCC total antibody (1:5,000, D. Ellison, OHSU) or monoclonal anti-NKCC total antibody (1 μl/ml, C. Lytle, Univ. of Calif. Riverside). After overnight incubation, 30 μl of protein A/G beads were added, incubated at 4°C for 4 h, and pelleted (3,000 g, 15 min). The beads were washed four times in 50 mM Tris·HCl (pH 7.4), 300 mM NaCl, 5 mM EDTA, 0.02% NaN3, and 0.1% Triton X-100, and a final wash with PBS. Proteins were eluted from the beads with 20 μl 2× Laemmli sample buffer (16) at 60°C for 20 min, separated from the beads using spin filters, then boiled for 5 min, resolved by SDS-PAGE, and subjected to immunoblot analysis.
Immunoprecipitation Under Nondenaturing Conditions
Density gradient fractions enriched in NCC were diluted 1:1 in a dilution buffer containing 20 mM Tris·HCl (pH 7.4), 150 mM NaCl, 1 mM EDTA, 1 mM EGTA, and protease inhibitor cocktail (Roche), treated with 1% Triton X-100 and incubated on ice for 1 h with frequent vortexing. The sample was further diluted up to 1 ml with the same dilution buffer plus 1% Triton X-100, then preabsorbed with 30 μl of a 50% slurry of protein A/G agarose beads (Pierce) to reduce non-specific protein binding, spun at 3,500 g for 5 min, and the supernatant was incubated with polyclonal anti-NCC total antibody (1:5,000, D. Ellison, OHSU). After overnight incubation, 30 μl of protein A/G beads were added and samples were incubated at 4°C for 4 h and pelleted (3,000 g, 15 min). The beads were washed four times in 50 mM Tris·HCl (pH 7.4), 300 mM NaCl, 5 mM EDTA, 0.02% NaN3, and 0.1% Triton X-100, with a final wash with PBS. Proteins were eluted from the beads with 20 μl 2× Laemmli sample buffer at 60°C for 20 min, separated from the beads using spin filters, then boiled for 5 min, resolved by SDS-PAGE, and subjected to immunoblot analysis.
Detergent Solubility
The detergent solubility of NCC was assayed in density fractions from control untreated rat kidneys. Density gradient fractions were physically pooled into three windows: window 1 = fractions 4–5, window 2 = fractions 6–7, and window 3 = fractions 8–10. In brief, as described previously in detail (42), the protein concentration of each window was adjusted to 3 mg/ml, then aliquots were treated with or without 1% Triton X-100 in extraction buffer [50 mM MES (pH 6.4), 60 mM NaCl, 3 mM EGTA, and 5 mM MgCl2 and protease inhibitors (Roche Diagnostics, 1 pill/5.712 ml buffer)], incubated on ice for 1 h with frequent vortexing, then centrifuged at 100,000 g for 30 min. Supernatants (detergent-soluble fraction) and pellets (detergent-insoluble fraction) were collected, and the pellets were resuspended in the same volume as the supernatants. Equal volumes of detergent-soluble and -insoluble fractions were assayed side by side by immunoblot to calculate the percentage of the total that was detergent soluble versus insoluble in each sample in each window.
Immunoblot Detection and Antibodies
SDS-PAGE and immunoblot analysis were used to determine relative abundance and phosphorylation of NCC and other proteins. In homogenates, PM or ICM fractions, a constant amount of protein/sample was assayed and compared on the same gel and blot. To determine protein distributions in density gradients, a constant volume of each fraction was assayed on the same gel and blot. All samples were denatured in Laemmli sample buffer for 20 min at 60°C, resolved on SDS polyacrylamide gels, transferred to polyvinylidene difluoride membranes (PVDF, Immobilon-FL, Millipore), blocked for 1 h to overnight in blocking buffer (LI-COR, Lincoln, NE), and incubated for 2 h to overnight (phosphospecific antibodies incubated 2 h) with antibodies directed against the following: NCC total (1:1,000, D. Ellison, OHSU), NCCpT53 [1:5,000, (36)], NCCpT58 (1:1,000, Division of Signal Transduction Therapy, University of Dundee), NCCpS71 (1:1,500, S. Bachmann lab), NKCC (1:1,000, “T4,” C. Lytle, Univ. of Calif. Riverside), NKCCpT96pT101 (1:2,000, “R5,” B. Forbush, Yale Univ., New Haven, CT), parvalbumin (1:1,000, Santa Cruz Biotechnology), AP2 (1:3,000, Sigma Chemicals), villin (1:1,000, monoclonal ID2C3, Immunotech), γ-adducin (1:1,000, Santa Cruz Biotechnology), SPAK (1:1,000, E. Delpire, Vanderbilt Univ., Nashville, TN), and SPAKpS373/OSR1pS325 (6 μg/25 ml, preabsorbed with nonphosphorylated peptide, Division of Signal Transduction Therapy, University of Dundee). The blots were washed and then incubated with the appropriate secondary antibody used at 1:5,000 dilution: Alexa 680-labeled goat anti-rabbit, Alexa 680-labeled donkey anti-sheep (Molecular Probes, Invitrogen), IRDye 800-labeled goat anti-mouse and 800-labeled goat anti rabbit (LI-COR).
Signals were detected and quantitated with the Odyssey Infrared Imaging System (LI-COR), and accompanying LI-COR software. Linearity of the detection system was verified for each protein by comparing the signal from the samples loaded at 1 versus ½ volume and, if not linear, sample volume readjusted. In addition, parallel protein loading gels were run at 5 μg/lane, stained (not blotted), and random bands were quantitated to assess even protein loading of homogenates, PM, and ICM.
Assessing Protein Complexes With Blue Native-PAGE
Pooled sorbitol density gradient fractions (window I = fractions 3–5, window II = fractions 6–8) or PM and ICM fractions were used as the starting material to assess NCC and NCCp protein complex size. Sample preparation was adapted from a previous application (54). Specifically, membrane fractions were incubated with n-dodecyl-β-d-maltoside (DDM) at a final concentration of 1% on ice for 20 min then centrifuged at 100,000 g for 10 min to remove insoluble material (which was negligible). Blue Native (BN) electrophoresis was performed on the supernatant fraction using Native-PAGE Novex 3–12% Bis-Tris gels (Invitrogen) according to the manufacturer's directions. A constant volume of each window was loaded onto the gel and run at 4°C for 1 h at 150 V and then for another hour at 250 V. The gels were transferred at 4°C for 2 h at 25 V to PVDF membranes in NuPAGE Transfer Buffer (Invitrogen). Membranes were incubated in 8% acetic acid for 15 min to fix the proteins, rinsed in deionized H2O, and destained in 100% methanol for 3 min. The membranes were then incubated in blocking buffer overnight at 4°C, rinsed in TBS, and probed with antibodies and quantitated as described under Immunoblot Detection and Antibodies.
To reassess proteins resolved by BN-PAGE on denaturing SDS-PAGE gels, BN-PAGE gel lanes were cut into four fractions, then each fraction was cut into small pieces and transferred to microfuge tubes, incubated with 2× Laemmli sample buffer for 5 min at 100°C to elute the proteins, then passed through a spin filter to remove gel pieces before running on routine SDS polyacrylamide denaturing gels and immunoblotted as described.
Quantitation and Statistical Analysis
For quantitation of immunoblots of homogenates, PM, and ICM, the normalized abundance of a protein was calculated by first determining the control group mean density. Each control and experimental value was divided by the control group mean density to provide a normalized value. The normalized control group mean value = 1.0, and variance was calculated based on the normalized (not arbitrary) density values for both control and experimental groups. The ratio of NCCp to total NCC was calculated by dividing the arbitrary density value of NCCp by the arbitrary density value of NCC total for each sample. Each control and experimental ratio was then divided by the mean of the control group ratios, and variance was calculated for both control and experimental group ratios.
In samples fractionated on density gradients, the distribution pattern of a protein was expressed as the percentage of the total signal in each fraction (the sum total signal in 12 fractions = 100%); thus, the density pattern is independent of the total amount of protein loaded on the gradient.
Two-tailed Student's t-test assuming equal variance was used to establish whether there was a significant effect of treatment on physiologic parameters or protein expression within a set of animals. In density gradient assays, two-way ANOVA was employed to determine whether there was a significant difference in the overall density distribution pattern of a protein (between windows I, II, and III). The repeated factors were treatment (control, captopril, or angiotensin II + captopril) and window. If the interaction between treatment and window was found to be significant (P < 0.05), then it was concluded that the treatment had a significant effect. After significance was established, the location of the difference in the pattern was assessed by unpaired two-tailed Student's t-test assuming unequal variance with Bonferroni adjustments for multiple comparisons. Data are expressed as mean ± SE. Differences were regarded significant at P < 0.05.
RESULTS
Subcellular Localization of Phosphorylated NCC
Immunoelectron microscope localization of NCC in our previous studies demonstrated redistribution of NCC from the apical plasma membrane (APM) to subapical cytoplasmic vesicles (SCV) in response to acute treatment with the ACE inhibitor captopril, and from these subapical stores to the apical membrane when ANG II was added to the captopril infusion (45). Using the same treatment strategies, we examined the distribution of NCC phosphorylated at threonine 58 in the rat (NCCpT58) which is equivalent to Thr60 in human NCC. This site is phosphorylated in vivo by SPAK (37, 60) and is critical for subsequent phosphorylation of other NCC threonine and serine residues as well as NCC activation by hypotonic milieu (35, 39). NCCpT58 was localized exclusively to the apical plasma membrane in DCT cells from untreated control rats (Fig. 1A). NCC phosphorylated at Thr53 was, likewise, localized exclusively to the APM (Fig. 1B). A higher magnification of the apical membrane demonstrates that the NCCpT58 epitope is located at the inner surface of the apical plasma membrane (Fig. 1A, inset). Presumably, this reflects the location of the Thr 58 on the intracellular NH2-terminal domain of NCC.
Fig. 1.

Immunoelectron microscope localization of untreated rat distal convoluted tubule NCC phosphorylated at threonine 58 (NCCpT58) (A) and at threonine 53 (NCCpT53) (B). Detection of NCCp is restricted to the apical membrane region. Inset in A: higher magnification indicating the epitope labeling with NCCpT58 on intracellular face of the apical plasma membrane. Bars in A and B: 0.5 μm.
NCC localization in rats treated with 12 μg captopril/min for 20 min then detected with either anti-NCCpT58 or anti-NCCpT53 antibodies is shown in Fig. 2, A and B, respectively. Both antibodies detect NCCp in the APM, not in the SCV. Likewise, NCCpT58 localization in rats coinfused with a non-pressor dose of ANG II (20 ng·kg−1·min−1) along with captopril is restricted to the APM and not detected in the SCV. These findings provide evidence that NCCp distribution is restricted to the APM and does not redistribute from APM to SCV in response to ACEI or from SCV to APM in response to ANG II as we have quantitated for total NCC (45). The distinct distribution patterns of NCC total versus NCCpT58 in rats coinfused with ANG II plus captopril is illustrated in Fig. 3: total NCC is detected with secondary antibodies tagged with 5 nm Au and NCCpT58 is detected with secondary antibodies tagged with 15 nm Au particles. NCC total is detected both in apical membranes and in subapical cytoplasmic vesicles as described previously (17, 44, 45), while NCCpT58 is detected only in apical membranes (24, 36). These results suggest that NCC phosphorylation occurs in or at the APM. However, from these immuno-EM findings we cannot rule out the possibility that the phosphorylated epitope is masked and that pools of NCCp in SCV are not detectable. This question is addressed subsequently in fractionated membranes.
Fig. 2.

Immunoelectron microscope localization of phosphorylated NCC in response to infusion with 12 μg captopril/min for 20 min (A and B) or coinfusion with a non-pressor dose of ANG II (20 ng·kg−1·min−1) along with 12 μg captopril/min for 20 min (C). A: NCCpT58 detection in DCT from captopril-treated rats. B: NCCpT53 detection in DCT from captopril-treated rats. C: NCCpT58 detection in DCT from ANG II + captopril-treated rats. In all three experimental protocols, phosphorylated NCC labeling is restricted to the apical plasma membrane region. Scale bars: 0.5 μm.
Fig. 3.

NCC total and NCCpT58 detection in ANG II + captopril-treated rats. Total NCC is detected with secondary antibodies tagged with 5 nm Au and NCCpT58 is tagged with 15 nm Au particles. NCC total is detected in both the apical membranes (arrows pointing down) and in subapical cytoplasmic vesicles (arrows pointing up) as described previously (44, 45), while NCCpT58 is detected in apical membrane alone (24, 36). Scale bars: 0.5 μm.
Specificity of NCC Phosphospecific Antibodies
NCC and NKCC are homologous sodium coupled cotransporters that are both regulated by the kinases SPAK and OSR1 (29). Sequence alignment of the NH2-terminal regions of NKCC2 and NCC reveal multiple conserved Ser/Thr residues that constitute regions of phosphorylation by both SPAK and OSR1 (40). For this reason, it was important to determine the NCC specificity of antibodies before using them as tools to assess specific NCCp regulation in renal cortical membranes that contain both DCT NCC and thick ascending limb NKCC2, likely phosphorylated at analogous sites. Figure 4A is a confocal microscope image of renal cortex from a control rat colabeled with an antibody generated against total NCC (detected in green), and an antibody generated against NCCpT58 (detected in red) and nuclear dye (blue). The NCC and NCCpT58 signals overlap (indicated in yellow) in the DCT; a zone of subapical unphosphorylated NCC (which would be green) was not clearly evident at this level of resolution. NCCpT58 also labeled neighboring tubules in cortex where NCC total was not detected, presumably indicating cross-reaction with a homologous NH2-terminal phospho-threonine in cortical TAL NKCC (40). Deeper into the medullary regions of these sections, there was no labeling with anti-total NCC and a great deal of labeling with anti-NCCpT58 in TAL (not shown), providing additional evidence for detection of analogous phosphorylation sites on both NCC and NKCC with anti-NCCpT58 (from this source, cited in methods).
Fig. 4.

Assessing cross-reactivity of anti-NCC antibodies with NKCC and vice versa. A: renal cortex from a control rat probed with antibody generated against total NCC (detected in green), antibody generated against NCCpT58 (detected in red) and nuclear dye (blue). DCT were colabeled with both antibodies indicating appropriate detection of NCCpT58. Anti-NCCpT58 also labeled neighboring tubules where NCC total was not detected, presumably cross-reaction with cortical TAL-expressing NKCC that has a homologous NH2-terminal phospho-threonine (40). B: cross-reaction of phosphospecific antibodies was evaluated by immunoprecipitation (IP) of total NCC and total NKCC from 35 μg renal cortical membranes followed by immunoblot (IB) probing with anti-NCC, anti-NKCC, and phosphospecific antisera. As a positive control, 3.5 μg of total membranes were directly probed (pre-IP membranes).
Cross-reaction of anti-NCC and anti-NKCC phosphospecific antibodies was evaluated directly by immunoprecipitation of total NCC and total NKCC from 35 μg of renal cortical membranes followed by immunoblot and probing with anti-NCC, anti-NKCC, and anti-phosphospecific antisera. As a positive control, 3.5 μg of total membranes were directly immunoblotted without immunoprecipitation (pre-IP membranes). As shown in Fig. 4B, the anti-total NCC and anti-total NKCC antibodies are very specific with little or no cross-reactivity. The anti-NCCpT53 exhibited a high degree of specificity for NCC with very little detection of the homologous site at NKCCpT96. The anti-NCCpS71 antisera had a very high degree of specificity for NCC over NKCC, as expected since there is not a homologous phosphorylation site in NKCC. In contrast, anti-NCCpT58 detects both NCCpT58 and the homologous site at NKCCpT101 at the dilutions tested as predicted from the results in Fig. 4A. Anti-NKCCpT96pT101 has very little cross-reaction with the homologous regions of NCC at NCCpT53 or pT58. From these findings we conclude that 1) when batches of NCCp antibodies are prepared, they should be tested against NKCC to rule out cross-reaction with NKCC, 2) when using anti-NCCpT58 to detect NCCp by immunohistochemistry, counterstaining with antibodies to total NCC will identify specific NCCp and rule out NKCCp labeling; 3) the specific anti-NCCpT53 and anti-NCCpS71 reagents analyzed in Fig. 4 can be used in assays of total renal cortical membranes by immunoblot because of high specificity for NCC over NKCC.
Neither Acute ACE Inhibition nor Acute ANG II Infusion Alter Abundance of NCC or NCCp
To determine whether acute changes in ANG II alter the phosphorylation state of NCC, we compared animals infused with the ACEI captopril (12 μg/min, to reduce endogenous production of ANG II) to animals coinfused with this level of captopril plus ANG II (20 ng·kg−1·min−1), an “ANG II clamp.” Previous studies (41, 45) demonstrated that these doses of captopril and ANG II did not change mean arterial pressure or glomerular filtration rate and that urine output increased during captopril treatment in one study (45) but not significantly in another (41), as in the current analysis (Fig. 5). In the current study, we assessed renal cortex homogenates (2,000 g supernatants) by immunoblotting for NCC phosphorylated at T53 and at S71 as well as NCC total assayed in parallel in the same samples, and results are expressed as the ratio of NCCp/NCC total. We tested the hypothesis that acute ACE inhibitor infusion would decrease the phosphorylation ratio, and that ANG II (20 ng·kg−1·min−1) addition to the infusate would increase the NCCp/NCC total ratio. Figure 5 summarizes the results. We did not detect a significant change in NCCpT53 or NCCpS71 abundance or in their respective NCCp/total ratios either after acute captopril or after acute ANG II + captopril infusion.
Fig. 5.

Lack of effect of acute (20 min) treatment with the ACE inhibitor captopril (12 μg/min) or ANG II (20 ng·kg−1·min−1) + captopril (12 μg/min) on NCC phosphorylation. Homogenates (2,000 g supernatants) were assayed by immunoblotting with specific antibodies against NCC total, NCCpT53, and NCCpS71. Each lane contains a sample from a different animal assayed in the same order on each blot (n = 4). Not shown: all samples were assayed and transferred to the same blot at 1 and ½ amounts (20 and 10 μg/lane) and densities were quantitated to verify doubling of signal with doubling of homogenate protein assayed. NCCp/total ratio was calculated from densities of identical samples assayed in tandem and is expressed as mean ± SE. Parvalbumin was assayed as a measure of length of the DCT1 (50 μg/lane), and villin was assayed as an independent measure of protein loading.
To explore whether the significant animal to animal variation in NCC was due to differences in the length of the DCT/animal, we probed blots with an antibody directed against parvalbumin (PV), a cytoplasmic protein expressed in DCT1 (22). No direct relationship was evident between NCC and PV expression; in fact, an inverse relationship was suggested. To assess whether the variability was secondary to uneven protein loading or blotting, we reprobed the blots with an antibody against the actin bundling protein villin, chosen because it is expressed at high levels in renal cortex, its detection is in the same linear range as NCC (10–20 μg/lane), and it is clearly separated from NCC on the blots. Villin abundance was uniform across samples (Fig. 5), indicating even loading and blotting.
The coinfusion of captopril along with ANG II could potentially blunt the actions of the infused ANG II, for example, by inhibiting the intrarenal production of ANG II (33). We implemented a second protocol to reexamine our hypothesis that ANG II infusion would increase NCC phosphorylation: rats were infused for 30 min either with the AT1R blocker losartan (10 mg/kg) or with ANG II (50 ng·kg−1·min−1) and no added ACE inhibitor, or infused with vehicle. As evidence of the efficacy of the treatments, mean arterial pressure tended to fall in losartan-infused versus control-infused rats (102 ± 4 vs. 85 ± 11 mmHg, not significant) and mean arterial pressure was significantly increased in ANG II-infused rats versus controls (137 ± 1.2 mmHg). In addition, urine output rate tended to fall with lower blood pressure (not significant) and doubled with ANG II infusion, evidence of a pressure natriuresis response (Fig. 6A). Neither treatment altered the NCCpT53/NCC total ratio or the NCCpS71/NCC total ratio. SPAK and SPAKpS373 were also assayed in these same renal cortical homogenates to determine whether there was any relationship between this kinase and the abundance of total NCC or phosphorylated NCC across the samples. As recently reported, three main isoforms are evident between 50 and 60 kDa (26): full-length SPAK (FL-SPAK ∼60 kDa), the faster migrating SPAK-2, and smaller kidney-specific SPAK (KS-SPAK), which lacks the kinase domain and inhibits the effects of FL-SPAK to phosphorylate NCC (26). In general, the pattern of all three isoforms varied similarly across samples, was unrelated to the pattern of variability of NCC and NCCp, and was unaffected by the 30-min treatments with losartan or ANG II. SPAK phosphorylation, detected on the same blot coincident with the SPAK-FL band and calculated as the SPAKpS373/SPAK-total ratio, was not significantly decreased during acute angiotensin receptor blocker treatment with losartan nor increased significantly with acute ANG II infusion (although there was a trend for an increase between losartan and ANG II-treated groups). In this sample set, uniformity of protein loading was verified by reprobing with an antibody to the clathrin adaptor AP2 (not shown).
Fig. 6.

Lack of effect of acute (30 min) treatment with the ANG II receptor blocker losartan (10 mg/kg) or ANG II (50 ng·kg−1·min−1) on NCC phosphorylation. A: mean arterial pressure and urine output rate (mg/min) were measured to establish efficacy of treatments (*P < 0.05). Homogenates (2,000 g supernatants) were assayed to determine if there was a change in NCCpT53/NCC total (assayed at 45 μg/lane) or NCCpS71/NCC total (assayed at 25 μg/lane) ratios. Each lane contains a sample from a different animal assayed in the same order on each blot (n = 4). NCCp/total ratios were calculated from densities of identical samples assayed in tandem and are expressed as means ± SE. SPAK (three isoforms) was detected in the same samples in the same order (20 μg/lane), SPAKpS373 (40 μg/lane) overlapped in mobility with full length SPAK and was absent in a SPAK knock out mouse sample (not shown). SPAKp/total ratios were calculated from densities obtained on the same blot using different secondary antibodies with distinct emission spectra (Alexa 680-labeled donkey anti-sheep and IRDye 800-labeled goat anti-rabbit) and are expressed as means ± SE. B: analysis of NCC and NCCpT53 in plasma membranes (PM, 12 μg/lane) and intracellular membranes (ICM, 45 μg/lane) from renal cortex. NCCp/NCC total ratio was determined as described in methods.
The immuno-EM results (Figs. 1 and 2) indicated that phosphorylated NCC was localized to the apical plasma membrane alone. Because of the possibility that the phosphorylated NCC epitopes were masked in the tissue sections, we fractionated homogenates from control, losartan-treated, and ANG II-treated renal cortex into PM-enriched and intracellular membrane (ICM)-enriched pools, subjected the samples to denaturing SDS-PAGE and immunoblot, which would presumably expose epitopes, and examined total NCC and NCCp in each compartment (Fig. 6B). Confirming the immuno-EM results, NCCpT53 was restricted to the PM pool, and NCC total was present in both PM and ICM enriched pools. The percentages of total NCC in PM versus ICM, adjusting for the volume of protein recovered and loaded, was 90% in PM versus 10% in the ICM, respectively. Treatment with ANG II did not significantly increase NCCp/total ratio in enriched PM. Sample-to-sample variation precluded assessing NCC trafficking between PM and ICM.
To validate that our methods were consistent with detecting a significant change in NCC abundance and NCCp, we treated a set of rats with low-salt diet for 1 wk, a protocol previously demonstrated to increase NCC as well as NCCp/NCC total ratio in mice (5, 51). Cortical NCC total, NCCpT53, and NCCpS71 abundance increased to 1.48 ± 0.05-, 1.34 ± 0.05-, and 1.96 ± 0.13-fold over normal-salt-fed rats, respectively (all P < 0.05, Fig. 7). NCCpT53 increased in proportion to NCC total, while the NCCpS71/NCC total ratio increased 1.32 ± 0.05-fold (P < 0.05). The length of DCT1, assessed by measuring parvalbumin abundance (22), was not apparently increased during low-salt feeding, indicating an increase in the number of NCC per DCT cell.
Fig. 7.

Increased NCC and NCC phosphorylation during chronic high-salt diet. Rats were fed normal-salt (0.4% NaCl) diet versus low-salt (0.07% NaCl) diet for 1 wk as described in methods. Each lane represents a sample from a different animal assayed in the same order on each blot (n = 5). Not shown: all samples were assayed on the same blot at both 30 and 60 μg/lane and densities were quantitated to verify doubling of signal with doubling of homogenate protein. NCCpT53/NCC total and NCCpS71/NCC total ratios were calculated from densities of identical samples assayed in tandem and are expressed as means ± SE (*P < 0.05). On the same blots, parvalbumin was assayed as a measure of length of the DCT1, and the clathrin adaptor AP2 was assayed as a loading control.
Acute ACE Inhibition and ANG II Stimulation Alter Density Gradient Distribution of NCCp and NCC
Figures 1–3 and 6 indicate that NCCp is located in the apical membranes, thus, unlike total NCC, there does not appear to be a recruitable pool of subapical NCCp. We previously provided evidence, using both subcellular fractionation on sorbitol density gradients as well as immuno-EM, that captopril treatment provokes net redistribution of NCC from low-density plasma membranes (PM) to higher-density subapical cytoplasmic vesicles (SCV), and that coinfusion of ANG II redistributes NCC from the higher density SCV back into the lower-density PM (45). Taken together, we predicted that the subcellular distribution of NCCpT53 on sorbitol density gradients would not change significantly during captopril or ANG II treatment. Figure 8 summarizes the sorbitol density distribution patterns of NCCpT53 (Fig. 8A) and NCC total (Fig. 8B) from renal cortex homogenates from 9–10 sets of rats treated as in protocol 1: control, 20 min captopril, and 20 min ANG II + captopril after 20 min captopril. Unexpectedly, the results indicate that NCCpT53 redistributes to higher density membranes after 20 min of captopril treatment and returns to lower-density membranes after 20 min of ANG II treatment (Fig. 8A). NCCpS71, determined in a subset of samples, redistributed in an indistinguishable pattern to that of NCCpT53 (not shown). This redistribution, in the face of evidence for localization of all of the NCCp to plasma membranes (Figs. 1–3 and 6) and lack of change in NCCp/total ratio in total membranes (Figs. 5 and 6), suggests that NCCpT53 redistribution occurs between distinct domains within the apical plasma membranes. Our previously published redistribution of total NCC in response to captopril and ANG II (44) was reproduced in this sample set (Fig. 8B). The density distribution pattern of both NCCpT53 and NCC total in captopril-treated samples was significantly shifted to higher densities compared with control and ANG II treated samples (P < 0.05 by ANOVA).
Fig. 8.
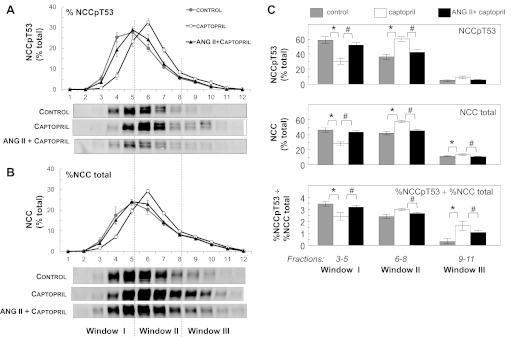
Effects of captopril and ANG II on density distribution of NCCpT53 and NCC total A and B: density distributions of control samples (gray circles) versus acute captopril (12 μg/min × 20 min; ○), versus coinfusion of ANG II and captopril (20 ng·kg−1·min−1 ANG II along with 12 μg/min captopril × 20–30 min, ▲). Relative abundance, determined by immunoblotting of a constant volume of each fraction, is expressed as a percentage of total signal (% total) in all 12 fractions (defined as 100%). Values are means ± SE, n = 9–10. The density distribution patterns of captopril-treated samples were determined to be significantly different from their respective patterns in control and ANG II-treated samples for both NCCpT53 (A) and NCC total (B) (P < 0.05, by ANOVA as described in methods). The distribution patterns of ANG II + captopril versus control samples were not significantly different for either NCCpT53 or NCC total. Typical immunoblots of samples from each treatment group run on the same blot are shown under the graphs. C: the sorbitol density distribution patterns of each sample for NCCpT53 and NCC total were mathematically pooled into three windows: window I = sum of densities in fractions 3–5; window II = sum of densities in fractions 6–8; window III = sum of densities in fractions 9–11. Control (gray bars), captopril-infused (open bars), and ANG II + captopril-infused (black bars) densities are expressed as the percentage of the total signal in the 12 fractions (100%). Values are means ± SE (n = 9–10). The effect of treatments on distribution was analyzed by ANOVA. *P < 0.05 for captopril vs. control; #P < 0.05 for ANG II + captopril vs. captopril alone.
Interestingly, the density distribution and redistribution patterns of NCC and NCCp are distinct, as predicted from their distinct subcellular distributions. Figure 8C summarizes the relative percentages of NCCpT53 and NCC total localized to pooled fractions of the density gradients: window I = fractions 3–5, window II = fractions 6–8, and window III = fractions 9–11. In control samples, NCCpT53 was preferentially enriched in window I (59 ± 5%) versus window II (36 ± 4%) with very little in window III (5 ± 1%). In contrast, NCC total (including both unphosphorylated and phosphorylated NCC) was equivalent in window I (46 ± 3%) and window II (42 ± 2%) with less in window III (11.5 ± 1%). Thus, window I has the highest ratio of %NCCp to %NCC total and window III the lowest (evident in Fig. 8C, bottom), consistent with the previous assignment of window I as enriched plasma membranes, window II as a pool of mixed PM and SCV, and window III as intracellular membranes (28, 44, 45). During ACE inhibition by captopril, 50% of the NCCpT53 in window I (30% of the total NCCpT53) redistributes to window II, increasing the amount in window II to 60 ± 3% of total NCCpT53 and decreasing the amount in window I to 30.5 ± 4%. In parallel, a smaller percentage of total NCC redistributes from window I to II and, unlike NCCpT53, also redistributes to window III, as reported previously (45). With acute ANG II infusion and stimulation, the percentage of NCCpT53 in window I increases >20% to 52 ± 3% of total at the expense of an equivalent fall in NCCpT53 in window II; NCC total in window I increases 15% and decreases in windows II and III as previously reported (45). Overall, the ratio of %NCCpT53 to %NCC total in window I decreased significantly during captopril treatment and increases significantly during ANG II stimulation (Fig. 8C, bottom); that is, ANG II increased the NCCpT53/NCC total ratio in low-density apical plasma membranes despite the fact that ANG II did not increase overall NCCpT53 to NCC ratio assessed in total homogenates. These unexpected findings provide evidence that captopril treatment as well as acute ANG II infusion provoke changes in the physical density of the NCCp containing plasma membranes independent of subcellular redistribution between PM and SCV. The results suggest that the domain location of NCCp in the APM may be an additional important variable in regulating NCC activity.
Distinct Detergent Solubility of NCC versus NCCpT53
Given the evidence that NCCpT53 remains in the apical membrane during captopril and ANG II treatment, we aimed to determine whether NCC exists in multiple domains or conformations in the DCT that could account for the distribution pattern on density gradients. Lipid raft localization and cytoskeletal attachment of transporters in “detergent-resistant membranes” (3) are known to affect density distribution. Membrane proteins that are confined to lipid rafts or strongly associated with cytoskeleton have reduced solubility in nonionic detergents such as Triton X-100 (30). To assess detergent solubility of NCC versus NCCpT53 in control vehicle-infused samples, density gradient fractions of renal cortex were pooled into three windows (fractions 2, 3, 11, 12 omitted because they had very low amounts of NCC): fractions 4–5 (window I), fractions 6–7 (window II), and fractions 8–10 (window III), adjusted to a constant protein concentration, treated with 1% Triton X-100, and centrifuged to separate the detergent-insoluble from the detergent-soluble fractions. The detergent-insoluble pellet was adjusted to the same volume as the detergent-soluble supernatant to assess the percentage of insoluble NCC and NCCpT53 in each window. Figure 9 illustrates that the detergent insolubility of NCCpT53 was significantly lower than that of NCC total in all three windows (P < 0.05) and that there is no significant difference in Triton solubility between windows. There was a tendency for higher insolubility of both NCC and NCCp in window III, a region of the gradient enriched in lysosomes that contained very low percentages of NCC and NCCp. The results provide evidence for at least two physical states of NCC that differ as a function of phosphorylation state.
Fig. 9.

Detergent solubility of NCC versus NCCpT53. Renal cortex from control vehicle-treated animals was subjected to sorbitol density gradient centrifugation (as in Fig. 7), and the fractions were pooled into windows, adjusted to the same [protein] then treated with cold 1% Triton X-100 and centrifuged to separate the detergent-insoluble pellet from detergent-soluble supernatant. The pellet was resuspended in the same volume as the supernatant. A constant volume of supernatants and resuspended pellets was assayed by immunoblotting to determine the percentage in the detergent-insoluble fraction. Window I, pooled fractions 4–5; window II, pooled fractions 6–7; window III, pooled fractions 8–10. Values are means ± SE, n = 4. *P < 0.05 NCCpT53 compared with NCC total in the same samples.
Analysis of Total NCC versus Phosphorylated NCC Multimeric Complexes on BN Gels
To determine whether NCC forms oligomeric structures that could account for redistribution patterns on the density gradients, membrane samples were analyzed by one-dimensional BN-PAGE (57) followed by immunoblotting. This approach uses mild neutral detergents to solubilize membrane proteins to preserve protein-protein interactions and uses the anionic dye Coomassie Blue G-250 in the sample buffer to provide negative charge to drive electrophoretic separation of the proteins. We pooled sorbitol density gradient fractions from control, captopril-infused, and ANG II + captopril-infused samples into two windows: WI = fractions 3–5, WII = fractions 6–8. Fractions 9–12 were not assayed as they contained very low percentages of NCC and NCCp. Pooled membranes were subjected to BN-PAGE followed by immunoblotting for NCC total, NCCpT53, and NCCpS71 as described in methods. In samples from all three treatment groups and in both WI and WII, anti-NCC total detected two distinct complexes (Fig. 10A). When compared with soluble molecular weight markers, NCC total migrated at ∼700 kDa and ∼400 kDa, while NCCpT53 and NCCpS71 were detected primarily at 700 kDa, with only very little detected at 400 kDa. There was no evidence of monomeric or even dimeric NCC or NCCp expected at 150–300 kDa, respectively, in the nondenatured state. Although only one of each treatment group was analyzed, it is evident that there is no significant change in the size of the NCC or NCCp oligomers with captopril or ANG II treatment.
Fig. 10.

Resolution of NCC by BN-PAGE reveals discrete oligomers. A: sorbitol density gradient fractions from control, captopril-infused (cap), and ANG II + captopril-infused (ANG II + cap) samples were pooled into two windows (WI = fractions 3–5, WII = fractions 6–8), pelleted, subjected to nondenaturing BN-PAGE, transferred to PVDF membrane, and immunoblotted for NCC total, NCCpT53, and NCCpS71 as described in methods (note: control, captopril-, and ANG II-treated samples were assayed on the same gel). Apparent oligomeric size was determined by comparison with NativeMark molecular weight markers (Invitrogen). Complexes of total NCC, NCCpT53, and NCCpS71 were detected at ∼700 kDa, and an additional complex was detected with NCC total alone at ∼400 kDa. B: to rule out nonspecific aggregation at 700 kDa, membranes prepared as described in A were probed for Na-K-ATPase α1 (NKA α1), which is very abundant in the renal cortex. C: enriched plasma membranes and intracellular membranes were similarly analyzed by BN-PAGE and immunoblotted for NCCpS71 and NCC total. NCCpS71 was detected primarily at ∼700 kDa and almost exclusively in PM, consistent with Fig. 5B. NCC total detected mainly the ∼700 kDa complex in PM and mainly the 400 kDa complex in ICM. D: to establish that the immunoreactive bands were NCC, BN-PAGE lanes were cut into 4 fractions, as indicated in C, eluted into sample buffer as described in methods, and resolved by SDS-PAGE. After SDS-PAGE, NCC at the expected size of 150 kDa was detected in fraction 3 of both PM and ICM (containing the 700 kDa band) as well as in fraction 2 of ICM fraction (containing the 400 kDa band).
As a control to demonstrate that proteins did not nonspecifically aggregate at ∼700 and 400 kDa, we probed control samples for Na-K-ATPase α1 (NKA α1) in the same windows. NKA α1, expressed in very high levels in kidney plasma membranes, is normally detected as a 100 kDa monomer by SDS-PAGE and was detected in a ∼250 kDa complex in both windows (Fig. 10B), consistent with a 1968 estimation of membrane bound Na-K-ATPase molecular weight by radiation inactivation (15). This finding supports the validity of this method for determining the size of membrane protein oligomers in kidney membranes.
To assess the subcellular distribution of the 400 and 700 kDa NCC oligomers, control samples of renal cortex from untreated rats were fractionated into plasma membranes and intracellular membranes (PM and ICM), as described in methods, and subjected to BN-PAGE followed by immunoblotting. A typical set is shown in Fig. 10C. NCCpS71 was detected primarily at 700 kDa almost exclusively in PM, consistent with Fig. 6B and the immuno-EM findings. For NCC total, a ∼700 kDa complex predominates in PM and a 400 kDa complex predominates in ICM. The results suggest that 1) PM NCC is localized almost exclusively in a ∼700 kDa complex that contains phosphorylated NCC (whether it also contains unphosphorylated NCC cannot be determined with the antibodies at hand) and 2) enriched ICM contains unphosphorylated NCC in a ∼400 kDa complex not detected in PM.
To definitely establish that the complexes at 700 and 400 kDa contained NCC, they were further analyzed by SDS-PAGE. PM and ICM were resolved by BN-PAGE and gels were cut into four fractions as indicated on the right of Fig. 10C, denatured, resolved by SDS-PAGE, and immunoblotted (Fig. 10D). As predicted, both NCC and NCCp from the 700 kDa complex in fraction 3 of PM was detected at the expected size of 150 kDa and also just above 250 kDa, a size detected by other labs (9, 51); a smaller amount of NCC from ICM fraction 3 was also detected at 150 and 250 kDa. In ICM, NCC from the 400 kDa complex in fraction 2 was detected at 150 kDa, validating that this complex (seen in the WI, WII, and ICM fractions) contains NCC. NCC was not detected in fraction 1 (below 250 kDa) or fraction 4 (above ∼900 kDa, not shown), which could have contained monomeric NCC or very large complexes of NCC, respectively.
Using pull-down assays, Dimke et al. (7) identified γ-adducin as a binding partner that bound to the NH2-terminal region of NCC and stimulated NCC transport activity in Xenopus oocytes. Based on this evidence for interaction and activation, we tested the hypothesis that the 700 kDa complex contained γ-adducin along with NCC and NCCp. Density gradient fraction membranes from rats treated with captopril versus ANG II + captopril (WI and WII, as in Fig. 10A) were probed with the same anti-γ-adducin referenced by Dimke et al. Two complexes were detected: one at 700 kDa, coincident with the NCC complex and roughly proportional to the abundance of NCC, and another above the 720 kDa marker (Fig. 11A). γ-Adducin was not detected at 400 kDa. Coimmunoprecipitation (co-IP) was used to assess whether NCC and γ-adducin interact in a complex in vivo (Fig. 11C). In individual denaturing immunoprecipitations, γ-adducin was detected at ∼125 kDa and NCC was detected at ∼150 kDa. After nondenaturing IP of NCC, γ-adducin was detected at 125 kDa by immunoblotting, evidence of interaction in vivo and colocalization in the 700 kDa complex. Since the previous in vitro study indicated that adducin bound only to the nonphosphorylated form of NCC transporter (7), we next tested whether there was any interaction between phosphorylated NCC and γ-adducin in vivo. γ-Adducin was immunoprecipitated under nondenaturing conditions from WI and WII pooled fractions, blotted, and probed. Although anti-γ adducin detected bands in both windows at ∼125 kDa (evidence of successful immunoprecipitation) and NCCpT58 was abundant in pre-IP WI and WII aliquots, anti-NCCpT58 did not detect phosphorylated NCC precipitating with γ-adducin (Fig. 11D). These in vivo results provide support for the in vitro finding (7) that γ-adducin interacts with nonphosphorylated, but not phosphorylated NCC.
Fig. 11.

NCC, but not NCCp, interacts with γ-adducin in vivo. A: BN-PAGE immunoblots probed with anti-NCC (same as Fig. 10A) and with anti-γ-adducin. γ-Adducin is detected at 700 kDa, coincident with NCC relative mobility, and at a higher apparent size not associated with NCC. B: denaturing IP followed by IB detects γ-adducin between 100 and 130 kDa and NCC at ∼150 kDa. C: nondenaturing IP of NCC followed by IB with γ-adducin indicates that γ-adducin coprecipitates with NCC in vivo. #γ-Adducin is not detected after IP with an antibody to NKCC (T4), which does not IP its target under nondenaturing conditions, included as a control. D: non-denaturing IP of γ-adducin from control renal cortex subjected to subcellular fractionation into WI and WII (as described in methods) followed by IB with anti- γ-adducin or with NCCpT58 indicates that NCCpT58 does not coprecipitate with γ-adducin in vivo. Pre-IP samples from WI and WII probed with NCCpT58 are included to verify presence of NCCpT58 in sample subjected to IP. Faint band below 130 kDa in D is γ-adducin detected from a previous probing of the blot.
DISCUSSION
In previous studies we provided evidence for regulated redistribution of NCC between apical plasma membranes and subapical cytoplasmic vesicles in response to acute treatment with the ACE inhibitor captopril, with ANG II, and in response to high-salt diet (44, 45, 59). Other labs have shown that NCC phosphorylation increases NCC transport activity (35, 39). In the current study we aimed to determine how NCC redistribution was related to NCC phosphorylation, specifically, if there was evidence for acute regulation of NCC phosphorylation by ANG II or captopril, regulation of NCCp subcellular distribution, and whether we could discern differences in the physical properties of NCCp versus NCC. We discovered that 1) NCCp is restricted to the APM and is not redistributed between APM and SCV in response to ACEI or ANG II treatment and 2) overall NCC phosphorylation, expressed as NCCp/NCC total ratio, did not increase in response to acute ACEI or ANG II infusion, however, 3) by density gradient fractionation we isolated a population of low density APM in which NCCp/total ratio decreased in response to ACEI with captopril and increased during ANG II infusion and another pool of higher-density APM that responded reciprocally, indicative of regulated redistribution between two APM pools, 4) NCCp and NCC total have distinct density gradient profiles, and 5) NCCp and NCC total exist in distinct multimeric complexes in distinct membrane domains.
Subcellular Localization of Phosphorylated NCC
We examined distribution of NCCp by immuno-EM in response to ACEI and ANG II and found that NCCp was detected only in the plasma membranes. From this we conclude that NCC is phosphorylated and dephosphorylated exclusively in the plasma membrane and that net trafficking between APM and SCV is unrelated to phosphorylation. However, from our results we cannot rule out the possibility that NCC is phosphorylated in the SCV and then moved so rapidly to the APM that an intracellular pool of NCCp is not detected by our methods. It will be interesting to determine whether phosphorylation increases the APM NCC pool size by stabilizing NCC and/or whether dephosphorylation increases the likelihood of internalization and degradation. The possibility that the epitopes for NCC phosphorylation were masked or unavailable in the intracellular membrane pools was addressed in our analysis of enriched pools of plasma membranes and intracellular membranes following denaturation and resolution by SDS-PAGE and immunoblot (Fig. 6B): NCC total was detected in both PM and ICM while NCCp was almost completely in the PM, confirming the distribution observed in the APM by immuno-EM. This finding is in agreement with recent reports of NCCp distribution during vasopressin stimulation (31, 36). From the immuno-EM panels it is clear that there is a substantial pool of unphosphorylated NCC in the subapical compartment. In our previous study of NCC trafficking we calculated that this SCV pool contained ∼30% of the total NCC (45); in comparison, after fractionation of PM versus ICM (Fig. 6B), we calculated the fraction of total NCC in ICM to be ∼10% [based on relative immunodetection signals (Fig. 6B), the amount of protein loaded (12 μg for PM, 45 μg for ICM), and the total amount of protein recovered in PM versus ICM (90% in PM, 10% in ICM)]. The difference between these two estimates may be a result of incomplete separation of PM from ICM or incomplete recovery of NCC in low-density ICM (43). The direct counting of silver grains in PM versus subapical pools is likely to be more accurate. In summary, >70% of the NCC total and most all of the NCCp is localized to the apical plasma membrane while 30% or less of the NCC is localized to subapical stores and it is not phosphorylated at T53, T58, or S71.
Specificity of Phosphospecific Antibodies for NCC versus NKCC
In the renal cortex there are significant levels of thick ascending limb NKCC along with DCT NCC and even more NKCC in whole kidney due to the medullary thick ascending limbs. Thus, studies should, and often do, include assays of antibody specificity for NCCp versus NKCCp: assay of cortex versus medulla (no NCC in medulla), immunoprecipitation (Fig. 4), or assay of a NCC-knockout sample for studies in mice. This is less critical in immunohistochemistry assays, as nature separates expression of NKCC and NCC in cortex. Specificity is an important consideration because there is evidence for differential regulation of NCC versus NKCC phosphorylation by the kinases SPAK and OSR1, suggesting that SPAK primarily regulates NCC in cortex and OSR1 primarily regulates NKCC in medulla (21, 26, 60) and that the truncated form of SPAK inhibits SPAK and OSR1 kinase activity in both cortex and medulla (26). SPAK and OSR1 both phosphorylate rodent NCC at multiple conserved Ser and Thr residues in the cytoplasmic NH2-terminal domain. Phosphorylation at Thr58 appears to play a very critical role in the phosphorylation and activation of NCC as 1) experimental mutation of this site prevents the phosphorylation of the other NH2-terminal phosphorylation sites and 2) mutations at this site, observed in some Gitelman's syndrome patients, cause a loss of function and a syndrome characterized by low blood pressure and salt wasting (29, 39). This phosphorylation site is homologous to a site in the same region of the renal NKCC2; thus, it is not surprising that phosphospecific antibodies can cross-react with both transporters (40). It is possible that the NCCp antibodies can be diluted to the point that they are specific for NCCpT58 and not detect NKCCp, but dilution has the potential to reduce the signal-to-noise ratio. For this reason, we utilized antibodies to other NH2-terminal phosphorylation sites (NCCpT53 and NCCpS71) that we could demonstrate were NCC specific in our immunoprecipitation and immunoblot assays. Previous studies have provided strong support for the conclusion that the regulation of NCCpT53 and NCCpS71 abundance levels are proportional to the regulation of NCCpT58 levels in the kidney (5, 31, 36, 37, 51, 52, 60).
ACE Inhibition, AT1R Blocking, and ANG II Infusion Do Not Change Pool Size of Renal Cortex Homogenate NCC or NCCp
We have established that acute infusion of the ACEI captopril or captopril plus ANG II provokes transporter trafficking and changes renal output (18, 19, 41, 45). In this study, using the same protocol, we assessed whether these responses were accompanied by a change in NCC phosphorylation, measured in renal cortical homogenates. We did not detect a decrease in NCCp with ACE inhibition or AT1 receptor inhibition or an increase in NCCp with ANG II infusion. However, we did measure an increase in NCCp/total ratio in rats fed a low-salt diet for 1 wk (a protocol that stimulates the renin-angiotensin system), in agreement with analogous previous studies in mice (5, 51). Recent studies have reported acute and chronic regulation of NCC phosphorylation by a number of regulators. A study in mice reported a transient effect of ANG II after infusing 5 ng·g−1·min−1 × 5 min (equivalent to 5 μg·kg−1·min−1), a dose 100- to 250-fold higher than that used in this study, which may explain the discrepancy (50). Acute phosphorylation of NCC in rats by vasopressin has been reported (31, 36), as well as phosphorylation by acute insulin stimulation (47). Chronic infusion of a non-pressor dose of ANG II over 4 days in mice increased pool size of NCCpT58 fourfold (4). The NCCpT58 antibody used in that study is the same as the anti-NCCpT58 used in Fig. 4 and may also detect NKCC. However, we recently confirmed the increase in NCCp after 14 days of ANG II infusion in mice using the phosphospecific NCCpS71 (Gonzalez-Villalobos RA and McDonough AA, unpublished observations). In adrenalectomized rats, ANG II infusion for 8 days at a non-pressor dose increased both NCC total and NCCp to the same extent; thus, ANG II increased NCCp abundance in the absence of aldosterone without changing the NCCp/NCC total ratio (52).
NCC and NCCp in renal homogenates exhibit significant animal to animal variability. This is also evident in other recent studies of NCC in rodent kidney (31, 36, 51, 52). The variability of NCC total and NCCp is generally proportional, indicating that the variability in NCCp is not due to loss of phosphorylation during sample isolation. Since the length of the DCT is subject to regulation (2), we probed the same samples with parvalbumin, expressed in DCT1, as a surrogate marker of DCT length. There was no positive correlation between the levels of NCC or NCCp and parvalbumin, indicating that the variability is more likely due to differences in the number of NCC per DCT cell rather than the number of DCT cells. The observation that acute ACE inhibition, AT1 receptor blocking, and/or ANG II infusion do not provoke changes in overall NCCp abundance or NCCp/NCC total ratio in renal cortex homogenates does not necessarily lead to the conclusion that this ratio is not important for ANG II-stimulated transport across the apical membrane of the renal DCT cell because reciprocal changes in subcellular pools of NCC and simultaneous increases in both phosphorylation and dephosphorylation (10) of this cotransporter could produce this outcome.
Acute ACE Inhibition and ANG II Stimulation Alter Density Gradient Distribution of NCCp As Well As NCC Total
McCormick et al. (27) recently generated an NCC transgenic mouse that had 1.7-fold higher NCC abundance in the renal cortex but none of the expected phenotypes of elevated NCC activity and no elevation in NCCp abundance, i.e., NCCp/total ratio decreased. This finding suggests that total NCC abundance is less important than NCC phosphorylation. The sorbitol density gradient studies in this study identified a pool of low-density membranes (fractions 3–5, window I, Fig. 8) that contained 60% of the NCCp which was reduced in half during acute captopril infusion and restored to baseline levels with ANG II infusion. The studies also identified a pool of NCCp at higher densities (fractions 6–8, window II) that contained 30% of the NCCp which nearly doubled with captopril and returned to baseline with ANG II infusion. Since the NCCp appears to be resident only in the APM (Figs. 1–3), the results suggest that NCCp acutely redistributes within domains of the APM in response to ACEI and ANG II. There are interpretations that do not involve redistribution, such as reciprocal phosphorylation and dephosphorylation within window I and II, but whatever the cause, the analysis reveals distinct populations of membranes that exhibit pronounced changes in phosphorylation of NCC in response to inhibition of, or stimulation with, ANG II. In addition, the changes in NCCp were larger than the changes in NCC total redistribution such that the ratio of NCCpT53/NCC total in window I decreased during captopril and increased during ANG II infusion despite the fact that this ratio was unchanged in renal cortex homogenates.
These unexpected findings provide evidence that captopril and ANG II infusion provoke significant changes in the physical density of the NCCpT53 containing plasma membranes and suggest a new layer of regulation of cotransporter activity that complements regulation by phosphorylation and distribution between apical and subapical pools. The findings are not unprecedented: we previously established that renal proximal tubule Na+/H+ exchanger (NHE3) redistributes to higher-density membranes at the base of the microvilli during acute captopril treatment (where they have lower activity) and returns to low-density membranes in the body of the microvilli upon ANG II stimulation by moving within the membrane without ever leaving the APM (18, 28, 41).
The immuno-EM and subcellular fractionation results suggest distinct redistribution routes for NCC vs. NCCp in response to ACEI and ANG II. Certainly, this and previous studies demonstrate that NCCp remains resident in the APM while NCC total redistributes between the APM and SCV. What is currently unknowable (with the reagents available) is the density distribution pattern of unphosphorylated NCC and its redistribution in response to ACEI and ANG II, that is, whether there is significant redistribution of unphosphorylated NCC within the APM or only between the APM and SCV. With this caveat in mind, by combining these findings with our previous results, we postulate that 1) captopril (driving a drop in ANG II production) stimulates NCCp to redistribute within the APM to higher-density membranes (perhaps with lower transport activity) as well as net redistribution of unphosphorylated NCC from APM to SCV (or decreases NCC traffic from SCV to APM) and 2) ANG II stimulates NCCp to redistribute within the APM to lower density membranes (perhaps with higher transport activity) as well as net redistribution of unphosphorylated NCC from SCV to APM (or decreases NCC traffic from APM to SCV). These results provided the rationale for examining the physical properties of NCC and NCCp in apical and intracellular membranes.
Distinct Detergent Solubility of NCC versus NCCpT53
We previously assessed the fraction of NCC total in ordered lipid raft and nonraft domains on flotation gradients. Most of the NCC comigrated with flotillin, evidence of localization in ordered lipid domains (17). In the current study we performed a simpler assay of cold Triton X-100 solubility (without resolution on flotation gradients). Proteins resist Triton solubilization if they are in ordered lipid domains or attached to cytoskeletal elements. We found that ∼30% of NCC total was Triton insoluble in all three windows of the density gradient (Fig. 9) and that within a window, the phosphorylated NCC was significantly more soluble in Triton. The unmeasured unphosphorylated NCC is likely to have an even higher percent detergent insolubility because the anti-total NCC recognizes both unphosphorylated and phosphorylated NCC (Figs. 3 and 4). The results imply that NCCp is less tethered to cytoskeletal elements and redistributes to more fluid lipid domains but we cannot conclude whether this is a consequence of NCC phosphorylation per se. The Triton solubility of NCCp was not significantly different between low-density window I and higher-density window II, suggesting that redistribution of NCC in response to ACEI or ANG II does not involve changes in raft versus nonraft domain properties. Notwithstanding, there is a precedent for stimulus-provoked redistribution of renal TAL NKCC between membrane domains: Welker et al. (56) reported that 30% of the thick ascending limb NKCC was present in lipid rafts at baseline, assessed on flotation gradients, and that a short vasopressin treatment increased this percentage to 60%, interpreted as evidence for redistribution of NKCC into more ordered domains coincident with trafficking to the apical plasma membrane (NKCCp was not examined). It would be interesting to determine whether vasopressin also affects NCC distribution in raft versus nonraft domains. In comparison, in the proximal tubule, ∼80% of NHE3 and ∼50% of the Na+ Pi transporter (NaPi2) are Triton insoluble, and in response to acute hypertension, NHE3 solubility remains very low as it retracts to the base of the microvilli while the fraction of insoluble NaPi2 increases to >70% as it is endocytosed (42), indicating quite distinct and variable sodium transporter membrane domain properties along the nephron.
Multimeric Complexes of NCC and NCCp
Determination of the number and sizes of native multimeric complexes of renal NCC and NCCp did not reveal an explanation for their acute redistribution on density gradients in response to captopril or ANG II infusion, but it did provide highly relevant information about the nature of the complex that undergoes the redistribution. First, virtually none of the NCC exists as simple NCC monomers or dimers in plasma membranes or intracellular membranes, but rather in discrete complexes that are around 400 kDa or 700 kDa. These sizes need to be viewed as apparent rather than absolute molecular weights because, like SDS-PAGE, the apparent mobility could be influenced by posttranslational modifications, and in addition, the complex mobility in the BN-PAGE can be influenced by bound lipids and Coomassie dye. On the positive side, for the case of the NKA α1, it turns out that the complex size is very close to the size in the membranes determined by radiation inactivation (15). In addition, the results demonstrate that BN-PAGE can be used to investigate native complexes of proteins that are expressed in only a small number of cells in an organ (e.g., the DCT cells of the kidney). Interestingly, the analysis suggests that the unphosphorylated NCC in intracellular membranes are found in a 400 kDa complex, while NCCp are found in a 700 kDa complex in the PM. Whether the 400 kDa complex is en route to or from the PM cannot be determined from these results. However, if this finding can be replicated in a cultured cell model, it will be possible to determine the biosynthetic relationship between the two complexes using pulse chase strategies.
The only candidate we tested for coexpression in the complex was γ-adducin based on the recent study of Dimke et al. (7) in heterologous expression systems that suggested γ-adducin binds to unphosphorylated NCC, where it can attract SPAK and OSR1 binding to the complex and phosphorylate NCC (6). The model predicts that γ-adducin would be released from NCC after phosphorylation. Our results indicate colocalization of NCC and γ-adducin in the same 700 kDa complex, as well as complex formation with unphosphorylated NCC but not NCCpT58, providing in vivo support for the previous in vitro findings (7). Clearly, it will be interesting to apply this technique to determine whether SPAK, OSR1, WNKs, or phosphatases are also 700 kDa complex members and whether proteins involved in targeting NCC to degradation pathways are present in the 400 kDa complex (49). Another attractive complex candidate is a myosin motor, which could drive NCC complexes between low- and high-density membranes in response to ANG II, analogous to myosin VI which drives NHE3 along the proximal tubule microvilli during ACE inhibition (28).
In summary, this study examined the molecular mechanisms responsible for the acute effects of ACE inhibition and ANG II on the renal NCC. The study does not provide evidence for acute overall NCC dephosphorylation or phosphorylation, but the study does provide evidence that all the NCCp is localized to the apical plasma membranes in multiple pools in detergent-soluble 700 kDa complexes containing γ-adducin and that these pools are subject to acute regulation: acute in vivo treatment with the ACEI captopril provokes redistribution of NCCp complexes within the apical membranes to a pool in higher-density membranes that have a lower ratio of NCCp/NCC total; subsequent acute in vivo treatment with ANG II provokes a return of NCCp-containing complexes to the pool of lower-density membranes that have an overall higher NCCp/NCC ratio. Future studies can now be directed at determining the NCC complex constituents and how they participate in the bridge between signal and response.
GRANTS
This work was supported in part by NIH National Institute of Diabetes and Digestive and Kidney Diseases (NIDDK) Grant DK-083785 and an American Society of Nephrology Scherbenske Award (to A. A. McDonough), Danish Medical Research Council (to A. B. Maunsbach and R. A. Fenton) and Lundbeck Foundation (to R. A. Fenton), NIDDK Grant DK-062283 (to A. S. Yu), and Deutsche Forschungsgemeinschaft Grant FOR667 (to S. Bachmann).
DISCLOSURES
No conflicts of interest, financial or otherwise, are declared by the author(s).
AUTHOR CONTRIBUTIONS
D.H.L., A.B.M., A.D.R.-B., A.S.Y., and A.A.M. conception and design of the research; D.H.L., A.B.M., A.D.R.-B., M.T.X.N., and A.A.M. performed the experiments; D.H.L., A.B.M., A.D.R.-B., M.T.X.N., R.A.F., S.B., A.S.Y., and A.A.M. analyzed the data; D.H.L., A.B.M., A.D.R.-B., M.T.X.N., R.A.F., S.B., A.S.Y., and A.A.M. interpreted the results of the experiments; D.H.L., A.B.M., M.T.X.N., and A.A.M. prepared the figures; D.H.L., A.B.M., and A.A.M. drafted the manuscript; D.H.L., A.B.M., A.D.R.-B., M.T.X.N., R.A.F., S.B., A.S.Y., and A.A.M. edited and revised the manuscript; D.H.L., A.B.M., A.D.R.-B., M.T.X.N., R.A.F., S.B., A.S.Y., and A.A.M. approved the final version of the manuscript.
ACKNOWLEDGMENTS
We thank Else-Merete Løcke and Karen Thomsen for expert technical assistance. We thank Cristina Lopez-Roman for analyzing PM versus ICM and Ryan Smith for the PV blots. We thank David Ellison, Biff Forbush, and Chris Lytle for generously providing antibodies and advice, and thank Beat Schwaller for providing a PV knockout kidney.
REFERENCES
- 1. Appel LJ. The verdict from ALLHAT–thiazide diuretics are the preferred initial therapy for hypertension. JAMA 288: 3039– 3042, 2002 [DOI] [PubMed] [Google Scholar]
- 2. Belge H, Gailly P, Schwaller B, Loffing J, Debaix H, Riveira-Munoz E, Beauwens R, Devogelaer JP, Hoenderop JG, Bindels RJ, Devuyst O. Renal expression of parvalbumin is critical for NaCl handling and response to diuretics. Proc Natl Acad Sci USA 104: 14849– 14854, 2007 [DOI] [PMC free article] [PubMed] [Google Scholar]
- 3. Brown DA. Lipid rafts, detergent-resistant membranes, and raft targeting signals. Physiology (Bethesda) 21: 430– 439, 2006 [DOI] [PubMed] [Google Scholar]
- 4. Castaneda-Bueno M, Cervantes-Perez LG, Vazquez N, Uribe N, Kantesaria S, Morla L, Bobadilla NA, Doucet A, Alessi DR, Gamba G. Activation of the renal Na+:Cl− cotransporter by angiotensin II is a WNK4-dependent process. Proc Natl Acad Sci USA 109: 7929– 7934, 2012 [DOI] [PMC free article] [PubMed] [Google Scholar]
- 5. Chiga M, Rai T, Yang SS, Ohta A, Takizawa T, Sasaki S, Uchida S. Dietary salt regulates the phosphorylation of OSR1/SPAK kinases and the sodium chloride cotransporter through aldosterone. Kidney Int 74: 1403– 1409, 2008 [DOI] [PubMed] [Google Scholar]
- 6. Dimke H. Exploring the intricate regulatory network controlling the thiazide-sensitive NaCl cotransporter (NCC). Pflügers Arch 462: 767– 777, 2011 [DOI] [PMC free article] [PubMed] [Google Scholar]
- 7. Dimke H, San-Cristobal P, de Graaf M, Lenders JW, Deinum J, Hoenderop JG, Bindels RJ. γ-Adducin stimulates the thiazide-sensitive NaCl cotransporter. J Am Soc Nephrol 22: 508– 517, 2011 [DOI] [PMC free article] [PubMed] [Google Scholar]
- 8. Feric M, Zhao B, Hoffert JD, Pisitkun T, Knepper MA. Large-scale phosphoproteomic analysis of membrane proteins in renal proximal and distal tubule. Am J Physiol Cell Physiol 300: C755– C770, 2011 [DOI] [PMC free article] [PubMed] [Google Scholar]
- 9. Frindt G, Ergonul Z, Palmer LG. Surface expression of epithelial Na channel protein in rat kidney. J Gen Physiol 131: 617– 627, 2008 [DOI] [PMC free article] [PubMed] [Google Scholar]
- 10. Gagnon KB, England R, Diehl L, Delpire E. Apoptosis-associated tyrosine kinase scaffolding of protein phosphatase 1 and SPAK reveals a novel pathway for Na-K-2C1 cotransporter regulation. Am J Physiol Cell Physiol 292: C1809– C1815, 2007 [DOI] [PubMed] [Google Scholar]
- 12. Hadchouel J, Soukaseum C, Busst C, Zhou XO, Baudrie V, Zurrer T, Cambillau M, Elghozi JL, Lifton RP, Loffing J, Jeunemaitre X. Decreased ENaC expression compensates the increased NCC activity following inactivation of the kidney-specific isoform of WNK1 and prevents hypertension. Proc Natl Acad Sci USA 107: 18109– 18114, 2010 [DOI] [PMC free article] [PubMed] [Google Scholar]
- 13. Hoorn EJ, Walsh SB, McCormick JA, Furstenberg A, Yang CL, Roeschel T, Paliege A, Howie AJ, Conley J, Bachmann S, Unwin RJ, Ellison DH. The calcineurin inhibitor tacrolimus activates the renal sodium chloride cotransporter to cause hypertension. Nat Med 17: 1304– 1309, 2011 [DOI] [PMC free article] [PubMed] [Google Scholar]
- 14. Kahle KT, Wilson FH, Lifton RP. Regulation of diverse ion transport pathways by WNK4 kinase: a novel molecular switch. Trends Endocrinol Metab 16: 98– 103, 2005 [DOI] [PubMed] [Google Scholar]
- 15. Kepner GR, Macey RI. Molecular weight estimation of membrane bound ATPase by in vacuo radiation inactivation. Biochem Biophys Res Commun 30: 582– 587, 1968 [DOI] [PubMed] [Google Scholar]
- 16. Laemmli UK. Cleavage of structural proteins during the assembly of the head of bacteriophage T4. Nature 227: 680– 685, 1970 [DOI] [PubMed] [Google Scholar]
- 17. Lee DH, Riquier AD, Yang LE, Leong PK, Maunsbach AB, McDonough AA. Acute hypertension provokes acute trafficking of distal tubule Na-Cl cotransporter (NCC) to subapical cytoplasmic vesicles. Am J Physiol Renal Physiol 296: F810– F818, 2009 [DOI] [PMC free article] [PubMed] [Google Scholar]
- 18. Leong PK, Devillez A, Sandberg MB, Yang LE, Yip DK, Klein JB, McDonough AA. Effects of ACE inhibition on proximal tubule sodium transport. Am J Physiol Renal Physiol 290: F854– F863, 2006 [DOI] [PubMed] [Google Scholar]
- 19. Leong PK, Yang LE, Holstein-Rathlou NH, McDonough AA. Angiotensin II clamp prevents the second step in renal apical NHE3 internalization during acute hypertension. Am J Physiol Renal Physiol 283: F1142– F1150, 2002 [DOI] [PubMed] [Google Scholar]
- 20. Leviel F, Hubner CA, Houillier P, Morla L, El Moghrabi S, Brideau G, Hatim H, Parker MD, Kurth I, Kougioumtzes A, Sinning A, Pech V, Riemondy KA, Miller RL, Hummler E, Shull GE, Aronson PS, Doucet A, Wall SM, Chambrey R, Eladari D. The Na+-dependent chloride-bicarbonate exchanger SLC4A8 mediates an electroneutral Na+ reabsorption process in the renal cortical collecting ducts of mice. J Clin Invest 120: 1627– 1635, 2010 [DOI] [PMC free article] [PubMed] [Google Scholar]
- 21. Lin SH, Yu IS, Jiang ST, Lin SW, Chu P, Chen A, Sytwu HK, Sohara E, Uchida S, Sasaki S, Yang SS. Impaired phosphorylation of Na+-K+-2Cl− cotransporter by oxidative stress-responsive kinase-1 deficiency manifests hypotension and Bartter-like syndrome. Proc Natl Acad Sci USA 108: 17538– 17543, 2011 [DOI] [PMC free article] [PubMed] [Google Scholar]
- 22. Loffing J, Vallon V, Loffing-Cueni D, Aregger F, Richter K, Pietri L, Bloch-Faure M, Hoenderop JG, Shull GE, Meneton P, Kaissling B. Altered renal distal tubule structure and renal Na+ and Ca2+ handling in a mouse model for Gitelman's syndrome. J Am Soc Nephrol 15: 2276– 2288, 2004 [DOI] [PubMed] [Google Scholar]
- 23. Masilamani S, Wang X, Kim GH, Brooks H, Nielsen J, Nielsen S, Nakamura K, Stokes JB, Knepper MA. Time course of renal Na-K-ATPase, NHE3, NKCC2, NCC, and ENaC abundance changes with dietary NaCl restriction. Am J Physiol Renal Physiol 283: F648– F657, 2002 [DOI] [PubMed] [Google Scholar]
- 24. Maunsbach AB, Lee DH, Riquier AD, McDonough AA. AngII stimulates phosphorylation and trafficking of distal tubule Na-Cl cotransporter (NCC) to apical membrane in vivo (Abstract). American Society of Nephrology - Renal Week 2009 F-FC276: 2009. [Google Scholar]
- 25. Maunsbach AB, Vorum H, Kwon TH, Nielsen S, Simonsen B, Choi I, Schmitt BM, Boron WF, Aalkjaer C. Immunoelectron microscopic localization of the electrogenic Na/HCO3 cotransporter in rat and ambystoma kidney. J Am Soc Nephrol 11: 2179– 2189, 2000 [DOI] [PubMed] [Google Scholar]
- 26. McCormick JA, Mutig K, Nelson JH, Saritas T, Hoorn EJ, Yang CL, Rogers S, Curry J, Delpire E, Bachmann S, Ellison DH. A SPAK isoform switch modulates renal salt transport and blood pressure. Cell Metab 14: 352– 364, 2011 [DOI] [PMC free article] [PubMed] [Google Scholar]
- 27. McCormick JA, Nelson JH, Yang CL, Curry JN, Ellison DH. Overexpression of the sodium chloride cotransporter is not sufficient to cause familial hyperkalemic hypertension. Hypertension 58: 888– 894, 2011 [DOI] [PMC free article] [PubMed] [Google Scholar]
- 28. McDonough AA. Mechanisms of proximal tubule sodium transport regulation that link extracellular fluid volume and blood pressure. Am J Physiol Regul Integr Comp Physiol 298: R851– R861, 2010 [DOI] [PMC free article] [PubMed] [Google Scholar]
- 29. Mercier-Zuber A, O'Shaughnessy KM. Role of SPAK and OSR1 signalling in the regulation of NaCl cotransporters. Curr Opin Nephrol Hypertens 20: 534– 540, 2011 [DOI] [PubMed] [Google Scholar]
- 30. Munro S. Lipid rafts: elusive or illusive? Cell 115: 377– 388, 2003 [DOI] [PubMed] [Google Scholar]
- 31. Mutig K, Saritas T, Uchida S, Kahl T, Borowski T, Paliege A, Bohlick A, Bleich M, Shan Q, Bachmann S. Short-term stimulation of the thiazide-sensitive Na+-Cl− cotransporter by vasopressin involves phosphorylation and membrane translocation. Am J Physiol Renal Physiol 298: F502– F509, 2010 [DOI] [PubMed] [Google Scholar]
- 32. Na KY, Oh YK, Han JS, Joo KW, Lee JS, Earm JH, Knepper MA, Kim GH. Upregulation of Na+ transporter abundances in response to chronic thiazide or loop diuretic treatment in rats. Am J Physiol Renal Physiol 284: F133– F143, 2003 [DOI] [PubMed] [Google Scholar]
- 33. Navar LG, Kobori H, Prieto MC, Gonzalez-Villalobos RA. Intratubular renin-angiotensin system in hypertension. Hypertension 57: 355– 362, 2011 [DOI] [PMC free article] [PubMed] [Google Scholar]
- 34. Nielsen J, Kwon TH, Masilamani S, Beutler K, Hager H, Nielsen S, Knepper MA. Sodium transporter abundance profiling in kidney: effect of spironolactone. Am J Physiol Renal Physiol 283: F923– F933, 2002 [DOI] [PubMed] [Google Scholar]
- 35. Pacheco-Alvarez D, Cristobal PS, Meade P, Moreno E, Vazquez N, Munoz E, Diaz A, Juarez ME, Gimenez I, Gamba G. The Na+:Cl− cotransporter is activated and phosphorylated at the amino-terminal domain upon intracellular chloride depletion. J Biol Chem 281: 28755– 28763, 2006 [DOI] [PubMed] [Google Scholar]
- 36. Pedersen NB, Hofmeister MV, Rosenbaek LL, Nielsen J, Fenton RA. Vasopressin induces phosphorylation of the thiazide-sensitive sodium chloride cotransporter in the distal convoluted tubule. Kidney Int 78: 160– 169, 2010 [DOI] [PubMed] [Google Scholar]
- 37. Rafiqi FH, Zuber AM, Glover M, Richardson C, Fleming S, Jovanovic S, Jovanovic A, O'Shaughnessy KM, Alessi DR. Role of the WNK-activated SPAK kinase in regulating blood pressure. EMBO Mol Med 2: 63– 75, 2010 [DOI] [PMC free article] [PubMed] [Google Scholar]
- 38. Reilly RF, Ellison DH. Mammalian distal tubule: physiology, pathophysiology, and molecular anatomy. Physiol Rev 80: 277– 313, 2000 [DOI] [PubMed] [Google Scholar]
- 39. Richardson C, Rafiqi FH, Karlsson HK, Moleleki N, Vandewalle A, Campbell DG, Morrice NA, Alessi DR. Activation of the thiazide-sensitive Na+-Cl− cotransporter by the WNK-regulated kinases SPAK and OSR1. J Cell Sci 121: 675– 684, 2008 [DOI] [PubMed] [Google Scholar]
- 40. Richardson C, Sakamoto K, de Los Heros P, Deak M, Campbell DG, Prescott AR, Alessi DR. Regulation of the NKCC2 ion cotransporter by SPAK-OSR1-dependent and -independent pathways. J Cell Sci 124: 789– 800, 2011 [DOI] [PMC free article] [PubMed] [Google Scholar]
- 41. Riquier-Brison AD, Leong PK, Pihakaski-Maunsbach K, McDonough AA. Angiotensin II stimulates trafficking of NHE3, NaPi2, and associated proteins into the proximal tubule microvilli. Am J Physiol Renal Physiol 298: F177– F186, 2010 [DOI] [PMC free article] [PubMed] [Google Scholar]
- 42. Riquier AD, Lee DH, McDonough AA. Renal NHE3 and NaPi2 partition into distinct membrane domains. Am J Physiol Cell Physiol 296: C900– C910, 2009 [DOI] [PMC free article] [PubMed] [Google Scholar]
- 43. Sachs AN, Pisitkun T, Hoffert JD, Yu MJ, Knepper MA. LC-MS/MS analysis of differential centrifugation fractions from native inner medullary collecting duct of rat. Am J Physiol Renal Physiol 295: F1799– F1806, 2008 [DOI] [PMC free article] [PubMed] [Google Scholar]
- 44. Sandberg MB, Maunsbach AB, McDonough AA. Redistribution of distal tubule Na+-Cl− cotransporter (NCC) in response to a high-salt diet. Am J Physiol Renal Physiol 291: F503– F508, 2006 [DOI] [PubMed] [Google Scholar]
- 45. Sandberg MB, Riquier AD, Pihakaski-Maunsbach K, McDonough AA, Maunsbach AB. ANG II provokes acute trafficking of distal tubule Na+-Cl− cotransporter to apical membrane. Am J Physiol Renal Physiol 293: F662– F669, 2007 [DOI] [PubMed] [Google Scholar]
- 46. Simon DB, Lifton RP. The molecular basis of inherited hypokalemic alkalosis: Bartter's and Gitelman's syndromes. Am J Physiol Renal Fluid Electrolyte Physiol 271: F961– F966, 1996 [DOI] [PubMed] [Google Scholar]
- 47. Sohara E, Rai T, Yang SS, Ohta A, Naito S, Chiga M, Nomura N, Lin SH, Vandewalle A, Ohta E, Sasaki S, Uchida S. Acute insulin stimulation induces phosphorylation of the Na-Cl cotransporter in cultured distal mpkDCT cells and mouse kidney. PLos One 6: e24277, 2011 [DOI] [PMC free article] [PubMed] [Google Scholar]
- 48. Song J, Hu X, Shi M, Knepper MA, Ecelbarger CA. Effects of dietary fat, NaCl, and fructose on renal sodium and water transporter abundances and systemic blood pressure. Am J Physiol Renal Physiol 287: F1204– F1212, 2004 [DOI] [PubMed] [Google Scholar]
- 49. Subramanya AR, Liu J, Ellison DH, Wade JB, Welling PA. WNK4 diverts the thiazide-sensitive NaCl cotransporter to the lysosome and stimulates AP-3 interaction. J Biol Chem 284: 18471– 18480, 2009 [DOI] [PMC free article] [PubMed] [Google Scholar]
- 50. Talati G, Ohta A, Rai T, Sohara E, Naito S, Vandewalle A, Sasaki S, Uchida S. Effect of angiotensin II on the WNK-OSR1/SPAK-NCC phosphorylation cascade in cultured mpkDCT cells and in vivo mouse kidney. Biochem Biophys Res Commun 393: 844– 848, 2010 [DOI] [PubMed] [Google Scholar]
- 51. Vallon V, Schroth J, Lang F, Kuhl D, Uchida S. Expression and phosphorylation of the Na+-Cl− cotransporter NCC in vivo is regulated by dietary salt, potassium, and SGK1. Am J Physiol Renal Physiol 297: F704– F712, 2009 [DOI] [PMC free article] [PubMed] [Google Scholar]
- 52. Van der Lubbe N, Lim CH, Fenton RA, Meima ME, Jan Danser AH, Zietse R, Hoorn EJ. Angiotensin II induces phosphorylation of the thiazide-sensitive sodium chloride cotransporter independent of aldosterone. Kidney Int 79: 66– 76, 2011 [DOI] [PubMed] [Google Scholar]
- 53. Van der Lubbe N, Lim CH, Meima ME, van Veghel R, Rosenbaek LL, Mutig K, Danser AH, Fenton RA, Zietse R, Hoorn EJ. Aldosterone does not require angiotensin II to activate NCC through a WNK4-SPAK-dependent pathway. Pflügers Arch 463: 853– 863, 2012 [DOI] [PMC free article] [PubMed] [Google Scholar]
- 54. Van Itallie CM, Mitic LL, Anderson JM. Claudin-2 forms homodimers and is a component of a high molecular weight protein complex. J Biol Chem 286: 3442– 3450, 2011 [DOI] [PMC free article] [PubMed] [Google Scholar]
- 55. Wang XY, Masilamani S, Nielsen J, Kwon TH, Brooks HL, Nielsen S, Knepper MA. The renal thiazide-sensitive Na-Cl cotransporter as mediator of the aldosterone-escape phenomenon. J Clin Invest 108: 215– 222, 2001 [DOI] [PMC free article] [PubMed] [Google Scholar]
- 56. Welker P, Bohlick A, Mutig K, Salanova M, Kahl T, Schluter H, Blottner D, Ponce-Coria J, Gamba G, Bachmann S. Renal Na+-K+-Cl− cotransporter activity and vasopressin-induced trafficking are lipid raft-dependent. Am J Physiol Renal Physiol 295: F789– F802, 2008 [DOI] [PMC free article] [PubMed] [Google Scholar]
- 57. Wittig I, Braun HP, Schagger H. Blue native PAGE. Nat Protoc 1: 418– 428, 2006 [DOI] [PubMed] [Google Scholar]
- 58. Yang CL, Angell J, Mitchell R, Ellison DH. WNK kinases regulate thiazide-sensitive Na-Cl cotransport. J Clin Invest 111: 1039– 1045, 2003 [DOI] [PMC free article] [PubMed] [Google Scholar]
- 59. Yang LE, Sandberg MB, Can AD, Pihakaski-Maunsbach K, McDonough AA. Effects of dietary salt on renal Na+ transporter subcellular distribution, abundance, and phosphorylation status. Am J Physiol Renal Physiol 295: F1003– F1016, 2008 [DOI] [PMC free article] [PubMed] [Google Scholar]
- 60. Yang SS, Lo YF, Wu CC, Lin SW, Yeh CJ, Chu P, Sytwu HK, Uchida S, Sasaki S, Lin SH. SPAK-knockout mice manifest Gitelman syndrome and impaired vasoconstriction. J Am Soc Nephrol 21: 1868– 1877, 2010. [DOI] [PMC free article] [PubMed] [Google Scholar]