

Abstract
Objective
To report the time trends of cancer incidence in urban Beijing from 1998 to 2007.
Methods
All data were obtained from Beijing Cancer Registry from 1998-2007 in urban Beijing. Time trends of incidence rate of cancer were assessed by annual percentage change (APC) of age-standardized incidence rate (ASR) of world standard population during this 10-year period.
Results
For all 156851 cancer cases combined, the incidence rate rose in both males and females, with an APC of 2.23% and 3.74%, respectively. The incidence rate of upper gastrointestinal cancers declined significantly, with an APC of -2.83% in esophageal cancer and -1.37% in male gastric cancer, while lower gastrointestinal cancer, such as colorectal cancer, increased with an APC of 4.08%. The rates of kidney and bladder cancer increased with an APC of 7.93% and 5.57%, respectively. For women, the APC continued to rise in breast cancer (4.98%), ovary cancer (6.16%), cervix uteri cancer (11.74%), corpus uteri cancer (6.96%) and thyroid gland cancer (13.39%). The rate of prostate cancer among men increased with an APC of 8.58%; the rate of lymphoma and leukemia increased with APC of 5.48% and 5.44%, respectively.
Conclusion
Because of population aging and urban modernization, the cancer burden in Beijing has become more and more severe and similar to the western developed countries.
Key words: Oncology, Epidemiology, Incidence, Trend
INTRODUCTION
Cancer is the leading cause of death in urban China[1]. The incidence rates in most types of cancers have been rising in recent years because of social and economic development, as well as population aging[2]. According to the report released by Beijing Health Bureau, cancer mortality has taken the first place among all diseases in Beijing since 2007, which became a major issue for the public health[3]. In this study, incidence data of cancer were analyzed to describe the characteristics and time trends of cancers in different sites in urban Beijing from 1998 to 2007.
MATERIALS AND METHODS
Patients
Data of all cancer cases were derived from Beijing Cancer Registry which has collected population-based cancer incidence data since 1976. Medical records of the new cancer inpatients were monthly required to report to the Cancer Registry from all the 138 medical hospitals in urban of Beijing. Before 2002, the information of the newly diagnosed cancer cases were recorded using a standardized notification cards which included the following items: basic demographics, primary site of cancer, histopathology, diagnosed date, reporting hospital, and other relevant variables. Since 2003, all designated hospitals have adopted a uniform guideline of Chinese Cancer Registration to collect surveillance data from the Health Information System (HIS)[4]. The collected data obtained from HIS were uploaded to Beijing Municipal Health Bureau of Statistics Platform monthly.
Cases with the same or similar ID number, name, sex, date of birth, medical record number with the different hospitals are examined manually by a computer program to detect any duplication. Current data analysis was restricted to the 8 urban districts including Dongcheng, Xicheng, Chongwen, Xuanwu, Chaoyang, Haidian, Fengtai, Shijingshan in Beijing. In the meantime, death information provided by death surveillance department of Beijing Center for Disease Control and Prevention were used to supplement or revise the missing incidence data (accounts for almost 15%). We merged the same cases to avoid duplicate and conducted a good quality control based on the guideline of Chinese Cancer Registration and a manual developed by Beijing Cancer Registry[5]. Re-checking the medical records was done to correct the possible error, including illogical items between cancer site and sex, cancer site and histological diagnosis, age and date of birth, etc. The software of IARCcrgTools 2.04 recommended by International Agency for Research on Cancer (IARC) was used to evaluate the validity and concordance between the site of cancer and morphology categories[6].
Population Data
Beijing Municipal Bureau of Statistics completed periodic censuses in 1990 and 2000, respectively. Based on this data of age-specific birth rate and sex ratio of the new born infants, Leslie matrix was used to forecast age-specific population data for each 5 year of 1998-1999 and 2001-2002[7]. During 2003-2007, age-specific population data for each year were provided by government’s population registry, which registered all birth and death cases. Our surveillance data covered 68,704,429 urban people in 10 years (male: 34,906,580 and female: 33,797,849).
Statistical Analysis
Classification of the primary site of malignancies was coded according to the 10th revision of the International Classification of Diseases (ICD-10), and morphology categories were derived from the 2th revision of the International Classification of Diseases for Oncology (ICD-O-2).
The number of the cases, crude incidence rates, cumulative incidence rates, truncated rates (35-64 years old), age-standardized incidence rate adjusted by the world standard population were calculated with the HIS in Beijing Health Bureau[8]. To identify the annual percentage change (APC) for all cancer types, we carried out join-point regression analysis using Join-point Installation 3.4.3 developed by the National Cancer Institute in the U.S.A, weighted by the rate of cancers. A significance level of 0.05 (two tailed) was used for all analyses.
RESULTS
Crude Incidence Rates of the Cancers
From 1998 to 2007, a total of 156,851 new cancer patients (males: 82,557, females: 74,294) were found from 68,704,429 person-years in urban Beijing (Table 1). The crude incidence rate of all combined cancers was 228.30 per 100,000(male:236.51 per 100,000,female:219.82 per 100,000)in the past 10 years. Among the patients aged 0-74, the cumulative incidence rate and truncated rate (35-64 years) were 16.92% and 226.23 (per 100,000), respectively.
Table 1. Time trend of cancer incidence in Urban Beijing by sex, 1998-1999 and 2006-2007.
| Site | ICD-10 | Male |
Female |
||||||||||||||
|---|---|---|---|---|---|---|---|---|---|---|---|---|---|---|---|---|---|
| All cases | 1998-1999 |
2006-2007 |
ASR change (%) | APCb | P | All cases | 1998-1999 |
2006-2007 | ASR change (%) | APCb | P | ||||||
| Case | ASRa | Case | ASRa | Case | ASRa | Case | ASRa | ||||||||||
| Oropharynx | C00-10, 12-14 | 1320 | 207 | 2.33 | 363 | 2.98 | 27.63 | 3.49 | 0.019 | 881 | 134 | 1.46 | 257 | 2.08 | 42.68 | 6.46 | 0.014 |
| Nasophaynx | C11 | 596 | 92 | 1.13 | 123 | 1.12 | -1.59 | 0.50 | 0.687 | 244 | 49 | 0.56 | 50 | 0.45 | -18.71 | -3.66 | 0.049 |
| Oesophagus | C15 | 4743 | 852 | 9.24 | 1029 | 8.01 | -13.25 | -1.85 | 0.006 | 1664 | 348 | 3.54 | 332 | 2.19 | -38-14 | -5.82 | 0.000 |
| Stomach | C16 | 8668 | 1501 | 16.49 | 1958 | 15.00 | -9.04 | -1.37 | 0.016 | 3874 | 673 | 7.04 | 902 | 6.91 | -1.89 | -0.18 | 0.816 |
| Colorectal | C18-20 | 9814 | 1321 | 14.52 | 2753 | 21.10 | 45.32 | 4.38 | 0.000 | 8206 | 1146 | 12.17 | 2194 | 16.34 | 34.32 | 3.69 | 0.000 |
| Liver | C22 | 8820 | 1477 | 16.62 | 2019 | 16.97 | 2.09 | 0.39 | 0.474 | 3082 | 530 | 5.61 | 700 | 5.41 | -3.60 | -0.75 | 0.401 |
| Gallbladder | C23-24 | 1673 | 268 | 2.96 | 485 | 3.55 | 19.64 | 2.92 | 0.063 | 1641 | 244 | 2.53 | 477 | 3.27 | 29.23 | 3.64 | 0.022 |
| Pancreas | C25 | 2520 | 423 | 4.67 | 642 | 5.07 | 8.54 | 0.92 | 0.464 | 2025 | 316 | 3.29 | 570 | 4.19 | 27.23 | 1.91 | 0.141 |
| Larynx | C32 | 1039 | 167 | 1.84 | 258 | 2.14 | 16.07 | 1.21 | 0.337 | 194 | 52 | 0.55 | 35 | 0.27 | -51.01 | -7.88 | 0.019 |
| Lung | C33-34 | 20342 | 3258 | 35.78 | 4877 | 37.27 | 4.16 | 0.38 | 0.343 | 12503 | 1998 | 20.83 | 2959 | 21.14 | 1.48 | 0.14 | 0.678 |
| Bone | C40-41 | 411 | 91 | 1.14 | 63 | 0.76 | -33.10 | -0.48 | 0.013 | 348 | 74 | 1.03 | 68 | 0.78 | -23.98 | -3.95 | 0.195 |
| Melanoma of Skin | C43 | 173 | 21 | 0.24 | 53 | 0.44 | 83.19 | 7.79 | 0.007 | 151 | 19 | 0.20 | 41 | 0.34 | 72.73 | 7.04 | 0.022 |
| Breast | C50 | 136 | 21 | 0.24 | 31 | 0.24 | -0.83 | 1.69 | 0.594 | 16901 | 2397 | 26.23 | 4474 | 37.84 | 44.25 | 4.98 | 0.000 |
| Cervix Uteri | C53 | - | - | - | - | - | - | - | - | 1896 | 206 | 2.16 | 567 | 5.11 | 136.83 | 11.74 | 0.000 |
| Corpus Uteri | C54-55 | - | - | - | - | - | - | - | - | 3253 | 425 | 4.57 | 884 | 7.56 | 65.26 | 6.96 | 0.000 |
| Ovary | C56 | - | - | - | - | - | - | - | - | 3423 | 468 | 5.42 | 982 | 8.57 | 58.10 | 6.16 | 0.000 |
| Prostate | C61 | 3550 | 379 | 4.05 | 1197 | 8.08 | 99.38 | 8.58 | 0.000 | - | - | - | - | - | - | - | - |
| Kidney | C64-65 | 3188 | 415 | 4.64 | 999 | 8.54 | 84.10 | 7.90 | 0.000 | 1881 | 230 | 2.48 | 556 | 4.46 | 79.77 | 7.89 | 0.000 |
| Bladder | C67 | 3996 | 534 | 5.92 | 1132 | 8.70 | 46.88 | 5.55 | 0.000 | 1454 | 191 | 2.00 | 410 | 2.94 | 47.27 | 5.48 | 0.000 |
| Brain, nervos system | C70-72 | 1481 | 270 | 3.37 | 364 | 3.55 | 5.34 | 1.17 | 0.501 | 1203 | 222 | 2.97 | 272 | 2.64 | -11.30 | -0.96 | 0.513 |
| Thyroid Gland | C73 | 661 | 69 | 0.84 | 200 | 1.83 | 117.46 | 9.98 | 0.000 | 2039 | 189 | 2.18 | 662 | 6.53 | 199.82 | 13.39 | 0.000 |
| Lymphoma | C81-85, 88, 90, 96 | 2910 | 405 | 4.91 | 816 | 7.05 | 43.51 | 5.43 | 0.001 | 2094 | 264 | 3.14 | 574 | 5.05 | 60.88 | 5.65 | 0.000 |
| Leukaemia | C91-95 | 2140 | 308 | 4.28 | 526 | 6.37 | 48.88 | 5.64 | 0.004 | 1581 | 245 | 3.36 | 421 | 4.75 | 41.44 | 5.18 | 0.001 |
| O&U | & | 4376 | 624 | 7.51 | 1177 | 10.55 | 40.41 | 5.19 | 0.001 | 3756 | 503 | 5.92 | 1040 | 8.67 | 46.48 | 6.19 | 0.002 |
| Total | - | 82557 | 12703 | 142.73 | 21056 | 162.29 | 18.61 | 2.23 | 0.000 | 74294 | 10923 | 119.22 | 19427 | 157.47 | 32.09 | 3.74 | 0.000 |
aAnnual age-standardized (world population) incidence rate per 1,00,000 person-years; bAnnual percent change from 1998-2007.
The malignancy with the highest incidence rate (per 100,000) among males was lung cancer (58.28), followed by cancers of colorectal (28.12), liver (25.27), gastric (24.83) and esophagus (13.59). The rate of colorectal cancer rose from the fourth place to the second and prostate cancer rose from the tenth to the fifth during 10 years. During the same period, the five most common cancers were breast (50.01), lung (36.99), colorectal (24.28), gastric (11.46) and ovarian (10.13) among females. The rate of ovarian cancer rose from the sixth place to the fifth and thyroid cancer rose from the sixteenth to the seventh. In contrast, liver cancer declined from the fifth to the eighth.
Time Trends of Cancer Incidence
The age-adjusted incidence rate by world standard population among men for all the cancers combined increased 18.61%, from incidence rate of 142.73 (per 100,000) to 169.29 with an APC of 2.23% (Table 1 and Figure 1). For women, the extent of the increase rate was 32.09% and incidence rate increased from 119.22 to 157.47, with an APC of 3.74%. Both APCs showed a statistical significance during the observed time period.
Figure 1.
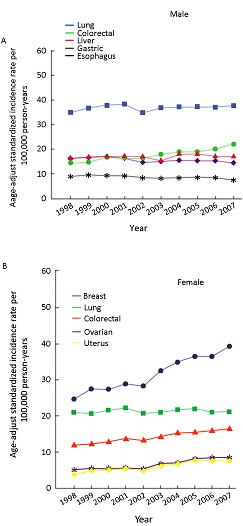
Incidence rates of the five most common cancers in urban Beijing, 1998-2007. A: The cancers in male; B: The cancers in female.
For the digestive system cancers, the malignancy of colorectal has been grown rapidly and increased by 40.14% with an APC of 4.08% (4.38% for men and 3.69% for women) in the last decade. The same results were noted in gallbladder and oropharyngeal cancers, with an APC of 3.26% (2.92% for men and 3.64% for women) and 4.61% (3.49% for men and 6.46% for women), respectively.
In contrast, although the crude incidence rate of esophageal cancer rose with an APC of 0.43%, a contrary result with a decline of 20.01% (APC, -2.83%) was obtained after adjusting by world standardized population. And the rate declined more sharply among women than among men (APC: -5.82% vs -1.85%) during the last 10 years. In terms of gastric cancer, the rate in males declined persistently (9.04%) with an APC of -1.37% (Table 1). However, no significant changes were seen among women patients (APC: -0.18%, P= 0.816). The rate of liver cancer changed slightly with an APC of 0.09% (men: 0.39%, women: 0.75%), ranking the fifth place of all cancers while the rate of pancreatic cancer fell from the 8th to the 11th with an APC of 1.39% (men: 0.929%, women: 1.91%), but no statistical significances were seen for these changes from Table 1.
Lung cancer was the most common cancer among males (20342 cases) and the second one among females (12503 cases) in urban Beijing. The incidence rate increased 38.80% from 39.30 (per 100,000) in 1998 to 54.55 in 2007. But no statistically significant change was seen after age-adjusted (APC: 0.27%, P=0.424), (Figure 1).
According to Table 1, the rate of breast cancer ranked the first among all female cancers (APC: 4.98%), which increased by 44.25% in the last 10 years. Corpus uteri cancer and ovarian cancer, with an APC of 6.96% and 6.16%, ranked 5th and 7th of the cancers, respectively. The rate of cervical cancer has increased by 136.83% with an APC of 11.74%. The number of the female patients who suffered cervical cancer in 1998-99 was 206 while it rose up to 567 in 2006-07 in urban Beijing.
A total number of 258 thyroid cancer cases were founded in 1998-99 in comparison with 862 cases in 2006-07, one of the fastest growing cancer types in the last 10 years, (male: 117.46% overall, APC: 9.98%; female: 199.82% overall, APC: 13.39%) followed by prostate cancer (379 cases in 1998-99 vs 1197 cases in 2006-07; 99.38% overall; APC: 8.58%), kidney cancer (total 645 cases vs 1555 cases; male: 84.10% overall, APC: 7.90%; female: 79.77% overall, APC: 7.89%). and bladder cancer (total 725 cases vs 1542 cases; male: 46.88% overall, APC: 5.55%; female: 47.27% overall, APC: 5.48%). All of these changes were statistically significant. The rate of laryngeal cancer in females, however, showed a steady decline in the last 10 years (-51.01% overall, APC: -7.88%, P<0.05).
As for as hematopoietic system and miscellaneous site, the rate of leukemia increased considerably (553 cases in 1998-99 vs 947 cases in 2006-07; 45.81% overall, APC: 5.44%, P<0.05); Similar changes were observed in malignant melanoma of skin and lymphoma, with an APC of 7.39% and 5.48%, respectively (P<0.05); The rate of malignant neoplasm of brain and nervous system increased by 0.28% per year, but this change was not statistically significant (P=0.833).
DISCUSSION
Our analyses of the surveillance data from Beijing Cancer Registry showed an increased of 57.09% in the crude incidence rate of all cancer-combined among men (184.78 per 100,000 in 1998 and 290.27 per 100,000 in 2007) and 65.04% (165.91per 100,000 in 1998 and 273.82 per 100,000 in 2007) among women over a 10-year period. The growth rates were adjusted into 18.61% and 32.09% according to the world standardized population (Table 1). The prior statistical data demonstrated that the percentage of the residents aged >60 years in Beijing were 10.17% and 14.84% in 1991 and 2000, respectively[9], and increased to 17.35% according to the data released by government’s population registry, 2007, which indicated that population aging was probably the main reason of increasing of crude incidence rates. Although a stable secular trends of some forms of cancer such as lung, female stomach, liver, male gallbladder, pancreas, male larynx, female bone and brain, nervous system malignancy were seen after adjusted by world standard population, the absolute number of the cancer patients was significantly increased in urban Beijing, resulting in a heavy medical burden and a pressing public health issue in the future.
Part of the observed incidence trends may indicate changes in the prevalence of risk factors, including cigarette smoking, health lifestyle and nutritional status of the residents. According to the data of the national survey of nutrition and health status in China, the average consumption of cereals per day in 2002 declined by 10.32% compared with that of in 1992. The consumption of vegetables, fruits, pork, milk and oil per day has increased significantly, with the representation of 7.12%, 30.4%, 9.4%, 49.2% and 29.0%, respectively[10].These changes and the risk factors may be associated with them are discussed below.
Lung cancer is the most common malignancy among men and the second one among women in recent years in urban Beijing. No matter among men or women, the incidence trends of lung cancer were stabilized during the last ten years after adjusted by the world standard population. For men, the incidence rate of it was nearly 2-fold higher than that of colorectal cancer. For women, although the rate was constant, it was higher than that of other cities such as Korea, Singapore and Osaka Prefecture in Asia[8]. Cigarette smoking is the most important risk factor of causing lung cancer[11, 12]. According to the results of 1984 and 1996 National Smoking Surveys in China, the overall smoking prevalence was 33.9% (61.0% for men and 7.0% for women) in 1984 while it was 37.6%, with 66.9% in men and 4.2% in women in 1996[13]. Although a small annually decline of smoking rate (1.2% for men and 0.6% for women) was shown in a study conducted in Beijing Center for Disease Control and Prevention from 2005 through 2008[14], the situation for lung cancer control in Beijing was still serious. If no additional progress is made in reducing smoking-initiation rates and increasing cessation rates, the prevalence of smoking in Beijing, similar to the national data in 1984 and 1996[13], will be continue to rise and the burden of the cancers associated with smoking will be more and more heavy.
The incidence rates of all cancer combined in females increased faster than those in males in the last ten years, which is mainly due to the increase of cancers from reproductive system, including breast, ovarian, cervical and uterine cancers, especially the breast cancer with a significant rise during the last 10 years and as the most common tumor among women in urban Beijing. Recent studies show that, similar to the countries and regions that had rapid socioeconomic growth, western lifestyle, mental stress or anxiety, early age at menarche, late age at menopause, non- breastfeeding and the history of benign breast diseases might be the risk factors for the higher incidence rate of breast cancer in urban Beijing[15-18].
Although the incidence rates of upper gastrointestinal cancer were higher in Asia than that in developed countries, the trends of esophageal and male gastric cancer in urban Beijing were in decline in recent years. This trend may be related to the decline of the consumption of salt-preserved foods and the increasing consumption of fresh fruits and vegetables[19]. For women, the trend of gastric cancer was constant during last decade. The same result was found in the population based study conducted in Shanghai[20], but little was known about the reason that the trend of female gastric cancer hasn’t change during last 10 years. In terms of lower gastrointestinal cancer, however, a dramatically increasing of incidence trend was noted, especially in colorectal cancer. The incidence rate increased 45.32% in men and 34.32% in women. Epidemiological evidence shows that people who eat diets high in fat, especially animal fat and low in fruits and vegetables may have a higher risk of colorectal cancer and the positive association with meat consumption is stronger for colon cancer than rectal cancer[21-25]. The consumption of pork and oil increased 9.4% and 29.0% form 1992 to 2002 in Beijing which was more likely to be associated with the incidence increasing of colorectal cancer in urban Beijing[10].
Although a stabilization of the incidence trend was seen in liver cancer in both genders, the adjusted incidence rate (per 100,000) among men was lower than that in other urban areas such as Guangzhou (42.5), Jiashan (33.8), HongKong (29.5), Shanghai (25.9) and Zhongshan (25.7) in China. For women, same result was seen compared with areas mentioned above, but in Zhongshan, the rate of female liver cancer (5.0) was lower than that in urban Beijing[8]. When compared with other cities in the developed countries such as America and Germany, the incidence rate of liver cancer in Beijing is still high[8]. High infection rates of HBV and HCV and high level consumption of alcohol in China may be attributed to high incidence rate of liver cancer in urban Beijing[3, 26].
Our data indicated that a similar incidence trends of cancers in developed countries has been faced in urban Beijing which were probably due to the westernization of lifestyle, such as lack of physical activity, obesity, accelerated working rhythm and other factors[27, 28]. Thus some salutary experiences such as restrictions on more places in which people can smoke, increasing cigarettes prices, decreasing caloric intake, increasing physical activities, removing of chemical carcinogens from the environment for cancer prevention and control, conducted in developed countries were worthy of learning in urban Beijing. In terms of population aging, effective secondary interventions such as screening strategies aimed at high risk populations will also play an important role in reducing cancer mortality and increasing survival rate. Thus we should make strong efforts and partnerships to ensure full implementation of comprehensive cancer control programs throughout all of the districts of Beijing, so further reductions in the burden of cancer will possibly come into truth in the near future.
REFERENCES
- 1.Chen WQ, Zhang SW. A Representative Study of Cancer Registry in China. China Cancer (in Chinese)2008; 17:832-5 [Google Scholar]
- 2.Chen Z. The report of the 3th retrospective sampling investigation of death in China. Beijing: Peking Union Medical College Press; 2008. [Google Scholar]
- 3.Anual Reports on Public Health of Beijing, 2009. Beijing: People‘s Medical Publishing House; 2010. [Google Scholar]
- 4.National Cancer Registry. Manual of Chinese Cancer Registration. Beijing: Peking Union Medical College Press; 2004. [Google Scholar]
- 5.Wang N, Zhu WX, Xing XM. Construction and improvement of information systems of cancer registry in Beijing. China Cancer (in Chinese) 2010; 19:150-4.
- 6.Chen JG. Checking tools for cancer registry and its application. Chin J Prev Contr Chron Non-Commun Dis (in Chinese)2006; 14:61-4 [Google Scholar]
- 7.Li L, Wang QJ, Cai TJ, et al. Population prediction from statistics of cancer registration data. China Cancer (in Chinese)2004; 13:754-6 [Google Scholar]
- 8.Curado MP, Edwards B, Shin HR, et al. Cancer Incidence in Five Continents, Vol IX. Lyon: IARC Press; 2007. [Google Scholar]
- 9.Wei ZH, Xie XQ, Wei JM. Impact of ageing and related factors on death rate of diabetes mellitus in Beijing. Zhonghua Yu Fang Yi Xue Za Zhi (in Chinese)2005; 39:277-9 [PubMed] [Google Scholar]
- 10.Pang XH, Jiao SF, Huang L, et al. Nutrition and health status of the Beijing residents. Zhonghua Yu Fang Yi Xue Za Zhi (in Chinese)2005; 39:269-72 [PubMed] [Google Scholar]
- 11.Doll R, Hill AB. Smoking and carcinoma of the lung; preliminary report. Br Med J 1950; 2:739-48 [DOI] [PMC free article] [PubMed] [Google Scholar]
- 12.Schroeder SA, Warner KE. Don't forget tobacco. N Engl J Med 2010; 363:201-4 [DOI] [PubMed] [Google Scholar]
- 13.Wang JB, Jiang Y, Wei WQ, et al. Estimation of cancer incidence and mortality attributable to smoking in China. Cancer Causes Control 2010; 21:959-65 [DOI] [PubMed] [Google Scholar]
- 14.Dong Z, Li G, Xie J, et al. Smoking and passive smoking among adults in Beijing. Chin J Public Health (in Chinese)2010; 26:755-6 [Google Scholar]
- 15.Chia KS, Reilly M, Tan CS, et al. Profound changes in breast cancer incidence may reflect changes into a westernized lifestyle: a comparative population-based study in singapore and Sweden. Int J Cancer 2005; 113:302-6 [DOI] [PubMed] [Google Scholar]
- 16.Jara-Lazaro AR, Thilagaratnam S, Tan PH. Breast cancer in Singapore: some perspectives. Breast Cancer 2010; 17:23-8 [DOI] [PubMed] [Google Scholar]
- 17.Fan L, Zheng Y, Yu KD, et al. Breast cancer in a transitional society over 18 years: trends and present status in Shanghai, China. Breast Cancer Res Treat 2009; 117:409-16 [DOI] [PubMed] [Google Scholar]
- 18.Shin HR, Joubert C, Boniol M, et al. Recent trends and patterns in breast cancer incidence among Eastern and Southeastern Asian women. Cancer Causes Control 2010; 21:1777-85 [DOI] [PubMed] [Google Scholar]
- 19.Jung KW, Park S, Kong HJ, et al. Cancer statistics in Korea: incidence, mortality and survival in 2006-2007. J Korean Med Sci 2010; 25:1113-21 [DOI] [PMC free article] [PubMed] [Google Scholar]
- 20.Jin F, Devesa SS, Zheng W, et al. Cancer incidence trends in urban Shanghai, 1972-1989. Int J Cancer 1993; 53:764-70 [DOI] [PubMed] [Google Scholar]
- 21.Li HL, Gao YT, Zheng Y, et al. Incidence trends of colorectal cancer in urban Shanghai, 1973-2005. Zhonghua Yu Fang Yi Xue Za Zhi (in Chinese)2009; 43:875-9 [PubMed] [Google Scholar]
- 22.Center MM, Jemal A, Ward E. International trends in colorectal cancer incidence rates. Cancer Epidemiol Biomarkers Prev 2009; 18:1688-94 [DOI] [PubMed] [Google Scholar]
- 23.You WC, Jin F, Devesa S, et al. Rapid increase in colorectal cancer rates in urban Shanghai, 1972-97, in relation to dietary changes. J Cancer Epidemiol Prev 2002; 7:143-6 [PubMed] [Google Scholar]
- 24.Larsson SC, Wolk A. Meat consumption and risk of colorectal cancer: a meta-analysis of prospective studies. Int J Cancer 2006; 119:2657-64 [DOI] [PubMed] [Google Scholar]
- 25.Haggar FA, Boushey RP. Colorectal cancer epidemiology: incidence, mortality, survival, and risk factors. Clin Colon Rectal Surg 2009; 22:191-7 [DOI] [PMC free article] [PubMed] [Google Scholar]
- 26.Liang H, Wang J, Xiao H, et al. Estimation of cancer incidence and mortality attributable to alcohol drinking in China. BMC Public Health, 2010; 10:730. [DOI] [PMC free article] [PubMed] [Google Scholar]
- 27.Weiderpass E, Pukkala E.Time trends in socioeconomic differences in incidence rates of cancers of gastro-intestinal tract in Finland. BMC Gastroenterol 2006; 6:41. [DOI] [PMC free article] [PubMed] [Google Scholar]
- 28.Williams-Brown S, Singh GK. Epidemiology of cancer in the United States. Semin Oncol Nurs 2005; 21:236-42 [DOI] [PubMed] [Google Scholar]