

Abstract
Objective
To describe the cancer incidence and mortality rates in 2006 and evaluate the cancer burden in China.
Methods
Cancer registration data in 2006 from 34 cancer registries were collected, evaluated and pooled to calculate cancer incidence and mortality rates. The data analyses included mortality to incidence ratio (MI), morphological verification percentage (MV%) and proportion of death certification only (DCO%). Cumulative incidence and mortality rates were calculated using crude data, age-standardized data, and specific data for cancer site, age, sex and area (urban or rural).
Results
In 2006, 34 registries with qualified registration data covered a total population of 59,567,322 (46,558,108 in urban areas and 13,009,214 in rural areas). The crude and age-standardized cancer incidence rates were 273.66 per 100,000 and 190.54 per 100,000, respectively. The crude and age-standardized cancer mortality rates were 175.70 per 100,000 and 117.67 per 100,000, respectively. Cancers of lung, stomach, colon and rectum, liver, and breast in female were the five most common forms of cancer in China, which accounted for 58.99% of all new cancer cases. Lung cancer was the leading cause of cancer death, followed by stomach cancer, liver cancer, esophageal cancer and colorectal cancer.
Conclusion
Cancer is still an important public health issue in China with an increasing disease burden. Specifically, the incidence rates for lung cancer, colorectal cancer and breast cancer were increasing, but those for stomach cancer and esophageal cancer were decreasing. However, age-specific incidence rate remained stable, indicating that the aging population was the major source of the increasing cancer burden.
Key words: Cancer, Cancer registration, Incidence, Mortality
INTRODUCTION
Cancer is the second leading cause of death in China[1]. The incidence and mortality rates for most forms of cancer are increasing, and cancer is becoming one of the most serious public health issues with the socio-economical development and an aging population in China.
Although cancer registries have been established in China for more than 50 years; however, the development of the registries was relatively slow[2]. In the 1960s, there were only two population-based cancer registries in Shanghai and Linzhou. The National Office for Cancer Prevention and Control has compiled and published a “Manual of Cancer Registration” referring to international experience and actual situations in 1982.
In 2002, Central Cancer Registries was established by the Health Ministry of China to enhance systematic management of cancer surveillance. Since then, the quantity and quality of cancer registration have greatly improved. Furthermore, since the cancer registration reporting interval was changed from every 5 years to yearly in 2005, the National Central Cancer Registry has enhanced the management, intensified the construction of cancer registries, and improved the data quality. In the first volume of the Cancer Registry Annual Report, 36 cancer registries submitted data detailing new cancer cases and deaths in 2003[3]. In 2007, the number of reporting registries increased to 43 and the registration data quality was also improved. In 2009, there were 49 cancer registries reporting data to the center.
The annual cancer report was published to accurately reflect the cancer burden and epidemic in China and to provide current data from registered areas for scientific researches. Based on the current situation of cancer registration and the increasing demand for cancer information to develop anti-cancer strategies, the “Program of Chinese Cancer Registry and Follow-up” was approved by the Ministry of Health[4].
In this study, cancer incidence and mortality rates were calculated based on pooled cancer registration data. Although the representativeness of the resource at national level is still uncertain, the data covered the largest population and reflected the most recent and accurate estimate of cancer burden in China.
MATERIALS AND METHODS
The National Central Cancer Registry (NCCR) of China is in charge of the collection and evaluation of data from population-based cancer registries and the publication of cancer incidence and mortality rates. Local cancer registries were established for the purpose of cancer prevention programs, especially in cities and counties with high socio-economical status and better medical resources. Therefore, the national cancer registries do not cover a representative sample of the whole Chinese population.
In 2006, 49 cancer registries of 21 cities and 28 counties in 19 provinces have reported cancer registration data. Newly diagnosed cancer cases in 2006 were reported from hospitals, community health centers, centers of township medical insurance and the new rural cooperative medical systems. The death record database was linked and matched with cancer registration database to identify cancer deaths and to supplement missing cases. Demographic information was provided by local statistics bureaus.
The quality, comparability, completeness and validity of the cancer registration data were evaluated with the key criteria of proportion of morphological verification (MV%), percentage of cancer cases identified with death certification only (DCO%) and mortality to incidence ratio (MI). Based on the “Guideline of Chinese Cancer Registration” and the standard of data inclusion in “Cancer Incidence in Five Continents Volume IX”[5], we used MS-FoxPro, MS-Excel, and IARCcrgTools issued by IACRC and IACR to check and evaluate the data[6, 7]. Data from 34 cancer registries were accepted as national pooled data for annual report (Table 1). Data on cancer sites were coded using ICD-10 and ICD-O-3, and stratified by sex and age retrieved from the database. Crude, site, sex- and age-specific, age-standardized cancer incidence and mortality rates were calculated. The locations of the cancer registries were documented as either urban or rural.
Table 1. Population, number of new cases and deaths in 34 selected cancer registries in 2006.
| Registry | Location (Urban=1 Rural=2) | Population |
Cancer new cases |
Cancer death |
||||||
|---|---|---|---|---|---|---|---|---|---|---|
| Both sexes | Male | Female | Both sexes | Male | Female | Both sexes | Male | Female | ||
| Beijing | 1 | 7271915 | 3680515 | 3591400 | 18773 | 9748 | 9025 | 11289 | 6741 | 4548 |
| Shexian | 2 | 389687 | 202502 | 187185 | 1127 | 695 | 432 | 854 | 562 | 292 |
| Cixian | 2 | 614984 | 314372 | 300612 | 1799 | 1058 | 741 | 1360 | 829 | 531 |
| Yangcheng | 2 | 387276 | 196119 | 191157 | 1205 | 691 | 514 | 830 | 482 | 348 |
| Shenyang | 1 | 3457140 | 1718118 | 1739022 | 8390 | 4407 | 3983 | 6419 | 3835 | 2584 |
| Dalian | 1 | 2150818 | 1082540 | 1068278 | 7813 | 4249 | 3564 | 4030 | 2469 | 1561 |
| Anshan | 1 | 1464324 | 731631 | 732693 | 3924 | 1975 | 1949 | 2503 | 1491 | 1012 |
| Benxi | 1 | 961221 | 480358 | 480863 | 2195 | 1297 | 898 | 1556 | 1013 | 543 |
| Haerbin-daoli | 1 | 687501 | 336197 | 351304 | 1861 | 1025 | 836 | 958 | 587 | 371 |
| Haerbin-nangang | 1 | 1025636 | 516335 | 509301 | 2261 | 1206 | 1055 | 1448 | 882 | 566 |
| Shanghai | 1 | 6155216 | 3095815 | 3059401 | 23028 | 12012 | 11016 | 14202 | 8284 | 5918 |
| Jintan | 2 | 565848 | 272445 | 293403 | 1361 | 876 | 485 | 1108 | 727 | 381 |
| Suzhou | 1 | 6122760 | 3034113 | 3088647 | 16535 | 9776 | 6759 | 11388 | 7272 | 4116 |
| Qidong | 2 | 1126547 | 555880 | 570667 | 3365 | 2063 | 1302 | 2643 | 1719 | 924 |
| Haimen | 2 | 1024610 | 468396 | 556214 | 3206 | 1947 | 1259 | 2413 | 1570 | 843 |
| Huai’an | 1 | 1211086 | 624640 | 586446 | 2379 | 1439 | 940 | 1748 | 1070 | 678 |
| Jianhu | 2 | 805604 | 413617 | 391987 | 1965 | 1244 | 721 | 1533 | 984 | 549 |
| Dafeng | 2 | 729236 | 366806 | 362430 | 2101 | 1269 | 832 | 1568 | 957 | 611 |
| Yangzhong | 2 | 272046 | 134758 | 137288 | 1153 | 664 | 489 | 868 | 534 | 334 |
| Hangzhou | 1 | 6346572 | 3205971 | 3140601 | 16270 | 9152 | 7118 | 10572 | 6878 | 3694 |
| Jiaxing | 1 | 502585 | 251409 | 251176 | 1409 | 823 | 586 | 896 | 594 | 302 |
| Jiashan | 2 | 380812 | 189910 | 190902 | 1165 | 699 | 466 | 797 | 528 | 269 |
| Haining | 2 | 646141 | 320101 | 326040 | 1344 | 762 | 582 | 829 | 515 | 314 |
| Ma’anshan | 1 | 613867 | 315171 | 298696 | 991 | 575 | 416 | 748 | 505 | 243 |
| Changle | 2 | 662137 | 349033 | 313104 | 1291 | 814 | 477 | 833 | 599 | 234 |
| Linqu | 2 | 798485 | 405194 | 393291 | 1581 | 985 | 596 | 1355 | 860 | 495 |
| Feicheng | 2 | 736064 | 356308 | 379756 | 1776 | 1104 | 672 | 1431 | 888 | 543 |
| Linzhou | 2 | 1014170 | 518204 | 495966 | 2008 | 1136 | 872 | 1570 | 927 | 643 |
| Wuhan | 1 | 4733240 | 2445066 | 2288174 | 11791 | 6616 | 5175 | 6118 | 3914 | 2204 |
| Guangzhou | 1 | 3854227 | 1971090 | 1883137 | 12824 | 7127 | 5697 | 6190 | 4013 | 2177 |
| Sihui | 2 | 409467 | 211829 | 197638 | 602 | 403 | 199 | 440 | 311 | 129 |
| Zhongshan | 2 | 1415381 | 708166 | 707215 | 2829 | 1622 | 1207 | 2007 | 1333 | 674 |
| Fusui | 2 | 428208 | 227166 | 201042 | 572 | 430 | 142 | 482 | 370 | 112 |
| Yanting | 2 | 602511 | 313943 | 288568 | 2119 | 1305 | 814 | 1676 | 1032 | 644 |
| Total | 59567322 | 30013718 | 29553604 | 163013 | 91194 | 71819 | 104662 | 65275 | 39387 | |
RESULTS
The populations covered by the 34 cancer registries were 59,567,322 (30,013,718 males and 29,553,604 females), and 46,558,108 were in urban areas (78.16%) and 13,009,214 were in rural areas (21.84%). There were 163,013 new cancer cases reported in 2006, including 91,194 males and 71,819 females. A total of 104,662 cases died from cancer, among which 65,275 were males and 39,387 were females.
Crude incidence rate for the registration areas was 273.66 per 100,000. The age standardized rate based on Chinese population structure (National Census 1982) was 146.52 per 100,000, and the rate was 190.54 per 100,000 when adjusted by Segi’s population. Urban areas had higher cancer incidence rates (280.17 per 100,000) than rural areas (250.35 per 100,000). However, after adjusting by age, incidence rate of cancer in urban areas was lower than that in rural areas (Table 2). Lung cancer was the most common cancer with a crude rate of 49.70 per 100,000, followed by stomach cancer, colorectal cancer, liver cancer and breast cancer. The incident rate of lung cancer in men was also the highest (66.37 per 100,000) among all forms of cancer, followed by stomach cancer, liver cancer, colorectal cancer and esophageal cancer. The crude incidence rate of breast cancer in women was higher than that of other cancers (42.02 per 100,000). After adjusted by age, all incidence rates were decreased due to older age structures in these areas (Table 3).
Table 2. Cancer incidence in cancer registration areas in 2006.
| Area | Sex | New cases | Incidence rate (1/105) | Chinese age-adjusted rate (1/105) | World age-adjusted rate (1/105) | Accumulated rate 0-74 (%) |
|---|---|---|---|---|---|---|
| All areas | Both | 163013 | 273.66 | 146.52 | 190.54 | 21.99 |
| Male | 91194 | 303.84 | 166.84 | 221.02 | 25.63 | |
| Female | 71819 | 243.01 | 128.92 | 164.62 | 18.60 | |
| Urban | Both | 130444 | 280.17 | 144.65 | 187.59 | 21.39 |
| Male | 71427 | 304.09 | 159.97 | 211.75 | 24.26 | |
| Female | 59017 | 255.83 | 131.86 | 167.66 | 18.75 | |
| Rural | Both | 32569 | 250.35 | 156.70 | 205.20 | 24.77 |
| Male | 19767 | 302.95 | 198.08 | 262.23 | 31.73 | |
| Female | 12802 | 197.43 | 119.21 | 154.33 | 18.14 |
Table 3. Cancer incidence rate for major cancers in cancer registration areas in 2006.
| Cancer site | Both sexes |
Male |
Female |
|||||||||
|---|---|---|---|---|---|---|---|---|---|---|---|---|
| Incidence rate (1/105) | (%) | CASR (1/105) | WASR (1/105) | Incidenc rate (1/105) | (%) | CASR (1/105) | WASR (1/105) | Incidence rate (1/105) | (%) | CASR (1/105) | WASR (1/105) | |
| All sites | 273.66 | 100 | 146.52 | 190.54 | 303.84 | 100 | 166.84 | 221.02 | 243.01 | 100 | 128.92 | 164.62 |
| Lung | 49.70 | 18.16 | 24.71 | 33.41 | 66.37 | 21.84 | 34.73 | 47.25 | 32.77 | 13.48 | 15.50 | 20.89 |
| Stomach | 35.02 | 12.80 | 18.06 | 24.14 | 47.29 | 15.56 | 25.46 | 34.31 | 22.56 | 9.28 | 11.17 | 14.76 |
| Colorectal | 29.07 | 10.62 | 14.71 | 19.62 | 31.51 | 10.37 | 16.67 | 22.40 | 26.60 | 10.95 | 12.95 | 17.20 |
| Liver | 26.60 | 9.72 | 14.28 | 18.57 | 39.36 | 12.95 | 21.99 | 28.53 | 13.65 | 5.62 | 6.75 | 8.95 |
| Breast | - | - | - | - | - | - | - | - | 42.02 | 17.29 | 23.34 | 29.25 |
| Esophagus | 18.79 | 6.87 | 9.68 | 13.11 | 25.50 | 8.39 | 13.83 | 18.77 | 11.99 | 4.93 | 5.75 | 7.83 |
| Pancreas | 7.45 | 2.72 | 3.65 | 4.99 | 8.18 | 2.69 | 4.27 | 5.84 | 8.18 | 2.69 | 4.27 | 5.84 |
| Bladder | 6.85 | 2.50 | 3.33 | 4.54 | 10.27 | 3.38 | 5.30 | 7.27 | 10.27 | 3.38 | 5.30 | 7.27 |
| Lymphoma | 6.43 | 2.35 | 3.93 | 4.81 | 7.54 | 2.48 | 4.71 | 5.84 | 6.01 | 1.98 | 3.88 | 4.73 |
| Brain, CNS | 6.39 | 2.34 | 4.21 | 4.97 | 6.31 | 2.08 | 4.28 | 5.04 | 6.31 | 2.08 | 4.28 | 5.04 |
| Leukemia | 5.72 | 1.93 | 4.11 | 4.60 | 5.83 | 1.91 | 4.52 | 5.21 | 5.83 | 1.91 | 4.62 | 5.21 |
| Cervix | - | - | - | - | - | - | - | - | 10.30 | 4.24 | 6.07 | 7.20 |
| Ovary | - | - | - | - | - | - | - | - | 8.43 | 3.47 | 5.04 | 6.10 |
| Prostate | - | - | - | - | 9.11 | 3.00 | 4.24 | 6.20 | - | - | - | - |
The cancer pattern was differed in urban and rural areas. Lung cancer and colorectal cancer were more common in urban than in rural areas. However, the incidence rates of stomach, liver and esophagus cancers were higher in rural than in urban areas (Table 4).
Table 4. Cancer incidence rate for major cancers in urban and rural areas in 2006.
| Rank | Urban |
Rural |
||||||||||
|---|---|---|---|---|---|---|---|---|---|---|---|---|
| Male |
Female |
Male |
Female |
|||||||||
| Site | Incidence rate (1/105) | CASR (1/105) | Site | Incidence rate (1/105) | CASR (1/105) | Site | Incidence rate (1/105) | CASR (1/105) | Site | Incidence rate (1/105) | CASR (1/105) | |
| 1 | Lung | 69.96 | 34.89 | Breast | 49.08 | 26.42 | Stomach | 72.82 | 47.27 | Stomach | 34.02 | 19.75 |
| 2 | Stomach | 40.20 | 20.49 | Lung | 35.40 | 16.01 | Esophagus | 53.81 | 34.93 | Esophagus | 31.17 | 18.12 |
| 3 | Liver | 36.23 | 19.38 | Colon-rectum | 30.21 | 14.11 | Lung | 53.44 | 34.07 | Lung | 23.41 | 13.31 |
| 4 | Colon- rectum |
35.64 | 18.01 | Stomach | 19.34 | 9.21 | Liver | 50.62 | 33.15 | Liver | 18.52 | 10.95 |
| 5 | Esophagus | 17.63 | 9.01 | Liver | 12.28 | 5.76 | Colon- rectum |
16.61 | 10.66 | Breast | 16.89 | 10.64 |
| 6 | Bladder | 11.89 | 5.86 | Cervix | 10.42 | 6.04 | Nasopharynx | 6.15 | 4.13 | Colon- rectum |
13.76 | 7.98 |
| 7 | Prostate | 10.89 | 4.82 | Ovary | 9.72 | 5.64 | Pancreas | 5.43 | 3.43 | Cervix | 9.87 | 6.40 |
| 8 | Pancreas | 8.94 | 4.47 | Uterus | 9.49 | 5.15 | Leukemia | 5.18 | 4.24 | Uterus | 6.15 | 3.95 |
| 9 | Kidney | 8.50 | 4.56 | Thyroid | 9.09 | 5.79 | Brain, CNS | 5.10 | 3.74 | Brain, CNS | 5.17 | 3.66 |
| 10 | Lymphoma | 8.34 | 5.11 | Pancreas | 7.35 | 3.22 | Lymphoma | 4.64 | 3.28 | Pancreas | 4.47 | 2.45 |
Cancer incidence rate in age group 0-4 was higher than that in age group 5-14. Age-specific incidence rate of older age groups kept increasing till a peak appeared in age group 80-84 (Table 5, Figure 1).
Table 5. Age specific incidence rate in cancer registration areas in 2006 (1/105).
| Age group | All areas |
Urban |
Rural |
||||||
|---|---|---|---|---|---|---|---|---|---|
| Both sexes | Male | Female | Both sexes | Male | Female | Both sexes | Male | Female | |
| 0- | 20.17 | 25.49 | 14.32 | 27.62 | 35.85 | 18.66 | 4.98 | 4.69 | 5.29 |
| 1- | 13.39 | 14.33 | 12.35 | 16.59 | 17.64 | 15.44 | 6.35 | 7.18 | 5.39 |
| 5- | 6.85 | 7.44 | 6.19 | 8.25 | 9.05 | 7.36 | 3.70 | 3.85 | 3.52 |
| 10- | 9.33 | 9.85 | 8.76 | 10.98 | 11.69 | 10.21 | 5.71 | 5.84 | 5.57 |
| 15- | 12.31 | 12.18 | 12.44 | 12.89 | 12.46 | 13.34 | 10.46 | 11.30 | 9.55 |
| 20- | 16.88 | 14.07 | 19.87 | 17.77 | 14.32 | 21.49 | 12.95 | 12.88 | 13.02 |
| 25- | 28.45 | 22.17 | 34.90 | 30.79 | 23.00 | 38.90 | 20.30 | 19.20 | 21.39 |
| 30- | 47.88 | 35.83 | 60.00 | 52.71 | 37.31 | 68.36 | 32.95 | 31.17 | 34.69 |
| 35- | 86.61 | 69.94 | 103.46 | 87.48 | 65.91 | 109.44 | 83.52 | 84.48 | 82.57 |
| 40- | 156.90 | 130.64 | 184.37 | 157.14 | 123.75 | 192.34 | 155.85 | 160.45 | 151.20 |
| 45- | 241.70 | 223.10 | 260.98 | 247.39 | 216.43 | 279.68 | 217.63 | 251.82 | 183.13 |
| 50- | 384.21 | 396.45 | 371.80 | 371.05 | 368.25 | 373.90 | 442.32 | 521.99 | 362.61 |
| 55- | 542.86 | 611.12 | 473.77 | 506.21 | 551.05 | 460.91 | 699.95 | 867.63 | 529.14 |
| 60- | 688.40 | 844.50 | 536.01 | 643.80 | 773.17 | 519.37 | 867.38 | 1120.17 | 605.34 |
| 65- | 899.01 | 1114.34 | 696.55 | 872.65 | 1062.00 | 696.33 | 1010.57 | 1330.12 | 697.52 |
| 70- | 1256.91 | 1608.44 | 936.59 | 1230.86 | 1547.22 | 939.21 | 1385.21 | 1921.16 | 924.13 |
| 75- | 1538.14 | 2079.70 | 1079.74 | 1550.65 | 2067.88 | 1099.63 | 1479.15 | 2140.98 | 992.82 |
| 80- | 1609.27 | 2304.21 | 1110.15 | 1635.44 | 2315.87 | 1127.90 | 1489.44 | 2243.51 | 1035.59 |
| 85- | 1309.55 | 1979.63 | 939.24 | 1357.56 | 2027.02 | 969.48 | 1103.71 | 1738.07 | 820.51 |
Figure 1.
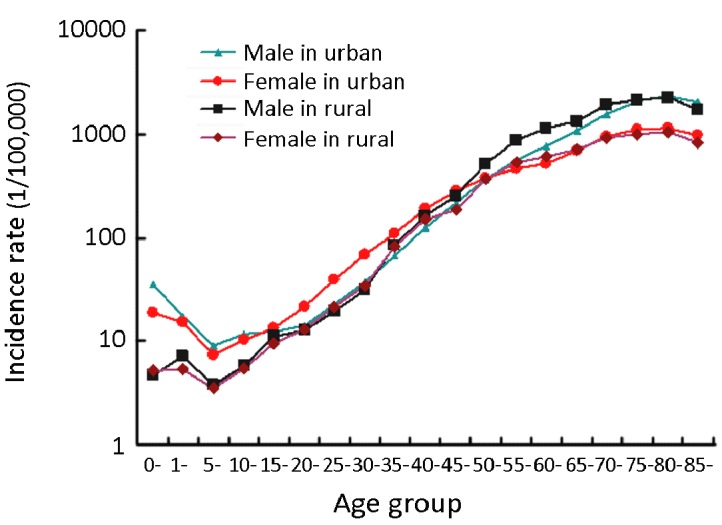
Age-specific cancer incidence rate in urban and rural areas, 2006.
Crude mortality rate in cancer registration areas was 175.70 per 100,000. The Chinese and world age standardized rates declined to 87.20 per 100,000 and 117.67/100,000, respectively. Cancer mortality rate in rural areas (189.07 per 100,000) was higher than that in urban areas (171.97 per 100,000), even though the incidence rate was lower in rural areas. However, after adjusted by age, the incidence rate in rural areas was higher than that in urban areas (Table 6).
Table 6. Cancer mortality in cancer registration areas in 2006.
| Area | Sex | Deaths | Mortality rate (1/105) | Chinese age-adjusted rate (1/105) | World age-adjusted rate (1/105) | Accumulated rate 0-74 (%) |
|---|---|---|---|---|---|---|
| All areas | Both | 104662 | 175.70 | 87.20 | 117.67 | 13.28 |
| Male | 65275 | 217.48 | 114.17 | 155.26 | 17.33 | |
| Female | 39387 | 133.27 | 62.46 | 84.06 | 9.42 | |
| Urban | Both | 80065 | 171.97 | 80.69 | 109.40 | 12.12 |
| Male | 49548 | 210.94 | 104.52 | 142.96 | 15.64 | |
| Female | 30517 | 132.28 | 58.82 | 79.42 | 8.76 | |
| Rural | Both | 24597 | 189.07 | 114.95 | 152.96 | 18.35 |
| Male | 15727 | 241.04 | 155.57 | 207.79 | 24.73 | |
| Female | 8870 | 136.79 | 78.07 | 104.03 | 12.28 |
Lung cancer had the highest mortality rate in cancer registration areas both for men and women with crude rates of 59.69 per 100,000 and 28.37 per 100,000, respectively. The following cancer types with high mortality rates in men were liver cancer, stomach cancer, esophageal cancer and colorectal cancer. In women, stomach cancer ranked second in mortality rate, followed by cancers of liver, colon-rectum, esophagus and breast (Table 7).
Table 7. Cancer mortality for major cancers in cancer registration areas in 2006.
| Cancer site | Both sexes |
Male |
Female |
|||||||||
|---|---|---|---|---|---|---|---|---|---|---|---|---|
| Mortality rate (1/105) | (%) | CASR (1/105) | WASR (1/105) | Mortality rate (1/105) | (%) | CASR (1/105) | WASR (1/105) | Mortality rate (1/105) | (%) | CASR (1/105) | WASR (1/105) | |
| All sites | 175.70 | 100 | 175.70 | 87.20 | 217.48 | 100 | 114.17 | 155.26 | 133.27 | 100 | 62.46 | 84.06 |
| Lung | 44.15 | 25.13 | 21.04 | 28.80 | 59.69 | 27.45 | 30.35 | 41.78 | 28.37 | 21.29 | 12.60 | 17.27 |
| Stomach | 26.08 | 14.84 | 12.62 | 17.29 | 34.82 | 16.01 | 17.92 | 24.76 | 17.21 | 12.91 | 7.79 | 10.60 |
| Liver | 25.83 | 14.70 | 13.45 | 17.72 | 37.34 | 17.17 | 20.43 | 26.85 | 14.14 | 10.61 | 6.68 | 8.97 |
| Esophagus | 15.26 | 8.69 | 7.46 | 10.30 | 20.71 | 9.52 | 10.82 | 14.97 | 9.73 | 7.30 | 4.33 | 6.04 |
| Colon rectum | 13.39 | 7.62 | 6.20 | 8.63 | 14.49 | 6.66 | 7.20 | 10.09 | 12.29 | 9.22 | 5.34 | 7.42 |
| Pancreas | 7.02 | 3.99 | 3.35 | 4.61 | 7.73 | 3.56 | 3.99 | 5.49 | 6.29 | 4.72 | 2.74 | 3.79 |
| Breast | - | - | - | - | - | - | - | - | 9.14 | 6.86 | 4.71 | 6.16 |
| Leukemia | 4.09 | 2.33 | 2.88 | 3.29 | 4.61 | 2.12 | 3.26 | 3.80 | 3.56 | 2.67 | 2.49 | 2.85 |
| Brain, CNS | 4.08 | 2.32 | 2.48 | 3.05 | 4.50 | 2.07 | 2.84 | 3.49 | 3.66 | 2.75 | 2.12 | 2.62 |
| Lymphoma | 3.63 | 2.07 | 1.91 | 2.48 | 4.40 | 2.02 | 2.40 | 3.17 | 2.28 | 1.71 | 1.19 | 1.51 |
| Ovary | - | - | - | - | - | - | - | - | 3.38 | 2.53 | 1.79 | 2.31 |
| Cervix | - | - | - | - | - | - | - | - | 2.53 | 1.90 | 1.31 | 1.66 |
Lung cancer also had the highest mortality rate in urban areas with crude mortality rates of 63.44 per 100,000 in men and 30.84 per 100,000 in women. Stomach cancer ranked top in mortality rates in rural areas (Table 8).
Table 8. Cancer mortality for major cancers in urban and rural areas in 2006.
| Rank | Urban |
Rural |
||||||||||
|---|---|---|---|---|---|---|---|---|---|---|---|---|
| Male |
Female |
Male |
Female |
|||||||||
| Site | Mortality (1/105) | CASR (1/105) | Site | Mortality (1/105) | CASR (1/105) | Site | Mortality (1/105) | CASR (1/105) | Site | Mortality (1/105) | CASR (1/105) | |
| 1 | Lung | 63.44 | 30.57 | Lung | 30.84 | 12.96 | Stomach | 55.22 | 35.23 | Stomach | 27.30 | 14.97 |
| 2 | Liver | 34.36 | 17.82 | Stomach | 14.37 | 6.14 | liver | 48.06 | 31.37 | Esophagus | 24.77 | 13.57 |
| 3 | Stomach | 29.15 | 14.00 | Colon-rectum | 13.65 | 5.65 | Lung | 46.19 | 29.16 | Lung | 19.59 | 10.95 |
| 4 | Colon-rectum | 16.12 | 7.58 | Liver | 13.14 | 5.81 | Esophagus | 43.96 | 28.14 | liver | 17.69 | 10.26 |
| 5 | Esophagus | 14.25 | 6.93 | Breast | 10.08 | 4.98 | colon-rectum | 8.60 | 5.37 | colon-rectum | 7.45 | 3.99 |
| 6 | Pancreas | 8.61 | 4.22 | Pancreas | 6.87 | 2.84 | Brian, CNS | 4.69 | 3.40 | Breast | 5.80 | 3.52 |
| 7 | Lymphoma | 4.76 | 2.48 | Esophagus | 5.51 | 2.20 | Pancreas | 4.58 | 2.91 | Pancreas | 4.26 | 2.31 |
| 8 | Leukemia | 4.70 | 3.20 | Gallbladder | 4.37 | 1.75 | Leukemia | 4.31 | 3.52 | Cervix | 3.70 | 2.28 |
| 9 | Brain, CNS | 4.44 | 2.70 | Ovary | 3.84 | 1.93 | Nasopharynx | 4.15 | 2.75 | Leukemia | 3.65 | 2.85 |
| 10 | Baldder | 4.00 | 1.71 | Brain, CNS | 3.71 | 2.08 | Lymphoma | 3.13 | 2.06 | Brian, CNS | 3.50 | 2.34 |
Cancer mortality rate in age group 0-4 was higher than that in age group 5-14. Age-specific mortality rate in older age groups kept increasing till a peak appeared in age group 80-84 (Table 9, Figure 2).
Table 9. Age specific mortality in cancer registration areas in 2006 (1/105).
| Age group | All areas |
Urban |
Rural |
||||||
|---|---|---|---|---|---|---|---|---|---|
| Both sexes | Male | Female | Both sexes | Male | Female | Both sexes | Male | Female | |
| 0- | 6.00 | 5.20 | 6.87 | 7.31 | 7.01 | 7.63 | 3.32 | 1.56 | 5.29 |
| 1- | 4.68 | 5.12 | 4.20 | 4.89 | 4.99 | 4.78 | 4.23 | 5.38 | 2.90 |
| 5- | 2.74 | 2.98 | 2.48 | 2.49 | 2.91 | 2.02 | 3.31 | 3.13 | 3.52 |
| 10- | 3.58 | 4.29 | 2.82 | 3.87 | 4.63 | 3.05 | 2.95 | 3.54 | 2.30 |
| 15- | 5.20 | 6.32 | 4.04 | 4.96 | 5.96 | 3.93 | 5.95 | 7.41 | 4.38 |
| 20- | 5.41 | 5.77 | 5.04 | 4.97 | 5.22 | 4.70 | 7.40 | 8.30 | 6.51 |
| 25- | 8.00 | 8.12 | 7.87 | 7.33 | 7.11 | 7.57 | 10.30 | 11.71 | 8.90 |
| 30- | 14.20 | 15.74 | 12.65 | 12.90 | 13.36 | 12.43 | 18.22 | 23.25 | 13.32 |
| 35- | 30.42 | 35.96 | 24.82 | 25.82 | 29.27 | 22.30 | 46.77 | 60.12 | 33.64 |
| 40- | 61.57 | 75.01 | 47.51 | 53.93 | 64.57 | 42.70 | 94.03 | 120.19 | 67.52 |
| 45- | 109.71 | 135.85 | 82.61 | 103.49 | 127.09 | 78.88 | 136.02 | 173.54 | 98.16 |
| 50- | 188.07 | 243.13 | 132.20 | 164.65 | 210.58 | 117.91 | 291.40 | 388.03 | 194.71 |
| 55- | 288.27 | 377.24 | 198.22 | 247.13 | 319.91 | 173.58 | 464.65 | 622.03 | 304.32 |
| 60- | 404.26 | 538.11 | 273.59 | 350.11 | 467.63 | 237.08 | 621.55 | 810.51 | 425.68 |
| 65- | 594.30 | 777.41 | 422.14 | 550.89 | 710.98 | 401.84 | 777.99 | 1051.32 | 510.22 |
| 70- | 934.95 | 1235.37 | 661.19 | 883.78 | 1151.90 | 636.60 | 1186.93 | 1661.81 | 778.39 |
| 75- | 1314.90 | 1783.64 | 918.13 | 1301.17 | 1740.43 | 918.15 | 1379.63 | 2007.76 | 918.05 |
| 80- | 1549.81 | 2182.33 | 1095.52 | 1569.15 | 2172.23 | 1119.30 | 1461.26 | 2234.94 | 995.62 |
| 85- | 1491.15 | 2195.55 | 1101.88 | 1557.75 | 2274.22 | 1142.42 | 1205.63 | 1794.56 | 942.72 |
Figure 2.
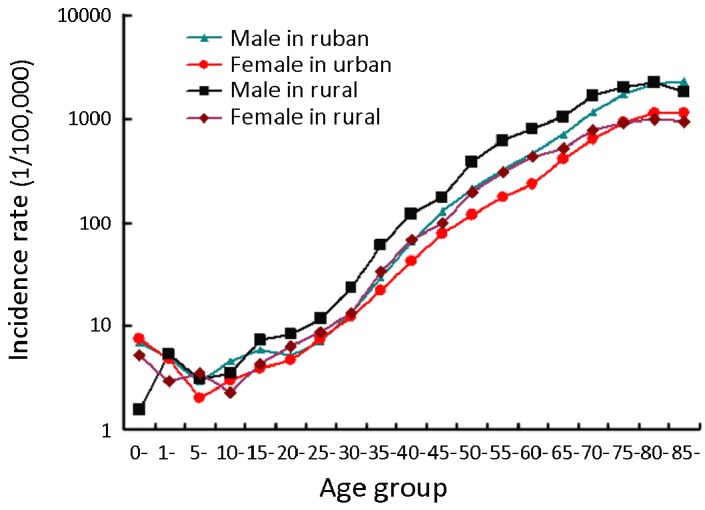
Age-specific cancer mortality in urban and rural areas, 2006.
DISCUSSION
The third national death survey carried out in 2006 showed that cancer was the second leading cause of death in China. In 2004-2005, the national mortality rate of cancer was 135.88 per 100,000, with 170.17 per 100,000 males and 99.97 per 100,000 females, respectively[1]. The cancer registration data collected from 34 cancer registries was reported to the National Central Cancer Registry for the calculation of cancer incidence and mortality rates in 2006. Cancer incidence rate in the registered areas was 258.39 per 100,000 in 2005 (286.34 per 100,000 in men and 229.69 per 100,000 in women), and the cancer mortality rate was 168.97 per 100,000 (206.81 per 100,000 in men and 130.10 per 100,000 in women). Although incidence and mortality rates of cancer have remained stable since 1990s, the number of new cases keeps increasing at present. With an aging population, cancer will remain a serious health issue in China[8].
Different cancer spectrum was found in urban and rural areas according to cancer incidence and mortality rate. Rural areas had relatively lower cancer incidence rates but higher mortality rates than urban areas. The worse cancer prognosis in rural areas is likely due to inefficient medical resources, much more cases at late stage of cancers, and poor cancer diagnosis and treatment conditions.
Lung cancer is the most common and the leading cause of cancer deaths in urban areas because of the high proportion of smokers in general population and the polluted environment in cities with the process of urbanization and industrialization[8, 9].
Both the crude and age standardized incidence rates of colorectal cancer are increasing in both genders and in all areas. It is becoming an important health problem, especially for citizens who move to big cities and therefore have dramatic changes in lifestyle and diet.
The mortality rate of breast cancer has declined in both urban and rural areas, even though the incidence rate has increased. Updated technology of diagnosis and treatment has contributed greatly to the improvement, and breast cancer screening has proven important for good prognosis. A breast cancer screening program provided by the Ministry of Finance was launched in 200 counties covering 31 provinces. X-ray mammography and B-ultrasound were used to screen women aged 35-69 who were at high-risks.
Cancers in upper-digestive organs such as esophagus, stomach and liver remain high risks in rural areas. The rates of esophagus and stomach cancers decreased gradually and the rate of liver cancer remained constant[1]. Screening programs founded by the Ministry of Health have covered these three cancer types, and with an increase in funding, the population coverage keeps increasing every year[10].
With financial support from national programs to improve the cancer registration, the information on cancer burden will be more complete, accurate, prompt and valid for cancer control policy-making.
Acknowledgements
The editorial committee would like to thank all staff from local cancer registries who have made a great contribution for providing and cultivating their cancer registration database.
REFERENCES
- 1.Ministry of Health. National death survey report 2004-2005. Beijing: Peking Union Medical College Publication House; 2008. [Google Scholar]
- 2.Lu FZ, Zhang SW, Chen YH, et al. Investigation analysis of cancer registration in China. China Cancer (in Chinese)2004; 13:134-41 [Google Scholar]
- 3.Zhang SW, Chen WQ, Kong LZ, et al. An annual report: Cancer incidence in 35 cancer registries China, 2003. China Cancer (in Chinese)2007; 16:494-507 [Google Scholar]
- 4.National Office for Cancer Prevention and Control. China Cancer Annual Report 2009. Beijing: Military Medical Sciences Press; 2010. [Google Scholar]
- 5.Curado MP, Edwards B, Shin HR, et al. Cancer Incidence in Five Continents, Vol IX. In: IARC Scientific Publications No. 160. Lyon: IARC Press, 2007. [Google Scholar]
- 6.Parkin DM, Chen VW, Ferlay J, et al. Comparability and Quality Control in Cancer Registration. In: IARC Technical Report No.19. Lyon: IARC Press, 1994.
- 7.Felay J, Burkhard C, Whelan S, et al. Check and Conversion Programs for Cancer Registries. In: IARC Technical Report No.42. Lyon: IARC Press, 2005.
- 8.Boyle P. World cancer report 2008. Lyon: IARC Press; 2008. [Google Scholar]
- 9.Ma GS, Kong LZ. The Nationwide Nutrition and Health Survey in China, 2002: Behavior and Lifestyle. Beijing: People’s Medical Publishing House; Beijing 2006. [Google Scholar]
- 10.Dong ZW, Qiao YL. The Practice and Discussion of Population-based Cancer Screening Program in China. China Cancer (in Chinese)2009; 18:686-9 [Google Scholar]