

Abstract
Osteocytes in vivo experience complex fluid shear flow patterns to activate mechanotransduction pathways. The actin and microtubule (MT) cytoskeletons have been shown to play an important role in the osteocyte’s biochemical response to fluid shear loading. The dynamic nature of physiologically relevant fluid flow profiles (i.e., 1 Hz oscillatory flow) impedes the ability to image and study both actin and MT cytoskeletons simultaneously in the same cell with high spatiotemporal resolution. To overcome these limitations, a multi-channel quasi-3D microscopy technique was developed to track the actin and MT networks simultaneously under steady and oscillatory flow. Cells displayed high intercellular variability and intracellular cytoskeletal variability in strain profiles. Shear Exz was the predominant strain in both steady and oscillatory flows in the form of viscoelastic creep and elastic oscillations, respectively. Dramatic differences were seen in oscillatory flow, however. The actin strains displayed an oscillatory strain profile more often than the MT networks in all the strains tested and had a higher peak-to-trough strain magnitude. Taken together, the actin networks are the more responsive cytoskeletal networks in osteocytes under oscillatory flow and may play a bigger role in mechanotransduction pathway activation and regulation.
Keywords: Osteocyte, Fluid Flow, Mechanotransduction, Cytoskeleton
Introduction
Osteocytes have been hypothesized as mechanosensors in bone that can directly regulate bone turnover and adaptation [1]. Mechanical load-induced oscillatory fluid flow through the lacuncanalicular system has been proposed to induce shear stresses over the cell body and processes of osteocytes in the pericellular space to activate biochemical pathways [2,3]. Most in vitro cell studies of osteocytes under oscillating flow have been performed on confluent, adherent osteocytes. Very few studies have considered the mechanical behavior of osteocytes at the single cell level [4,5,6]. However, osteoblasts are morphologically and biochemically distinct from osteocytes [7]. This highlights the need to characterize osteocyte mechanics under a range of physiologically relevant fluid shear flow patterns.
Previous in vitro fluid shear studies on primary osteocytes and osteocyte cell lines have focused on flat, spread osteocytes, but the in vivo cell body shape of osteocytes is ellipsoidal or spherical [8,9]. Osteocytes in this 3D configuration have different mechanical properties and biochemical responses than when flat and spread [10]. Additionally, the actin and microtubule networks in round osteocytes are distributed differently than in spread osteocytes [11,12]. Downstream cytoskeletal remodeling events in osteocytes were also affected by the usage of oscillatory flow versus steady flow [13,14]. A previous study in our laboratory studied how actin and microtubule networks deformed individually in osteocytes, but a high degree of intercellular variability was seen [5]. Mechanical comparisons between the two networks were limited due to this heterogeneity between individual cells. Studies in actin and MT polymer gel solutions have revealed composite-like behavior when the two networks interact under mechanical loading [15,16]. Therefore, it was of interest in this study to characterize the deformational behavior of the actin and MT networks simultaneously in an osteocytes’ cell body under a physiological level of fluid shear flow at the single cell level.
Limitations in temporal resolution of traditional raster-scanning 3D microscopy techniques (i.e., confocal or deconvolution) have hindered the ability to capture the 3D mechanical behavior of osteocytes because of the dynamic nature of oscillating flow (1 Hz) and the near-instantaneous mechanical responses of the cell. We developed a “quasi-3D” microscopy technique that was able to image a single cell in two orthogonal planes simultaneously while maintaining a high temporal resolution [5]. This technique allowed better spatiotemporal visualization of the dynamics of cellular deformation in 3D that would have been lost in the slower raster scanning techniques.
The viscoelastic deformational behavior between steady and oscillatory flow patterns in osteocytes will be compared using the actin and microtubule networks as measures of strain. By tracking both networks simultaneously using new developments in the quasi-3D microscopy technique, direct comparisons can now be made between the two networks, since the cytoskeletal analyses are paired and at a high enough temporal resolution to fully map out the oscillatory and steady loading profiles. The objectives of this study were to 1) simultaneously image in quasi-3D the actin and MT networks in osteocytes under steady and oscillatory fluid flow; 2) calculate the developed strains in the actin and MT networks under the different flow profiles, and 3) compare their behaviors within the same cell.
Methods
Quasi-3D Microscopy
The basic quasi-3D design is presented in a previous study from our laboratory [5]. In brief, an inverted microscope and an upright microscope with a 45° mirror in its lightpath are focused on a single cell in a rectangular tube with 60X objectives (Fig. 1A). These microscopes are independently yet simultaneously focused on two orthogonal planes of the same cell, dubbed “bottom-view” and “side-view.” For this current study, an additional functionality of simultaneous collection of up to 4 emission channels was added into the quasi-3D system. Two Quadview beamsplitters (Photometrics, Tucson, AZ) and custom-designed dichroics and excitation filters were used to visualize both the actin and microtubule networks simultaneously in quasi-3D. The multichannel quasi-3D system was designed to collect the emissions of the following common dyes: CFP, YFP, mCherry/mkate2, and DiR (emission filters of 470/28, 530/30, 641/75, and 809/81, respectively) (Semrock, Rochester, NY). To achieve simultaneous dye excitation, a multi-band excitation filter was added to the xenon lamp light source to excite CFP and mkate2 (430/25 and 570/40). A custom-made dichroic was placed in the microscopes to reflect the excitation bands and pass-through the emission bands to the beamsplitter. DU-885 EMCCD cameras (Andor, Belfast, Northern Ireland) on each of the microscopes captured the bottom- and side-view emissions.
Figure 1.
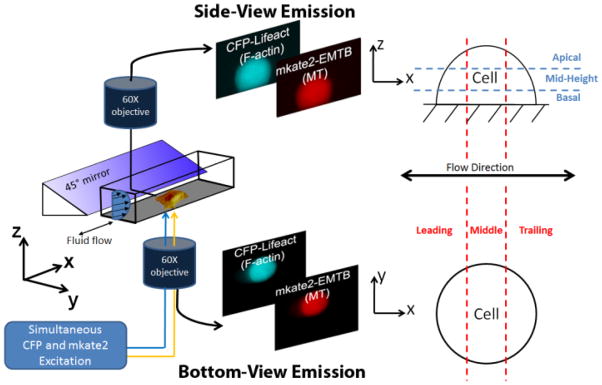
Schematic of the multi-channel quasi-3D microscopy technique to visualize the F-actin and MT networks simultaneously. The CFP and mkate2 fluorophores are excited with a dual-excitation filter. A beamsplitter in both microscopes separates the CFP and mkate2 emissions. Each microscope’s camera is synchronized to obtain images at the same timepoint. Definitions for subcellular regions in the two views are presented on the right.
Cell Culture
MLO-Y4 osteocyte-like cells (a gift from Dr. Lynda Bonewald of the University of Missouri-Kansas City) were grown in α-modified Eagle’s medium supplemented with 5% fetal bovine serum and 5% calf serum. The Lifeact live-cell F-actin probe [17] was cloned into a TagCFP fusion plasmid (Evrogen, Moscow, Russia) to allow visualization of F-actin dynamics in cyan. The EMTB (ensconsin microtubule binding domain) MT probe [18] was cloned into an mkate2 fusion plasmid to allow visualization of MT dynamics in red/far-red. The TagCFP and mkate2 fluorescent protein variants were chosen to minimize spectral bleed-through of the fluorophores to negligible levels during simultaneous acquisition. Cells were double-transfected with the TagCFP-Lifeact and mkate2-EMTB plasmids 24 hours prior to flow experiments using Fugene 6 (Roche Applied Science, Indiana, IN) according to manufacturer’s instructions.
Fluid Flow Experiments
24 hours after transfection, cells were trypsinized and plated on narrow glass slides for 45 minutes to ensure a fully attached, rounded cell shape. The glass slides were then placed into a square glass tube for imaging and flow. Hank’s Buffered Saline Solution was used as flow media. Steady, unidirectional fluid flow (n=8) at a wall shear stress of 10 dynes/cm2 was achieved by using a syringe pump (New Era Pump Systems, Wantagh, NY) and gas-tight syringe (Hamilton, Reno, NV).
Dynamic, oscillatory fluid flow (n=7) with a peak shear stress of 10 dynes/cm2 was provided by a custom-built oscillatory pump [19]. The flow profile was sinusoidal at a 1Hz frequency. Both flow types were applied to the flow chamber for 10 seconds. An individual cell was imaged in quasi-3D at a 10Hz frequency to fully map out the fluid flow profiles.
Image Analysis
All calculations were performed in MATLAB 7.8 (The MathWorks, Natick, MA). Intracellular displacement fields of the actin and MT networks for each cell were obtained identically for both bottom and side views according to a previously elaborated technique involving digital image correlation [5,20,21]. Displacement fields were first smoothed with a bilinear least squares filter [22] and then smoothed and differentiated using a thin-plate spline algorithm [23]. Finite Lagrangian strain fields were then calculated (three bottom-view strains: Eyy, bottom-view Exx, and Exy; and three side-view strains: Ezz, side-view Exx, and Exz). The absolute strain error on simulated rigid-body displacement actin and MT networks was 0.027 ± 0.0312 (%).
Strain Analysis
Strains were averaged in various subcellular regions (Fig. 1B). For steady flow, exponential constants for strains that displayed creep and creep recovery behavior were extracted from strain time course plots. Strain time course plots for each region were fit to an exponential function ε(t) = a + be−ct using least squares curve fitting. Plots that converged were considered to have creep-like behavior and the exponential constants were used in further analyses. Strains that displayed creep-like behavior in both networks were directly compared in paired statistical tests.
Strain time course plots in oscillatory flow were run through a high pass filter, and plots that displayed periodic ~1Hz behavior had the peaks and troughs extracted for further analyses.
Statistical Analysis
All statistical analyses were performed using NCSS 2007 software (NCSS LLC, Kaysville, UT). Strain values for the actin and MT networks within each cell at different times or in subcellular regions were compared in paired analyses within a cell. Most comparisons were determined to have non-normal distributions, so the non-parametric Wilcoxon-signed rank test was used. The significance level, α, was set at 0.05.
Results
Simultaneous Tracking of Actin and MT Networks under Fluid Flow
Using the dual-excitation filter and emission beamsplitter, the actin and microtubule networks in a single osteocyte were able to be imaged simultaneously (Fig. 2A). F-actin networks formed primarily cortical networks near the membrane with diffuse staining perinuclearly. MT networks were also perinuclear but were noticeably less prevalent near the plasma membrane. Both networks were excluded from the cell nucleus. F-actin was also visible in very short filopodia-like cellular processes in the basal periphery of the cell, given the short plating time. MT networks were not visible in this area. A high temporal resolution of 10Hz was maintained, allowing instantaneous strain deformations, i.e., at the onset of flow, to be measured in steady and oscillatory fluid flow profiles (Fig. 2, B & C).
Figure 2.

A) Sample image of the F-actin and microtubule networks of an MLO-Y4 osteocyte imaged simultaneously in two orthogonal planes (bottom and side views). B) Sample side-view whole-cell shear Exz strain trace for both cytoskeletons under steady flow or oscillatory flow. Both networks display creep and creep-recovery behaviors in steady flow. Both networks display sinusoidal shear strains that follow the oscillatory flow pattern. C) Sample side-view whole-cell shear Eyy strain trace for both cytoskeletons of a single osteocyte under steady or oscillatory flow that show different mechanical responses within the same cells between the two cytoskeletons. In these examples, only the actin network displays characteristic creep or oscillation.
Steady Flow Strain Comparisons
Actin and MT networks tended to behave with viscoelastic creep and creep-recovery behaviors in the actin and MT networks strains under steady flow, confirming previous results [5]. This behavior was observed in 65.6% of the subcellular shear Exz in both networks but was also present to a lesser degree in the normal Ezz and Exx strains at 50.5% of the time. Bottom-view Eyy exhibited creep behavior only 27.1% of the time. There was no statistically significant difference in the occurring frequency of creep behavior between the two networks. However, some cells displayed creep behavior in only one of the networks and not the other.
Additionally, high variability was seen in the heterogeneous distribution of the strains of the actin and MT networks within the same cell (Fig. 3A). Peak strains at the end of the flow period were averaged in the subcellular regions of the cell (Fig. 3B & C). All comparisons were performed using paired statistical tests between the actin and MT networks within each cell. In the apical region, MT Exz was higher than actin Exz (p<0.01) by an average of .0192. However, this difference was reversed in the basal region of the cell. Actin Exz was higher than MT Exz (p<0.05) by an average of 0.0201 in the basal region. Ezz normal strain was higher by an average of 0.0237 and 0.00797 in the leading (p<0.01) and middle regions of the cell (p<0.05).
Figure 3.

A) Strain contour plot of steady flow strains at the end of the loading period. The side-view strains of the actin and MT networks are presented from the same cell. Between the networks, the magnitudes of strains are different, and areas of tension and compression do not coincide in all areas, such as in Ezz in this cell. B) Mean of the paired differences within each cell between the Actin and MT Exz strains at different locations in the cell at the end of the steady flow loading period. In the apical region of the cell, Actin Exz was significantly lower than MT Exz (p<0.01). In the basal region of the cell, the Actin Exz was significantly greater than MT Exz (p<0.05). C) Mean of the paired differences within each cell between the Actin and MT Ezz strains at different locations in the cell at the end of the steady flow loading period. In the leading (p=0.05) and middle (p<0.05) regions of the cell, Actin Ezz was significantly higher than MT Ezz when comparing the paired differences between the two strains within each cell. Error bars represent standard deviation.
Subcellular regional strains that displayed creep behavior in both networks had their exponential time constants directly compared (Table 3.1). Creep was slower in the normal strains than in shear strain, as evidenced by the higher time constants to reach equilibrium. Ezz and side-view Exx strains, but not Exz, reached equilibrium in creep recovery faster than in creep (p<0.05). Creep recovery of side-view Exx, actin networks were able to reach equilibrium faster than MT networks (p<0.05).
Table 1.
Creep and creep recovery time constants for each network for the side-view strains.
| Strain | Creep Time Constant | Creep Recovery Time Constant | ||
|---|---|---|---|---|
|
| ||||
| Actin | MT | Actin | MT | |
| Ezz | 10.67±13.68† | 13.17±10.12† | 2.83±1.64† | 2.58±1.16† |
| Exx, side-view | 9.60±7.74† | 6.74±5.66† | 1.76±1.14*† | 2.31±0.68* † |
| Shear Exz | 4.45±2.83 | 3.77±1.54 | 3.58±1.74 | 3.82±1.33 |
significantly different from other network (p<.05).
significantly different between creep and recovery (p<.05)
Oscillatory Flow Strain Comparisons
The actin and MT networks had elastic-like behavior under oscillatory flow. Both networks had smaller strains than in steady flow, with heterogeneous strain patterns that oscillated with the loading profile (Fig. 4A). No residual strains were apparent after the end of flow (Fig. 2B).
Figure 4.
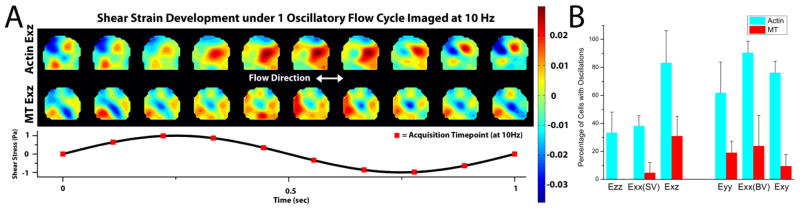
A) Actin and MT strain contour plots of the 5th cycle (of 10 total at 1Hz) of oscillatory flow. 10 images were taken during each cycle and are presented. Strains oscillate in magnitude following the oscillatory loading profile. The areas of oscillating strains in the two networks are distinct. B) Percentage of cells that displayed oscillatory behavior in each strain. Oscillatory strain behavior was readily apparent in the actin strains and in shear Exz. The percentages in the MT networks were always lower than in the actin networks. Error bars represent standard deviation.
Oscillations were more prevalent in the actin networks than in the MT networks (Fig. 4B). For Exz, oscillations occurred in 83.3% of the subcellular regions of the actin networks, but only in 30.9% of the subcellular regions in the MT networks. For the side-view normal strains (Ezz and side-view Exx), actin networks displayed oscillations in 35.7% of the subcellular regions, but in only 2.4% of the subcellular regions in the MT networks. However, oscillations in bottom-view normal strains (Eyy and bottom-view Exx) were more readily visible in both networks; actin and MT network bottom-view normal strains displayed oscillations in 76.2% and 21.4% of the subcellular regions, respectively.
When comparing shear Exz at the whole cell average level of cells that displayed oscillations in both networks, the average peak-to-trough amplitudes of the actin and MT networks were 0.94 ± .38 and 0.51 ± .25 (%), respectively, and the peak-to-trough amplitude was consistently higher in the actin networks than in the MT networks (p<0.05).
Discussion
In this study, a multichannel quasi-3D microscopy technique was implemented to directly compare the fluid shear-induced strains of the actin and MT networks within a cell. Steady and oscillatory flow patterns were used to analyze differences between the two flow patterns on the cytoskeletal networks. The advantage of the multichannel quasi-3D microscopy technique was in its ability to image the two cytoskeletal networks at a sufficiently high spatiotemporal resolution to map the intracellular strains under the dynamic oscillatory fluid flow profile. Dual labeling of the actin and MT cytoskeletons has been used in studies in other cell types [24,25], but this study used a truly simultaneous, rather than sequential, acquisition of the networks. Imaging a sinusoidal loading profile without undersampling generally requires at least 6 acquisition frames per period [26]. Here, we obtained full coverage of the 1 Hz loading frequency by imaging both cytoskeletal networks at 10 Hz. Heterogeneity at the single-cell level has been observed in many cytoskeletal and mechanical behavior studies [5,27,28], and this study observed that mechanical responses between the two networks were not always coupled spatially or temporally. Inter- and intracellular variability was high in this study, but the ability to pair the comparisons revealed novel observations.
Both steady and oscillatory flow produced measurable responses in shear strain Exz. Under steady flow, shear strain in both networks displayed viscoelastic behavior, while creep and creep recovery were prevalent in both networks. The differences in actin and MT peak strains may be partially explained by the spatially heterogeneous distributions of the two networks. The cortical actin networks next to the leading edge membrane experience fluid shear flow before the MT networks, as the bulk of the MT networks are more intracellular and further away from the membrane, and this shielding may explain the observed higher actin Ezz strains near the leading edge of flow. The higher observed shear Exz in the basal actin Exz may also be due to anchoring of actin at the focal adhesions at the cell-extracellular matrix interface, which the MT networks are not strongly coupled to.
The decrease in time constant between the creep from fluid shear loading and creep recovery from flow removal of both networks suggests an active cellular process that may be modulating the viscoelastic behavior of the cell and its cytoskeleton. Previous studies have demonstrated rapid reorganization of the cytoskeleton in response to flow [29], and molecular motors like myosin have been shown to be able to actively control cytoskeletal network viscoelasticity by allowing entangled cytoskeletal fibers to move more easily [30].
Under oscillatory flow, shear strain in both networks behaved elastically and followed the oscillatory loading pattern with no residual strains post-flow. The actin networks were the most responsive networks in frequency and magnitude of shear strains, suggesting that actin is an important link in mechanotransduction this physiologically relevant load level and pattern. The activation of actin-related signaling pathways but not MT-related pathways may be the link between the observed differences in steady and oscillatory flow in bone cells [13,19,31], as the MT networks are less responsive in oscillatory flow but similar in steady flow. Strain oscillations were more visible in bottom-view than side-view, emphasizing the three dimensional nature of the deformation. Neither view alone was sufficient to characterize the full behavior of osteocyte cell bodies under the two fluid flow profiles used in this study.
Dendritic processes have been hypothesized as mechanosensitive compartments in osteocytes [32,33]. Additional theoretical studies have mapped out the strain on the cytoskeleton in osteocyte processes in bone canaliculi [34]. The osteocyte cell body, situated in the bone lacunae, has been regarded as insensitive because it would experience lower strains in vivo. Recent in vitro and in vivo evidence have renewed interest in the role of the osteocyte cell body in mechanotransduction. For example, focal adhesions in the osteocyte cell body in vivo rearrange within the cell body depending on its mechanical environment, suggesting the cell body actively senses deformation and adapts to the loading [35]. When osteocytes were not allowed to spread to avoid non-in vivo artifacts such as thick, aligned stress fiber formation and nuclear flattening, elastic modulus decreased and mechanosensitivity increased [10]. In vitro experiments that recapitulate the in vivo shape and organization of osteocytes may prove crucial to understanding the interplay between the osteocyte processes and the osteocyte body.
In conclusion, we have developed a novel multi-channel quasi-3D technique to measure actin and MT network strains in a single cell. Mapping the link between flow stresses and biological signaling pathway activation requires an understanding of the mechanical responses of the cellular structures, including the cytoskeleton, membrane, and nucleus. Further studies in the downstream effects of actin network deformations and its spatial heterogeneity will help elucidate these questions.
Highlights.
Single-cell 3D osteocyte cytoskeletal mechanics were investigated.
Actin and microtubule networks had similar creep behavior under steady fluid flow.
The actin network deformed more than the microtubule network in oscillatory flow.
Actin may play a bigger role in osteocyte mechanotransduction pathways.
Acknowledgments
This work was supported by NIH NIAMS R21 AR059917 and RC1 AR058453. A.B. was supported by NIH NIAMS T32 AR059038.
Footnotes
Publisher's Disclaimer: This is a PDF file of an unedited manuscript that has been accepted for publication. As a service to our customers we are providing this early version of the manuscript. The manuscript will undergo copyediting, typesetting, and review of the resulting proof before it is published in its final citable form. Please note that during the production process errors may be discovered which could affect the content, and all legal disclaimers that apply to the journal pertain.
References
- 1.Tatsumi S, Ishii K, Amizuka N, Li M, Kobayashi T, Kohno K, Ito M, Takeshita S, Ikeda K. Targeted ablation of osteocytes induces osteoporosis with defective mechanotransduction. Cell Metab. 2007;5:464–475. doi: 10.1016/j.cmet.2007.05.001. [DOI] [PubMed] [Google Scholar]
- 2.Weinbaum S, Cowin SC, Zeng Y. A model for the excitation of osteocytes by mechanical loading-induced bone fluid shear stresses. Journal of biomechanics. 1994;27:339–360. doi: 10.1016/0021-9290(94)90010-8. [DOI] [PubMed] [Google Scholar]
- 3.Burger EH, Klein-Nulend J. Mechanotransduction in bone--role of the lacuno-canalicular network. [Review] [118 refs] FASEB Journal. 1999;13:S101–112. [PubMed] [Google Scholar]
- 4.Rath AL, Bonewald LF, Ling J, Jiang JX, Van Dyke ME, Nicolella DP. Correlation of cell strain in single osteocytes with intracellular calcium, but not intracellular nitric oxide, in response to fluid flow. J Biomech. 2010;43:1560–1564. doi: 10.1016/j.jbiomech.2010.01.030. [DOI] [PMC free article] [PubMed] [Google Scholar]
- 5.Baik AD, Lu XL, Qiu J, Huo B, Hillman EM, Dong C, Guo XE. Quasi-3D cytoskeletal dynamics of osteocytes under fluid flow. Biophys J. 2010;99:2812–2820. doi: 10.1016/j.bpj.2010.08.064. [DOI] [PMC free article] [PubMed] [Google Scholar]
- 6.Kwon RY, Jacobs CR. Time-dependent deformations in bone cells exposed to fluid flow in vitro: investigating the role of cellular deformation in fluid flow-induced signaling. J Biomech. 2007;40:3162–3168. doi: 10.1016/j.jbiomech.2007.04.003. [DOI] [PMC free article] [PubMed] [Google Scholar]
- 7.Bonewald LF, Johnson ML. Osteocytes, mechanosensing and Wnt signaling. Bone. 2008;42:606–615. doi: 10.1016/j.bone.2007.12.224. [DOI] [PMC free article] [PubMed] [Google Scholar]
- 8.Vatsa A, Breuls RG, Semeins CM, Salmon PL, Smit TH, Klein-Nulend J. Osteocyte morphology in fibula and calvaria --- is there a role for mechanosensing? Bone. 2008;43:452–458. doi: 10.1016/j.bone.2008.01.030. [DOI] [PubMed] [Google Scholar]
- 9.van Hove RP, Nolte PA, Vatsa A, Semeins CM, Salmon PL, Smit TH, Klein-Nulend J. Osteocyte morphology in human tibiae of different bone pathologies with different bone mineral density--is there a role for mechanosensing? Bone. 2009;45:321–329. doi: 10.1016/j.bone.2009.04.238. [DOI] [PubMed] [Google Scholar]
- 10.Bacabac RG, Mizuno D, Schmidt CF, MacKintosh FC, Van Loon JJ, Klein-Nulend J, Smit TH. Round versus flat: bone cell morphology, elasticity, and mechanosensing. J Biomech. 2008;41:1590–1598. doi: 10.1016/j.jbiomech.2008.01.031. [DOI] [PubMed] [Google Scholar]
- 11.Tanaka-Kamioka K, Kamioka H, Ris H, Lim SS. Osteocyte shape is dependent on actin filaments and osteocyte processes are unique actin-rich projections. J Bone Miner Res. 1998;13:1555–1568. doi: 10.1359/jbmr.1998.13.10.1555. [DOI] [PubMed] [Google Scholar]
- 12.Murshid SA, Kamioka H, Ishihara Y, Ando R, Sugawara Y, Takano-Yamamoto T. Actin and microtubule cytoskeletons of the processes of 3D-cultured MC3T3-E1 cells and osteocytes. J Bone Miner Metab. 2007;25:151–158. doi: 10.1007/s00774-006-0745-5. [DOI] [PubMed] [Google Scholar]
- 13.Ponik SM, Triplett JW, Pavalko FM. Osteoblasts and osteocytes respond differently to oscillatory and unidirectional fluid flow profiles. J Cell Biochem. 2007;100:794–807. doi: 10.1002/jcb.21089. [DOI] [PubMed] [Google Scholar]
- 14.Lu XL, Huo B, Park M, Guo XE. Calcium response in osteocytic networks under steady and oscillatory fluid flow. Bone. 2012;51:466–473. doi: 10.1016/j.bone.2012.05.021. [DOI] [PMC free article] [PubMed] [Google Scholar]
- 15.Pelletier V, Gal N, Fournier P, Kilfoil ML. Microrheology of microtubule solutions and actin-microtubule composite networks. Phys Rev Lett. 2009;102:188303. doi: 10.1103/PhysRevLett.102.188303. [DOI] [PubMed] [Google Scholar]
- 16.Lin YC, Koenderink GH, MacKintosh FC, Weitz DA. Viscoelastic properties of microtubule networks. Macromolecules. 2007;40:7714–7720. [Google Scholar]
- 17.Riedl J, Crevenna AH, Kessenbrock K, Yu JH, Neukirchen D, Bista M, Bradke F, Jenne D, Holak TA, Werb Z, Sixt M, Wedlich-Soldner R. Lifeact: a versatile marker to visualize F-actin. Nat Methods. 2008;5:605–607. doi: 10.1038/nmeth.1220. [DOI] [PMC free article] [PubMed] [Google Scholar]
- 18.Faire K, Waterman-Storer CM, Gruber D, Masson D, Salmon ED, Bulinski JC. E-MAP-115 (ensconsin) associates dynamically with microtubules in vivo and is not a physiological modulator of microtubule dynamics. J Cell Sci. 1999;112(Pt 23):4243–4255. doi: 10.1242/jcs.112.23.4243. [DOI] [PubMed] [Google Scholar]
- 19.Jacobs CR, Yellowley CE, Davis BR, Zhou Z, Cimbala JM, Donahue HJ. Differential effect of steady versus oscillating flow on bone cells. J Biomech. 1998;31:969–976. doi: 10.1016/s0021-9290(98)00114-6. [DOI] [PMC free article] [PubMed] [Google Scholar]
- 20.Sutton MA, Cheng MQ, Peters WH, Chao YJ, Mcneill SR. Application of an Optimized Digital Correlation Method to Planar Deformation Analysis. Image and Vision Computing. 1986;4:143–150. [Google Scholar]
- 21.Qiu J, Baik AD, Lu XL, Hillman EM, Zhuang Z, Guo XE. Theoretical Analysis of Novel Quasi-3D Microscopy of Cell Deformation. Cell Mol Bioeng. 2011;5:165–172. doi: 10.1007/s12195-011-0218-3. [DOI] [PMC free article] [PubMed] [Google Scholar]
- 22.Pan B, Xie HM, Guo ZQ, Hua T. Full-field strain measurement using a two-dimensional Savitzky-Golay digital differentiator in digital image correlation. Optical Engineering. 2007;46 [Google Scholar]
- 23.Wang CC, Deng JM, Ateshian GA, Hung CT. An automated approach for direct measurement of two-dimensional strain distributions within articular cartilage under unconfined compression. J Biomech Eng. 2002;124:557–567. doi: 10.1115/1.1503795. [DOI] [PubMed] [Google Scholar]
- 24.Sampathkumar A, Lindeboom JJ, Debolt S, Gutierrez R, Ehrhardt DW, Ketelaar T, Persson S. Live Cell Imaging Reveals Structural Associations between the Actin and Microtubule Cytoskeleton in Arabidopsis. Plant Cell. 2011;23:2302–2313. doi: 10.1105/tpc.111.087940. [DOI] [PMC free article] [PubMed] [Google Scholar]
- 25.Salmon WC, Adams MC, Waterman-Storer CM. Dual-wavelength fluorescent speckle microscopy reveals coupling of microtubule and actin movements in migrating cells. J Cell Biol. 2002;158:31–37. doi: 10.1083/jcb.200203022. [DOI] [PMC free article] [PubMed] [Google Scholar]
- 26.Wang N, Hu S, Butler JP. Imaging stress propagation in the cytoplasm of a living cell. Methods Cell Biol. 2007;83:179–198. doi: 10.1016/S0091-679X(07)83008-1. [DOI] [PubMed] [Google Scholar]
- 27.Jaasma MJ, Jackson WM, Keaveny TM. The effects of morphology, confluency, and phenotype on whole-cell mechanical behavior. Ann Biomed Eng. 2006;34:759–768. doi: 10.1007/s10439-005-9052-x. [DOI] [PubMed] [Google Scholar]
- 28.Dangaria JH, Butler PJ. Macrorheology and adaptive microrheology of endothelial cells subjected to fluid shear stress. Am J Physiol Cell Physiol. 2007;293:C1568–1575. doi: 10.1152/ajpcell.00193.2007. [DOI] [PMC free article] [PubMed] [Google Scholar]
- 29.Choi CK, Helmke BP. Short-Term Shear Stress Induces Rapid Actin Dynamics in Living Endothelial Cells. Mol Cell Biomech. 2008;5:247–258. [PMC free article] [PubMed] [Google Scholar]
- 30.Humphrey D, Duggan C, Saha D, Smith D, Kas J. Active fluidization of polymer networks through molecular motors. Nature. 2002;416:413–416. doi: 10.1038/416413a. [DOI] [PubMed] [Google Scholar]
- 31.Case N, Sen B, Thomas JA, Styner M, Xie Z, Jacobs CR, Rubin J. Steady and oscillatory fluid flows produce a similar osteogenic phenotype. Calcif Tissue Int. 2011;88:189–197. doi: 10.1007/s00223-010-9448-y. [DOI] [PMC free article] [PubMed] [Google Scholar]
- 32.Burra S, Nicolella DP, Francis WL, Freitas CJ, Mueschke NJ, Poole K, Jiang JX. Dendritic processes of osteocytes are mechanotransducers that induce the opening of hemichannels. Proc Natl Acad Sci U S A. 2010;107:13648–13653. doi: 10.1073/pnas.1009382107. [DOI] [PMC free article] [PubMed] [Google Scholar]
- 33.Adachi T, Aonuma Y, Tanaka M, Hojo M, Takano-Yamamoto T, Kamioka H. Calcium response in single osteocytes to locally applied mechanical stimulus: differences in cell process and cell body. J Biomech. 2009;42:1989–1995. doi: 10.1016/j.jbiomech.2009.04.034. [DOI] [PubMed] [Google Scholar]
- 34.Wang Y, McNamara LM, Schaffler MB, Weinbaum S. A model for the role of integrins in flow induced mechanotransduction in osteocytes. Proc Natl Acad Sci U S A. 2007;104:15941–15946. doi: 10.1073/pnas.0707246104. [DOI] [PMC free article] [PubMed] [Google Scholar]
- 35.Vatsa A, Semeins CM, Smit TH, Klein-Nulend J. Paxillin localisation in osteocytes--is it determined by the direction of loading? Biochem Biophys Res Commun. 2008;377:1019–1024. doi: 10.1016/j.bbrc.2007.12.174. [DOI] [PubMed] [Google Scholar]