

Abstract
Endocannabinoid tone has recently been implicated in a number of prevalent neuropsychiatric conditions. [11C]CURB is the first available positron emission tomography (PET) radiotracer for imaging fatty acid amide hydrolase (FAAH), the enzyme which metabolizes the prominent endocannabinoid anandamide. Here, we sought to determine the most suitable kinetic modeling approach for quantifying [11C]CURB that binds selectively to FAAH. Six healthy volunteers were scanned with arterial blood sampling for 90 minutes. Kinetic parameters were estimated regionally using a one-tissue compartment model (TCM), a 2-TCM with and without irreversible trapping, and an irreversible 3-TCM. The 2-TCM with irreversible trapping provided the best identifiability of PET outcome measures among the approaches studied (coefficient of variation (COV) of the net influx constant Ki and the composite parameter λk3 (λ=K1/k2) <5%, and COV(k3)<10%). Reducing scan time to 60 minutes did not compromise the identifiability of rate constants. Arterial spin labeling measures of regional cerebral blood flow were only slightly correlated with Ki, but not with k3 or λk3. Our data suggest that λk3 is sensitive to changes in FAAH activity, therefore, optimal for PET quantification of FAAH activities with [11C]CURB. Simulations showed that [11C]CURB binding in healthy subjects is far from a flow-limited uptake.
Keywords: [11C]CURB, endocannabinoid, FAAH, fatty acid amide hydrolase, kinetic modeling, PET, positron emission tomography
Introduction
Fatty acid amide hydrolase (FAAH; EC3.5.1.99) is the primary metabolizing enzyme responsible for terminating the action of the major endocannabinoid anandamide (N-arachidonoyl-ethanolamine) and other fatty acid amides (e.g., oleoylethanolamide and palmitoylethanolamide). As such, FAAH sets the tone for endocannabinoid signaling at the type 1 and type 2 cannabinoid receptors and therefore modulates what is believed to be a range of human behaviors and processes including motor, pain, inflammation, pregnancy, appetite, mood, cognition, and addiction. Given the presumed role of this enzyme in a variety of human disorders, FAAH inhibitors have been avidly pursued as therapeutic targets and several attempts have been made to develop a positron emission tomography (PET) radiotracer to measure FAAH activity in vivo. In this regard, a number of highly specific and potent FAAH inhibitors have been discovered, including the prototypical carbamate inhibitor URB597, which have provided the basis for development of suitable radiotracers for PET imaging of FAAH. We recently reported1, 2 the radiolabeling of a close analog of URB597, 6-hydroxy-[1,1′-biphenyl]-3-yl cyclohexylcarbamate (URB694) using a novel [11C]-CO2 fixation technique yielding [11C-carbonyl]-URB694, that is, [11C]CURB.
Our preclinical studies2 show that (1) regional brain uptake of [11C]CURB corresponds with the known distribution of FAAH in rat brain, specifically greater uptake is noted in cerebral cortex, cerebellum, and hippocampus with lowest uptake in the FAAH poor hypothalamus region; (2) administration of the unlabeled FAAH inhibitors URB694 and URB597 decreases brain uptake of [11C]CURB in a dose-dependent manner; (3) binding of the radiotracer in the brain is irreversible based on chromatographic analyses of the fate of the radiolabel; and (4) the metabolites in blood, more polar than the parent compound, are unlikely to cross the blood–brain barrier.
In light of these promising results, we evaluated the ability of [11C]CURB to quantify FAAH in the human brain. We sought to determine which compartment model best describes the brain uptake. We analyzed the identifiability of the parameters that can be used to quantify FAAH and their stability with varying regional blood flow. The convergence of the parameters as a function of the scan's length was determined.
Materials and methods
Radiosynthesis of [11C]CURB
The radiosynthesis of [11C]CURB has been described earlier.2 The method utilizes a novel one-pot automated [11C]-CO2 fixation reaction to form [carbonyl-11C]-O-arylcarbamates at high specific activities and in radiochemical purities exceeding 97%.1, 3 The purified radiotracer was formulated for injection as a sterile, pyrogen-free solution in saline containing 0.5% Tween80 (Sigma-Aldrich, St Louis, MO, USA).
Human Subjects
Six healthy volunteers (three men and three women; age 19 to 53 years) participated in this study. All subjects were free of current medical and psychiatric illness based on Diagnostic and Statistical Manual of Mental Disorders (DSM-IV), medical and drug history, physical examination, 12-lead electrocardiogram, urinalysis (including drug screening), and blood tests (complete blood count and serum chemistry). This study was approved by the Research Ethics Board of CAMH and authorized by Health Canada. All subjects provided written informed consent after the procedures were fully explained to them.
Positron Emission Tomography Protocol
The PET scanning was performed using a 3D high resolution research tomograph (HRRT) brain tomograph (CPS/Siemens, Knoxville, TN, USA), which measures radioactivity in 207 slices with an interslice distance of 1.22 mm. The detectors of the HRRT are an LSO/LYSO phoswich detector, with each crystal element measuring 2 × 2 × 10 mm3.
In preparation for scanning, the participant's antecubital vein was cannulated for tracer injection and the radial artery in the opposite arm for blood sampling. A custom fitted thermoplastic mask was made for each subject and used with a head fixation system to reduce head movement. A transmission scan, measured using a single photon point source, 137Cs (t1/2=30.2 years, Eγ=662 keV) was acquired to correct the emission data for the attenuation of the emission photons through the head and support. After the transmission scan, [11C]CURB was infused intravenously over a 1-minute period at a constant rate using a Harvard infusion pump (Harvard Apparatus, Holliston, MA, USA). Data were acquired in list mode for 90 minutes following the injection of [11C]CURB.
Image Reconstruction and Motion Correction
The emission list mode data were rebinned into a series of 3D sinograms. The 3D sinograms were gap-filled, scatter corrected and Fourier rebinned into 2D sinograms. The images were reconstructed from the 2D sinograms using a 2D filtered-back projection algorithm, with an HANN filter at Nyquist cutoff frequency. The reconstructed image has 256 × 256 × 207 cubic voxels measuring 1.22 × 1.22 × 1.22 mm3 and the resulting reconstructed resolution is close to isotropic 4.4 mm, full width at half maximum in-plane and 4.5 mm full width at half maximum axially, averaged over measurements from the center of the transaxial field of view (FOV) to 10 cm off-center in 1.0-cm increments. The dynamic images were reconstructed into 28 time frames: The first frame was of variable length being dependent on the time between the start of acquisition and the arrival of [11C]CURB in the tomograph FOV. The subsequent frames were defined as 5 × 30 seconds, 1 × 45 seconds, 2 × 60 seconds, 1 × 90 seconds, 1 × 120 seconds, 1 × 210 seconds, and 16 × 300 seconds.
Head movement was corrected after the scan by realigning the frames of each subject using version 8 of the Statistical Parametric Mapping software (SPM8; Wellcome Trust Centre for Neuroimaging, London, UK).
Arterial Sampling of [11C]CURB in Plasma
Arterial samples were taken continuously at a rate 350 mL/h for the first 7.25 minutes after [11C]CURB injection and 150 mL/h for the next 15 minutes. The continuous early arterial blood radioactivity levels were counted using an automatic blood sampling system (ABSS) (Model PBS-101, Veenstra Instruments, The Netherlands). In addition, 4 to 10 mL manual samples were taken 3, 7, 12, 15, 20, 30, 45, 60, and 90 minutes after injection. An aliquot of each blood sample was taken to measure radioactivity concentration in total blood. The remaining blood was centrifuged (1,500 g, 5 minutes) and a plasma aliquot counted together with the total blood sample using a Packard Cobra II γ counter crosscalibrated with the PET system. The blood-to-plasma ratios were determined from the manual samples to correct the blood radioactivity time–activity curve (TAC) measured by automatic sampling and to generate the plasma radioactivity curve. A biexponential function was used to fit the blood-to-plasma ratios. The remaining volume of each manual plasma sample (except the one at 15 minutes) was used to determine the concentration of the parent radioligand and of its metabolites in plasma. Each plasma samples (1 to 5 mL) was spiked with 20% v/v of 50% aqueous acetic acid to disrupt plasma protein binding and applied to an Oasis HLB cartridge (Waters, 6 cc, 200 mg, 30 μ) preconditioned with ethanol (5 mL) and water (10 mL). The cartridge was then washed successively with 5 mL of 5% MeOH, and 5 mL of CH3CN/H2O+0.1 N ammonium formate (45/55′ v/v). The radioactivity in each of the three eluted fractions as well as the cartridge (containing only unmetabolized [11C]CURB) were counted in the γ counter to determine the percentage of unmetabolized parent compound in the plasma samples. The method was validated against an high performance liquid chromatography (HPLC) method of analysis4 (Supplementary Figure S8), which did not allow as rapid a throughput of plasma samples. A Hill function was used to fit the percentage of unmetabolized tracer.
Free Fraction
Arterial blood samples were collected from each subject before their PET scan. The whole blood was centrifuged and the plasma was then stored at −80°C and [11C]CURB binding to plasma proteins was later determined by the ultrafiltration method.5
Magnetic Resonance Image and Regions of Interest Delineation
For the anatomical delineation of regions of interest (ROIs), a brain magnetic resonance image (MRI) was acquired for each subject. The MR scans were performed on a Discovery MR750 3.0 T GE scanner (Milwaukee, WI, USA) equipped with an 8-channel headcoil. 2D axial proton density images were acquired as follows: fast spin echo imaging, echo time/repetition time/echo train length=MinFull/6 seconds/8, receiver BW±15.63 kHz, FOV=22 cm, 256 × 256 sampling matrix, slice thickness=2 mm, and a parallel imaging acceleration factor of 2. Cerebral blood flow (CBF) was measured using a new GE stock sequence. This new sequence uses 3D fast spin echo imaging with spiral readout combined with a pulsed continuous arterial spin labeling approach6 and background suppression.7 This new 3D GE ASL sequence helps generate robust, reproducible perfusion maps with high signal-to-noise ratio, reduced motion artifacts, and less distortion in high magnetic susceptibility regions. The CBF maps are produced with an in-plane resolution of 1.72 mm2 and 4 mm through plane resolution.
Regions of interest for the cerebellar cortex (hereafter referred to as cerebellum), caudate, putamen, thalamus and frontal, temporal, occipital, insular and anterior cingulate cortices were automatically generated based on individual proton density MR images using in-house imaging software, ROMI (see Rusjan et al8 for details).
Kinetic Analysis
Time–activity curves were analyzed as a function of the length of the scan with a set of compartmental models of increasing complexity. The models were compared based on the goodness of fit. An extensive description of the compartmental models and the definition of the rate constants K1, k2, …k6 can be found elsewhere.9 The models in order of complexity compared in this work were as follows: a one-tissue compartment model (1-TCM), 2-TCM with irreversible binding to the second compartment (2-TCMi, k4≡0), a 2-TCM, 3-TCM with a reversible compartment for nonspecific binding, and an irreversible for specific binding (3-TCMi, k4≡0). Additionally a graphical method (Patlak plot) was explored. Briefly, the 2-TCMi has three rate parameters:9, 10
where K1 describes the influx of [11C]CURB from plasma to the free and nonspecific compartment, k2 the efflux of the tracer from the free and nonspecific compartment to plasma, and k3 the transfer from the free and nonspecific compartment to the specifically bound compartment. λ is the equilibrium distribution volume of the ligand in the free and nonspecifically bound compartment, F is the perfusion or blood flow, PS is the permeability surface area product, E is the first pass extraction factor: E=1−e−PS/F using the Renkin–Crone model, fND is the tissue-free fraction, kon is the [11C]CURB-FAAH association rate constant, and Bavail is the available density of FAAH.
The parameters of interest to quantify specific binding were as follows: the composite parameter λk3, the rate constant k3, and the net influx constant Ki:
 |
Nonlinear Least-Square Fitting
Nonlinear fitting of the kinetic models were performed with the Levenberg–Marquardt algorithm using a trust-region implemented in the function lsqcurvefit() from the MATLAB optimization toolbox (v5.1) (Mathworks, Natick, MA, USA). The independent variables were the rate constants K1, k2, …k6 depending on the model employed. Each model configuration was implemented to account for the contribution of activity from the cerebral blood volume assuming that cerebral blood volume was 4% of the gray-matter tissue.11 The percent coefficient of variation (%COV=100% × SE/mean) was used to measure the identifiability of the kinetic variables. The standard error (SE) was estimated from the diagonal of the covariance matrix (cov) of the nonlinear least-square fitting as 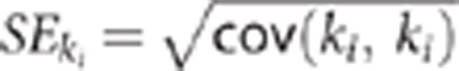 . A smaller percentage indicates better identifiability.
All data points were included in the fitting and brain data for each frame were weighted relative to other frames based on the trues Ti in the FOV during the frame i in the following way:12
 |
where tis and tie are the frame start and end time and dc the decay correction factor:  with λC=3.4 × 10⁻² per minute, that is, the decay constant of 11C.
Delay and Dispersion
The radioactivity in the blood measured by the ABSS, Cm(t), is delay and dispersed respect to the radioactivity in blood, Cb(t), that would be measured in the FOV, such that: Cm(t)=d(t)⊗Cb(t−δ) where ⊗ is the convolution operator, d(t) is the dispersion and δ is the delay. The dispersion was modeled by a monoexponential function:13 d(t)=(1/τ)e−t/τ where τ is the dispersion constant.
The dispersion constant τ was fixed to 5 seconds, a reasonable value estimated from previous experiments in our facility and compatible with the results of Boellaard et al14 using similar hardware with the pump rate at 300 mL/h. The deconvolution was performed iteratively using the Landweber method15 (30 iterations in the Fourier space):  , where
  is the fast Fourier transform of Cb(t) at iteration k,
  is the Fourier transform of d(t) and
  for each frequency ω.
For the estimation of δ, the initial rise of the TACs were approached by the whole brain TAC Hc(t) (the so-called head curve derived from the tomograph prompts coincidence rate minus the random coincidence rate). Hc(t) has the advantage over the TACs that it can be calculated on a second-by-second basis being practically noise free. δ was estimated by fitting the rise of the Hc(t) to its peak (∼95 seconds after radioactivity appears in the FOV) to a 1-TCM with Cb(t) as input function:
The value δ was fixed for each ROI.
Simulations
Monte Carlo simulations were performed to (1) assess the loss of identifiability in Ki, k3, and λk3 when k3 increases and decreases simulating a change in FAAH activity and (2) assess the effect of the regional CBF (rCBF) on Ki, k3, and λk3 as it is known that the quantification of irreversible radiotracers is susceptible to be affected by rCBF.
An ROI with average rate constant values (K1=0.275 mL/mL per minute, k2=0.101 per minute and k3=0.055 per minute) was simulated to assess the loss of identifiability in Ki, k3, and λk3 when k3 increases. To assess the effect of rCBF, the permeability surface area product PS (in equation (1)) was set at 34 mL per 100 mL per minute (the fitted values for PS), and λ to the average values across ROIs in our experiments: 2.723 mL/mL. One thousand simulations of data of 60 minutes were performed. Noise for the frame i at time ti was modeled with a Gaussian distribution with standard deviation (SDi) according to Logan:16
 |
where Ci is the noise-free simulated radioactivity concentration and SF is the scale factor that controls the level of noise. Setting SF=7, the mean percent noise contained in the noisy data was calculated as the ratio of mean SDi to the mean Ci17 resulting in a 5% noise level. This level predicts the average COVs measured for Ki, k3, and λk3 (cf. average values in the last row of Table 3 versus row 11 of the Supplementary Table S2). The COV reported in the simulation was measured from the SD rather than from the diagonal of the covariance matrix.
Statistics
Goodness of fit was evaluated using the Akaike Information Criterion (AIC):18
 |
and the Model Selection Criterion (MSC):19
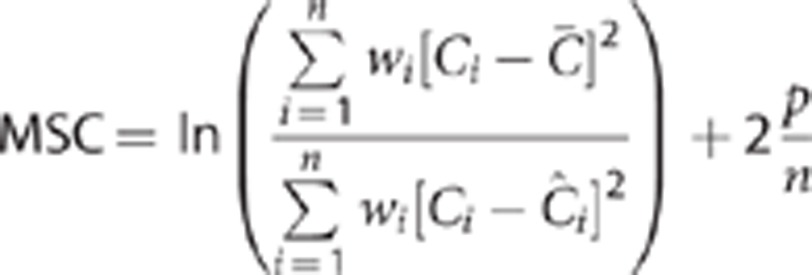 |
Where p is the number of fitted parameters, n is the number of frames, Ci is the activity data at time frame i,  is the mean activity over the TAC, and
  is the predicted activity data at time frame i. Lower AIC and higher MSC values were indicative of a better fit. Group data are expressed as mean±s.d.
Results
Safety Measures
On the basis of patient reports, electrocardiogram, blood pressure, heart rate, and SpO2, injection of the new radiotracer [11C]CURB caused no physiological effects during the 90 minutes of scan and the additional 2 hours of monitoring after the scan finished. There were no significant changes in either any of the next-day blood and urine tests or physical examination. The injected mass, dose, and specific activity of [11C]CURB are reported in Table 1.
Table 1. Subject and scan data.
| Subject | Gender | Age (years) | Weight (kg) | Act Inj (mCi) | Mass Inj (μg) | SA (mCi/μmol) | Gray-matter CBF (mL per 100 mg per minute) |
|---|---|---|---|---|---|---|---|
| 1 | M | 35 | 73 | 9.91 | 1.13 | 2,738.33 | 57±30 |
| 2 | F | 19 | 60 | 9.24 | 1.93 | 1,488.80 | 86±19 |
| 3 | F | 23 | 54 | 9.43 | 1.14 | 2,583.31 | 74±15 |
| 4 | M | 53 | 89 | 9.41 | 2.05 | 1,431.32 | 33±9 |
| 5 | F | 42 | 77 | 10.28 | 2.2 | 1,456.82 | 70±14 |
| 6 | M | 28 | 70 | 10.05 | 1.24 | 2,518.63 | 66±14 |
CBF, cerebral blood flow; SA, specific activity.
CBF is the measure using the technique of continuous arterial spin labeling and average in a region including cortical gray matter, striatal gray matter, and cerebellum gray matter.
Plasma Analysis
The unmetabolized [11C]CURB in arterial plasma (Figure 1A) peaked at 14.2±2.0 standard uptake value (SUV) 84 seconds after the start of injection, declined to 2.2±0.7 SUV by 3 minutes and to 0.05±0.01 SUV at 90 minutes after injection.
Figure 1.

(A) Average (n=6) time evolution of radioactivity in blood and unmetabolized [11C]CURB in plasma. The inner plot shows details of the first 4 minutes after injection. (B) The average (n=6) percentage composition of plasma radioactivity over time is shown for [11C]CURB (circles) with a Hill function fitting the data.
Reversed-phase HPLC showed the presence of at least two radioactive metabolites of [11C]CURB (Supplementary Figure S9), which appeared quickly in plasma and later became the predominant components. Similar to the observation in rats,2 the radiometabolites eluted earlier than [11C]CURB, indicating that they were less lipophilic than the parent compound. The rate of metabolization was fast at the beginning then slowed down: 48% of the parent compound remained after 20 minutes, whereas at 90 minutes after injection there was still 37% of parent compound left (Figure 1B). A Hill function20 1−(atb)/(cb+tb) was used to interpolate the fraction of radioactivity due to parent compound in plasma at time t after injection (Pearson coefficient r>0.988). The average values for the coefficients were as follows: a=0.64±0.05, b=1.9±0.6, c=7.3±1.4.
The blood-to-plasma radioactivity concentration ratio decreased from 0.77±0.04 at 3 minutes to 0.64±0.05 at 60 minutes. At 90 minutes, the radioactivity concentrations were very low resulting in poor counting statistics. The blood-to-plasma ratio showed a value higher than that at 60 minutes with a high dispersion between subjects (0.8±0.3). A biexponential function was used to fit the ratio of blood-to-plasma ratio between 0 and 45 minutes. To create the input function, Cp(t), between 0 and 22 minutes the radioactivity in blood measured with the ABSS was divided with the fitted ratio and multiplied by the fitted fraction of unmetabolized radioligand in plasma. The rest of the input function from 22 to 90 minutes was created by fitting the product of the manual samples of radioactivity in plasma with fraction of unmetabolized radioligand in plasma between 12 and 60 minutes with a biexponential and extrapolated to 90 minutes. Thus, the manual sample after 90 minutes was neglected.
Free Fraction in Blood
The free fraction of [11C]CURB in plasma was estimated at 0.9%±0.2%.
Distribution of Radioactivity in Brain Regions
After [11C]CURB injection, all subjects showed radioactivity uptake in the brain. The TAC of each ROI showed a similar pattern (Figure 2), with a peak occurring during frames 6 or 7 (120 to 195 seconds after radioactivity arrived to the FOV) followed by a washout. Approximately 30 minutes after injection, the TACs remained flat or increased very slowly with time. Peak SUVs ranged from 4.3±0.8 and 4.2±0.6 in the putamen and thalamus, respectively, to 3.5±0.5 in the anterior cingulate cortex. SUV during the plateau of the TAC ranged with a similar rank order than the peak with putamen and thalamus (2.9±0.4 SUV and 2.8±0.4 SUV) having the greatest values and anterior cingulate cortex, the lowest (2.4±0.3 SUV). As expected from the known postmortem distribution of FAAH in the human brain,21 the distribution of activity was widespread and fairly uniform within the gray matter of cerebral cortices, cerebellum, basal ganglia, and thalamus (Supplementary Figure S1).
Figure 2.

Average time–activity curves (TACs) (SUV, standardized uptake value; n=6) in selected brain regions.
Kinetic Analysis
Table 2 presents the MSC values for the different TCMs and the statistical values of the differences (paired t-tests). The 1-TCM was insufficient to fit the TACs (see also Figure 3). At 60 minutes of scanning compared with 2-TCMi, more complex models (2-TCM, 3-TCMi) increased MSC in most of the brain regions but this did not reach statistical significance in any ROIs. With longer scanning, a 2-TCM (reversible specific compartment) became progressively better for cortical ROIs. At 90 minutes, the insular, temporal, and prefrontal cortices (P=0.008, P=0.005, and P=0.006, respectively) were better modeled by a 2-TCM than by the 2-TCMi; however, the identifiability of k4 was poor (COV>25%). Adding an extra compartment (3-TCMi) increased MSC, but it did not reach statistical significance in any ROI studied and the individual rate constant presented low identifiability. Similar conclusions can be drawn from AIC data (Supplementary Table S1). The fitting of the models in the prefrontal cortex and putamen for a single subject is shown in Figure 3.
Table 2. Goodness of fit (MSC) for compartment models with 60 and 90 minutes of data.
|
60 minutes |
90 minutes |
|||||||
|---|---|---|---|---|---|---|---|---|
| 1-TCM | 2-TCMi | 2-TCM | 3-TCMi | 1-TCM | 2-TCMi | 2-TCM | 3-TCMi | |
| Insular cortex | 1.76±0.17 | 4.09±0.13 | 4.27±0.26 | 4.58±0.52 | 1.32±0.18 | 3.85±0.213,6 | 4.13±0.243 | 4.42±0.476 |
| Occipital cortex | 1.72±0.16 | 4.76±0.30 | 4.73±0.35 | 4.93±0.83 | 1.27±0.17 | 4.48±0.35 | 4.64±0.33 | 4.74±0.53 |
| Cerebellar cortex | 1.91±0.10 | 4.73±0.33 | 4.86±0.56 | 4.98±0.82 | 1.44±0.16 | 4.46±0.33 | 4.66±0.46 | 4.85±0.72 |
| Temporal cortex | 1.74±0.21 | 4.69±0.36 | 4.88±0.40 | 5.38±0.77 | 1.28±0.22 | 4.44±0.324 | 4.70±0.354 | 5.24±0.67 |
| Prefrontal cortex | 1.69±0.18 | 4.71±0.54 | 4.76±0.44 | 5.21±1.00 | 1.24±0.19 | 4.40±0.475 | 4.68±0.435 | 4.96±0.62 |
| Caudate | 1.83±0.20 | 3.97±0.361 | 3.87±0.382 | 3.74±0.481,2 | 1.40±0.21 | 3.63±0.25 | 3.71±0.268 | 3.58±0.358 |
| Putamen | 1.79±0.20 | 4.53±0.39 | 4.56±0.39 | 4.55±0.53 | 1.29±0.19 | 4.28±0.37 | 4.38±0.36 | 4.42±0.48 |
| Thalamus | 1.91±0.14 | 3.91±0.38 | 3.99±0.35 | 4.01±0.47 | 1.47±0.20 | 3.65±0.41 | 3.82±0.34 | 3.91±0.45 |
| Ant. cingulate cortex | 1.79±0.20 | 4.16±0.23 | 4.28±0.32 | 4.41±0.36 | 1.32±0.24 | 3.78±0.137 | 4.03±0.28 | 4.13±0.297 |
MSC, Model Selection Criterion; TCM, tissue compartment model.
1-TCM, 2-TCM with irreversible binding to the second compartment (2-TCMi), 2-TCM, 3-TCM with a reversible compartment for nonspecific binding and an irreversible for specific binding (3-TCMi). The superscripts show significant paired t-test between MSC for different compartmental models: 1P=0.021, 2P=0.048, 3P=0.008, 4P=0.005, 5P=0.006, 6P=0.018, 7P=0.0381, 8P=0.039, 1-TCM versus 2-TCMi was different for all regions of interest (P<0.00001). The largest MSC value among the different models are identified as bold.
Figure 3.

Time–activity data and curve fitting for the prefrontal cortex and for the putamen for a single subject. TCM, tissue compartment model; 2-TCMi indicate the second compartment was irreversible. For the putamen, 2-TCM and 2-TCMi overlaps as the best fit for the 2-TCM was with k4=0.
Due to the low identifiability of the parameters in the 2-TCM and 3-TCMi, only the parameters of the 2-TCMi are presented in Table 3 together with the COV. Ki and λk3 presented excellent identifiability for all the ROIs at 60 and 90 minutes (COV(Ki)<2.4%, COV(λk3)<4.4%). The identifiability of k3 was equally good at both 90 minutes (5.4%<COV(k3)<8.6% and 60 minutes (5.9%<COV(k3)<9.8%). Among the brain regions examined, the differences in the parameters were small and within 20%, which is similar to the sample variation observed among the subjects. Finally, it should be noted that while λk3 correlates strongly well with Ki (r2=0.87, P<10−20), the correlation with k3 is weaker (r2=0.39, P<10−6) but still significant.
Table 3. Kinetic rate constants estimated with a 2-TCMi (irreversible trapping compartment) with 60 and 90 minutes of scan data.
|
60 minutes of data |
90 minutes of data |
||||||||||
|---|---|---|---|---|---|---|---|---|---|---|---|
| K1 | k2 | k3 | λk3 | Ki | K1 | k2 | k3 | λk3 | Ki | CBF | |
| mL per cm3 per minute | 1/min | 1/min | mL per cm3 per minute | mL per cm3 per minute | mL per cm3 per minute | 1/min | 1/min | mL per cm3 per minute | mL per cm3 per minute | mL per minute per 100 mL | |
| Insular cortex | 0.27±0.04 (3.1±0.4) | 0.11±0.01 (8.8±1.4) | 0.059±0.008 (7.6±1.1) | 0.150±0.021 (3.2±0.4) | 0.096±0.013 (2.2±0.2) | 0.27±0.04 (3.0±0.4) | 0.10±0.01 (8.3±1.5) | 0.053±0.007 (6.9±1.2) | 0.145±0.020 (2.9±0.5) | 0.094±0.012 (1.8±0.2) | 68±15 |
| Occipital cortex | 0.28±0.05 (2.7±0.3) | 0.11±0.01 (7.3±0.9) | 0.055±0.007 (6.4±0.8) | 0.138±0.022 (2.8±0.3) | 0.091±0.014 (1.7±0.3) | 0.27±0.05 (2.7±0.3) | 0.10±0.01 (7.0±1.0) | 0.051±0.007 (5.9±0.8) | 0.133±0.022 (2.5±0.4) | 0.088±0.014 (1.4±0.3) | 60±29 |
| Cerebellar cortex | 0.26±0.03 (2.4±0.3) | 0.10±0.01 (7.0±1.2) | 0.057±0.010 (6.2±1.0) | 0.157±0.029 (2.6±0.5) | 0.098±0.015 (1.7±0.4) | 0.26±0.03 (2.3±0.3) | 0.09±0.01 (6.7±1.2) | 0.052±0.009 (5.6±0.9) | 0.151±0.028 (2.4±0.4) | 0.096±0.014 (1.4±0.3) | 57±15 |
| Temporal cortex | 0.29±0.05 (2.7±0.6) | 0.11±0.02 (7.3±1.5) | 0.057±0.007 (6.4±1.1) | 0.151±0.026 (2.7±0.5) | 0.098±0.015 (1.7±0.4) | 0.28±0.05 (2.6±0.5) | 0.10±0.02 (7.0±1.2) | 0.052±0.007 (5.8±0.9) | 0.145±0.026 (2.5±0.4) | 0.095±0.015 (1.4±0.3) | 68±19 |
| Prefrontal cortex | 0.28±0.05 (2.5±0.6) | 0.11±0.01 (6.8±1.7) | 0.054±0.006 (6.0±1.4) | 0.135±0.026 (2.6±0.6) | 0.090±0.015 (1.8±0.4) | 0.27±0.05 (2.5±0.5) | 0.10±0.01 (6.4±1.4) | 0.049±0.006 (5.5±1.1) | 0.130±0.026 (2.4±0.5) | 0.087±0.015 (1.5±0.3) | 75±24 |
| Caudate | 0.26±0.04 (3.6±0.9) | 0.09±0.02 (10.3±3.2) | 0.049±0.007 (9.7±3.1) | 0.141±0.022 (4.3±1.2) | 0.092±0.012 (2.8±0.7) | 0.26±0.03 (3.4±0.7) | 0.09±0.01 (9.5±2.3) | 0.044±0.007 (8.5±2.0) | 0.135±0.022 (3.7±0.8) | 0.089±0.011 (2.4±0.4) | 61±14 |
| Putamen | 0.31±0.06 (2.6±0.7) | 0.10±0.02 (7.1±2.5) | 0.049±0.007 (6.7±2.2) | 0.155±0.027 (3.0±0.8) | 0.102±0.016 (2.1±0.5) | 0.30±0.05 (2.4±0.6) | 0.09±0.02 (6.5±2.0) | 0.046±0.007 (5.7±1.5) | 0.150±0.027 (2.5±0.6) | 0.100±0.016 (1.6±0.3) | 52±12 |
| Thalamus | 0.28±0.04 (3.5±0.7) | 0.09±0.01 (10.4±2.7) | 0.056±0.007 (9.3±2.2) | 0.168±0.027 (3.9±0.9) | 0.105±0.013 (2.7±0.5) | 0.28±0.04 (3.3±0.6) | 0.08±0.01 (9.7±2.4) | 0.049±0.006 (8.3±2.0) | 0.161±0.026 (3.5±0.8) | 0.101±0.013 (2.2±0.5) | 59±12 |
| Ant. cingulate cortex | 0.25±0.05 (3.3±0.4) | 0.10±0.02 (9.4±1.2) | 0.057±0.012 (8.2±0.9) | 0.138±0.022 (3.5±0.4) | 0.087±0.012 (2.2±0.5) | 0.24±0.05 (3.3±0.4) | 0.09±0.02 (9.2±1.5) | 0.052±0.010 (7.7±1.1) | 0.132±0.021 (3.2±0.3) | 0.085±0.012 (1.9±0.2) | 82±21 |
| Average | 0.275 (2.9) | 0.101 (8.3) | 0.055 (7.4) | 0.148 (3.2) | 0.096 (2.1) | 0.271 (2.8) | 0.094 (7.8) | 0.050 (6.6) | 0.142 (2.8) | 0.093 (1.7) | |
CBF, cerebral blood flow; TCM, tissue compartment model.
Between parentheses are coefficients of variation estimated from the diagonal of the covariance matrix of the fitting. Data are represented as mean±s.d. (n=6).
At 60 minutes, mean Ki, λk3, K1, k2, and k3 were on average 2.1%, 2.7%, 1%, 5%, and 7% higher than their final values at 90 minutes (Table 3; Supplementary Figure S2a). Further, the identifiabilities (%COV) at 60 minutes were practically the same as those at 90 minutes (Table 3; Supplementary Figure S2b). The between subject variability (s.d./mean values) at 60 minutes (on average across ROIs: 14%±3% for k3 and 17%±2% for λk3 and 14%±2% for Ki) were around 2% lower than those at 90 minutes.
Cerebral Blood Flow
The measured rCBF covered the range of normal values22 ranging from 33±9 (in a 53-year-old male) to 86±19 mL per 100 g per minute (in a 19-year-old female).
K1 measurements (6 subjects × 9 ROIs) correlated strongly with rCBF (F): Assuming that extraction (E) can be modeled by the Renkin–Crone formula: K1=FE=F(1−e−PS/F), E versus K1/F can be fitted from our data with a permeability surface area product PS=34 mL per 100 mL per minute (r2=0.697) (Supplementary Figure S7). This implies an extraction ranging from 30% for high rCBF to 65% for low rCBF. The ratio λ=K1/k2 was not dependent of rCBF (54 measurements (six subjects, nine ROIs): r2=0.12, P=0.38).
While Ki showed a significant, but weak, correlation with rCBF (Ki=0.029 × F+0.0734, r2=0.17, P=0.002 for 90 minutes of data; Ki=0.029 × F+0.0757, r2=0.16, P=0.002 for 60 minutes of data, 54 data points), k3 and λk3 did not show dependence on rCBF (k3: r2=0.02, P=0.3 for 90 minutes data, r2=0.01, P=0.42 for 60 minutes data; λk3: r2=0.05, P=0.1 for 90 minutes data, r2=0.04, P=0.12 for 60 minutes data). However, the correlation of Ki with rCBF was driven by one case (#4 in Table 1, 53 years, male) (Figure 4). When excluding this subject, no significant correlations were observed between Ki, λk3, or k3 and rCBF (all r2<0.01 and P>0.5).
Figure 4.

Ki versus regional cerebral blood flow (rCBF) (F), the nine points for each subject represent the different regions of interest (ROIs). LR, linear regression. w/o=without, w=with. Ki is the measure with 60 minutes of data.
Patlak Analysis
Patlak analysis assumes that the reversible compartment is in equilibrium with the tracer in plasma (i.e., for the 2-TCMi, CF+NS(t)/CP(t)=cte for t>tlinearization). This condition for [11C]CURB was visually identified at around 40 minutes of scanning. Applying Patlak analysis under nonequilibrium of the reversible compartment would result in a bias.23 Patlak plot (CT(t)/CP(t) versus ∫CP(t)dt/CP(t)) from our experiments visually became linear after the 15 minutes sample (when CF+NS(t)/CP(t) reaching the peak) but after the 60 minutes sample, the data points became noisier. Patlak analyses were performed with data from four different intervals: 30 to 60, 45 to 60, 30 to 90, and 45 to 90 minutes. Overall, Ki values estimated with Patlak correlated well with those from the 2-TCMi using data of 54 ROIs (six subjects, nine ROIs, both 60 and 90 minutes data) but presented an underestimation between 12% and 18%, with the best correlation obtained when Patlak model was applied in the interval of 30 to 60 minutes (Kipatlak=0.953 Ki2-TCMi−0.007, r2=0.86, P=1.0 × 10⁻²⁴, average bias −12% for 90 minutes data and Kipatlak=0.929 Ki2-TCMi−0.007, r2=0.83, P=1.0 × 10⁻²¹, average bias −14.5% for 60 minutes data).
Simulations
In the first set of simulations, we investigated the rate constants' bias and identifiability when k3 was changed. The superscript ‘0' was used to denominate the average value for the healthy subjects from Table 3 (K10=0.275 mL/mL per minute, k20=0.101 per minute and k30=0.055 per minute, λk30=0.15 mL/mL per minute and Ki0=0.096 mL/mL per minute). None of the parameters showed an important bias (<2%) induced by the level of noise considered in the range 0.1 × k30<k3<3 × k30 (Supplementary Figure S3). There was a reasonable linear dependence of Ki on k3 for k3<0.75 × k30 (Supplementary Figure S5). At higher k3 values, the sensitivity of Ki to changes in k3 started to decrease (e.g., the change from 1 × k30 to 1.25 × k30 (25%) produced a change in Ki of 15%).
The simulation showed that while the %COV (100 × s.d./mean) of k3 and λk3 had a ‘U' shape with a minimum for k3≈0.75 × k30, the %COV of Ki decreased when k3 was increased (Supplementary Figures S4 and S5). For lower values of k3, the %COV of Ki, k3, and λk3 became >10% when k3<0.2 × k30. On the other hand, the %COV of k3 and λk3 became >10% when k3>2 × k30, and k3>3 × k30, respectively. The %COV of Ki, which decreased in a monotone manner, was 1% for k3=3 × k30. Despite the excellent identifiability (low %COV) of Ki for very high values of k3 (e.g., k3>3 × k30), this is the situation where flow determined the uptake, that is, the rate-limiting step is the delivery of ligand to the tissue, and thus the sensitivity to changes in binding site density becomes minimal. Therefore, the goal of the second set of simulations was to study the effect of changes in blood flow on parameters. We compared the values of Ki, k3, and λk3 for an average healthy value of F=70 mL per 100 mL per minute with those for F=35 or 105 mL per 100 mL per minute using different magnitudes of k3. While k3 and λk3 did not show a bias (<2%) on rCBF in the range in which the previous simulation showed that they were identifiable (Supplementary Table S2; Supplementary Figure S6), Ki increased in a monotone manner and nonlinearly with rCBF in agreement with equation (4). The bias increased when k3 was higher. For k3=k30, Ki changed 12% from F=35 to 105 mL per 100 mL per minute.
Discussion
This work describes the first imaging study and quantification method of FAAH activity in the human brain.
Brain Uptake
After intravenous injection, [11C]CURB binds to nonspecific sites on plasma proteins and the free fraction of [11C]CURB was estimated at 0.9%±0.2%. This value is low. However, if the half-life of the dissociation from plasma proteins is fast compared with capillary transit time, net transport of radioligand from plasma to brain would result in a continuous dissociation of ligand from plasma proteins during the one second passage of blood through the capillaries.24 This hypothesis applies in this case since the brain uptake of [11C]CURB is high. The first pass extraction fraction estimated from Ki and the measurement of rCBF was between 30% and 65% depending on the rCBF. There have been several examples in the literature that showed high first pass extraction factor in spite of a low free fraction in plasma (e.g., raclopride,24 MePPEP (0.5%),25 and PE2I (3%).26 For other examples see Zoghbi et al.27).
The radioactivity concentration in all the gray-matter ROIs was relatively uniform in agreement with a previous postmortem study showing widespread distribution of FAAH immunoreactivity in the human brain.21 For that reason, the search for a reference region was discarded.
Compartmental Modeling
[11C]CURB is a ‘suicide' enzyme inhibitor that covalently labels the enzyme FAAH and homogenized brain extraction experiments in rats demonstrated unequivocally that [11C]CURB was irreversibly bound to FAAH.2 It was anticipated that the compartment model should include an irreversible trapping compartment. When 60 minutes of data were considered, more complex models than the 2-TCMi (three variables: K1, k2, and k3) did not significantly improve AIC and MSC; but when 90 minutes of data were taken into account, the goodness of fit for the 2-TCM showed a significant improvement for three of the nine ROIs: the temporal, prefrontal, and insular cortices. However, the extra variable (k4) in the 2-TCM was very poorly identified (COV>25%). The preference for a different model with a longer scanning time might suggest oversimplification of the 2-TCMi, but may result from the lower quality data after 60 minutes, that is, radioactivity counts in plasma at 90 minutes were approaching background levels, compromising the description of the input function between 60 and 90 minutes and from tissue heterogeneity in the cortical regions coming from partial volume effects and head motion during each temporal window for the longer frames at the end of the dynamic series. Note that the putamen due to its geometrical shape and location, if delineated conservatively, is the least susceptible to head motion and partial volume effects, has a better fit in the 2-TCMi.
In summary, because of [11C]CURB's known irreversibility and for practical reasons, the irreversible 2-TCM, 2-TCMi, is the preferred kinetic model for [11C]CURB. Data using the 90 minutes data from the cortical ROIs seem to indicate that this model might be oversimplified, but we have observed lower reliability in the longer data. More complex models than 2-TCMi did not show good identifiability in the variables. Based on the parameters, the optimal scan duration appears to be 60 minutes.
Influence of Blood Flow
It is known that for an irreversible radioligand, blood flow or transport rate across the plasma membrane may limit the net amount of tracer that is taken up by tissue. When the irreversible trapping rate of the ligand is too high, the rate-limiting step is the delivery of ligand to tissue, and thus the sensitivity to changes in binding site density, or in our case enzyme activity, is minimal (equation (4) when k3≫k2). The ratio k3/k2=0.55 for [11C]CURB in our sample is just above the value for optimal sensitivity to detect changes in binding density.10 Our simulations confirm that [11C]CURB is far from the ‘flow-limited' situation and it would require an increase of >100% of k3 to reach the point where sensitivity starts to decrease notably (k3≈k2).
At the other extreme, a very low value of k3 would not allow us to identify the irreversible compartment. The Monte Carlo simulations showed very good identifiabilty of Ki, k3, and λk3 even for values of k3 as low as 20% of the average healthy value. Additionally, the presence of unmetabolized [11C]CURB in plasma at the end of the scan indicated the radioligand was not totally bound to the target.
Comparisons of Parameters as Outcome Measures
The 2-TCMi gives three parameters to measure changes in FAAH activity (Bmax): Ki, λk3, and k3, which presented very good identifiability for the data analyzed in this work.
However, it is known28 that k3, the rate constant describing the trapping of the radioligand in the irreversible compartment correlates with k2, the rate constant describing the efflux from the free and nonspecific compartment to plasma. Our data confirm these correlations: the statistical correlation  (cov=covariance matrix of the non linear fittings). Thus, k3 would not be the most appropriate measure of FAAH activity.
From equation (4), Ki depends nonlinearly on k3 and rCBF(F). Our simulations showed that (1) for values of k3 higher than the average healthy subject (k3=0.055 per minute), Ki loses gradually linearity and sensitivity to changes in k3 (Supplementary Figure S5)and (2) changes in blood flow could confound changes in Ki: for a reasonable high limit of F=105 mL per 100 mL per minute or for the reasonable low limit of F=35 mL per 100 mL per minute, Ki could increase by 2.4% or decrease 8.2% with respect to an average healthy subject (F=70 mL per 100 mL per minute, k3=0.055 per minute) (Supplementary Table S2; Supplementary Figure S6). A decrease of 7% in Ki could correspond either to a decrease in average blood flow (70 mL per 100 mL per minute) to a very low level (35 mL per 100 mL per minute) or to a decrease of 10% in k3 and thus alert about using caution if Ki is used to quantify FAAH activity. Moreover, it would partially explain why the correlation of Ki with CBF was driven by a subject with atypically low CBF. It is known that males tend to have lower CBF than females and that CBF decreases with age.22 However, our atypical 53-year-old male subject had CBF roughly 30% below the normal for his age. Ki for this subject was actually 23% lower than the average of the others, rather than 10.5% estimated from equation (4). Excluding this atypical subject, Ki did not correlate with rCBF.
λk3 has been proposed as a parameter for the quantification of irreversible radioligands as it should be independent of rCBF, because it contains the ratio K1/k2, and also contains the ratio of the correlated parameters k2 and k3.29, 30 Our data showed that, K1/k2 and λk3 are independent of rCBF. The identifiability of λk3 measured and simulated (from a reduction of 80% to an increase of 100% in k3), and the convergence with the length of the scanning are excellent; therefore, λk3 should be the most sensitive and safe way to measure changes in FAAH activity.
Although λk3 did not correlate with rCBF even when the subject with atypically low CBF was included, λk3 showed a value for this subject 18% below the average for the rest, implying that probably the correlation of Ki with rCBF when all the subject are included is a consequence of the small sample size.
It is interesting to note that although neither k3 nor k2 converged to a scan-duration invariant value by 90 minutes (Supplementary Figure S2a), λk3 was practically constant between 60 and 90 minutes. λk3 can be written as K1(k3/k2), K1 is determined by the first part of the TAC and the value was practically independent from the length of the scan after 30 minutes. Due to the high correlation of k3 versus k2 (see above), the ratio k3/k2 was therefore constant from early times, explaining the temporal convergence of λk3.
Ki values from Patlak model correlated with Ki values from 2-TCMi but presented an important underestimation. This underestimation could be related to the violation of the assumption of Patlak model:23 The ratio of free and nonspecific compartment (a reversible compartment) to plasma seems to reach a plateau only after 40 minutes of scanning. To satisfy this assumption, only time points after this time should be considered, but the slope of the Patlak plot becomes affected by the noise of the late data points of the measurement between 60 and 90 minutes in both the TAC and especially in the input function. The Patlak model was run on the simulated data from a single subject arterial data (with and without noise), the underestimation of Ki was 7% for the interval 30 to 60 and decreased to 4% for the interval 45 to 60. This appears to support at least partially the above argument.
Further displacement studies will be necessary to confirm the association between changes in FAAH activity and those of k3, λk3, or Ki.
The experimental setup with the ABSS blood pump running at 350 mL/h for the first 7.25 minutes, showed a low constant of dispersion of 5 seconds. When the analysis was performed ignoring the dispersion completely, λk3 and Ki on average across the ROIs changed <1% and the identifiability is practically the same (%COV increased by 0.3% on average across ROIs for both rate constants).
We assume that the radioligand has been administered at tracer dose. The maximum dose given to a human subject was 0.03 μg/kg while the EC50 of CURB occupancy of FAAH in rats2 is 40 μg/kg. Were the concentration of FAAH in humans the same as rats, the radioligand occupancy would be 0.07% of available target density. However, even if the concentration of FAAH in humans were 70 times lower than in rats, the radioligand would occupy <5% of available target density, which is commonly accepted as a limit for tracer dose.
Conclusion
This work describes the first mapping of FAAH in human living brain. Binding of [11C]CURB in the healthy human brain can be well identified with an irreversible two-tissue compartment kinetic model using 60 minutes of scan data. λk3 appears to be the optimum parameter to quantify FAAH binding. The ratio k3/k2=0.55 is close enough to the optimum value to be sensitive to changes in FAAH activity and avoid the flow-limited uptake of an irreversible radioligand even with increase in k3 up to 100%. In addition, the study introduced complementary rCBF measurement with MRI arterial spin labeling as an effective method to assess the effect of rCBF on the estimation of [11C]CURB binding or any other irreversible radioligand.
Acknowledgments
The authors thank Peter M Bloomfield for experiments to study dispersion in the arterial line and several useful discussions.
The authors declare no conflict of interest.
Footnotes
Supplementary Information accompanies the paper on the Journal of Cerebral Blood Flow & Metabolism website (http://www.nature.com/jcbfm)
This project was supported by Canada Foundation for Innovation, and the Ontario Ministry of Research and Innovation.
Supplementary Material
References
- Wilson AA, Garcia A, Houle S, Sadovski O, Vasdev N. Synthesis and application of isocyanates radiolabeled with carbon-11. Chemistry (Weinheim an der Bergstrasse, Germany) 2011;17:259–264. doi: 10.1002/chem.201002345. [DOI] [PubMed] [Google Scholar]
- Wilson AA, Garcia A, Parkes J, Houle S, Tong J, Vasdev N. [11C]CURB: evaluation of a novel radiotracer for imaging fatty acid amide hydrolase by positron emission tomography. Nucl Med Biol. 2011;38:247–253. doi: 10.1016/j.nucmedbio.2010.08.001. [DOI] [PubMed] [Google Scholar]
- Wilson AA, Garcia A, Houle S, Vasdev N. Direct fixation of [11C]-CO2 by amines: formation of [11C-carbonyl]-methylcarbamates. Org Biomol Chem. 2010;8:428–432. doi: 10.1039/b916419g. [DOI] [PubMed] [Google Scholar]
- Hilton J, Yokoi F, Dannals RF, Ravert HT, Szabo Z, Wong DF. Column-switching HPLC for the analysis of plasma in PET imaging studies. Nucl Med Biol. 2000;27:627–630. doi: 10.1016/s0969-8051(00)00125-6. [DOI] [PubMed] [Google Scholar]
- Gandelman MS, Baldwin RM, Zoghbi SS, Zea-Ponce Y, Innis RB. Evaluation of ultrafiltration for the free-fraction determination of single photon emission computed tomography (SPECT) radiotracers: beta-CIT, IBF, and iomazenil. J Pharm Sci. 1994;83:1014–1019. doi: 10.1002/jps.2600830718. [DOI] [PubMed] [Google Scholar]
- Dai W, Garcia D, de Bazelaire C, Alsop DC. Continuous flow-driven inversion for arterial spin labeling using pulsed radio frequency and gradient fields. Magn Reson Med. 2008;60:1488–1497. doi: 10.1002/mrm.21790. [DOI] [PMC free article] [PubMed] [Google Scholar]
- Ye FQ, Frank JA, Weinberger DR, McLaughlin AC. Noise reduction in 3D perfusion imaging by attenuating the static signal in arterial spin tagging (ASSIST) Magn Reson Med. 2000;44:92–100. doi: 10.1002/1522-2594(200007)44:1<92::aid-mrm14>3.0.co;2-m. [DOI] [PubMed] [Google Scholar]
- Rusjan P, Mamo D, Ginovart N, Hussey D, Vitcu I, Yasuno F, et al. An automated method for the extraction of regional data from PET images. Psychiatry Res. 2006;147:79–89. doi: 10.1016/j.pscychresns.2006.01.011. [DOI] [PubMed] [Google Scholar]
- Koeppe RA, Holthoff VA, Frey KA, Kilbourn MR, Kuhl DE. Compartmental analysis of [11C]flumazenil kinetics for the estimation of ligand transport rate and receptor distribution using positron emission tomography. J Cereb Blood Flow Metab. 1991;11:735–744. doi: 10.1038/jcbfm.1991.130. [DOI] [PubMed] [Google Scholar]
- Koeppe RA, Frey KA, Snyder SE, Meyer P, Kilbourn MR, Kuhl DE. Kinetic modeling of N-[11C]methylpiperidin-4-yl propionate: alternatives for analysis of an irreversible positron emission tomography trace for measurement of acetylcholinesterase activity in human brain. J Cereb Blood Flow Metab. 1999;19:1150–1163. doi: 10.1097/00004647-199910000-00012. [DOI] [PubMed] [Google Scholar]
- Ito H, Kanno I, Kato C, Sasaki T, Ishii K, Ouchi Y, et al. Database of normal human cerebral blood flow, cerebral blood volume, cerebral oxygen extraction fraction and cerebral metabolic rate of oxygen measured by positron emission tomography with 15O-labelled carbon dioxide or water, carbon monoxide and oxygen: a multicentre study in Japan. Eur J Nucl Med Mol Imaging. 2004;31:635–643. doi: 10.1007/s00259-003-1430-8. [DOI] [PubMed] [Google Scholar]
- Yaqub M, Boellaard R, Kropholler MA, Lammertsma AA. Optimization algorithms and weighting factors for analysis of dynamic PET studies. Phys Med Biol. 2006;51:4217–4232. doi: 10.1088/0031-9155/51/17/007. [DOI] [PubMed] [Google Scholar]
- Iida H, Kanno I, Miura S, Murakami M, Takahashi K, Uemura K. Error analysis of a quantitative cerebral blood flow measurement using H215O autoradiography and positron emission tomography, with respect to the dispersion of the input function. J Cereb Blood Flow Metab. 1986;6:536–545. doi: 10.1038/jcbfm.1986.99. [DOI] [PubMed] [Google Scholar]
- Boellaard R, van Lingen A, van Balen SC, Hoving BG, Lammertsma AA. Characteristics of a new fully programmable blood sampling device for monitoring blood radioactivity during PET. Eur J Nucl Med. 2001;28:81–89. doi: 10.1007/s002590000405. [DOI] [PubMed] [Google Scholar]
- Landweber L. An iteration formula for Fredholm integral equations of the first kind. Am J Math. 1951;73:615–624. [Google Scholar]
- Logan J, Fowler JS, Volkow ND, Ding YS, Wang GJ, Alexoff DL. A strategy for removing the bias in the graphical analysis method. J Cereb Blood Flow Metab. 2001;21:307–320. doi: 10.1097/00004647-200103000-00014. [DOI] [PubMed] [Google Scholar]
- Ichise M, Toyama H, Innis RB, Carson RE. Strategies to improve neuroreceptor parameter estimation by linear regression analysis. J Cereb Blood Flow Metab. 2002;22:1271–1281. doi: 10.1097/01.WCB.0000038000.34930.4E. [DOI] [PubMed] [Google Scholar]
- Akaike H. A new look at the statistical model identification. IEEE Trans Automat Contr. 1974;19:716–723. [Google Scholar]
- MicroMath MicroMath Scientist Handbook Rev 7EEF Salt Lake City; 1995. 467pp. [Google Scholar]
- Gunn RN, Sargent PA, Bench CJ, Rabiner EA, Osman S, Pike VW, et al. Tracer kinetic modeling of the 5-HT1A receptor ligand [carbonyl-11C]WAY-100635 for PET. NeuroImage. 1998;8:426–440. doi: 10.1006/nimg.1998.0379. [DOI] [PubMed] [Google Scholar]
- Romero J, Hillard CJ, Calero M, Rabano A. Fatty acid amide hydrolase localization in the human central nervous system: an immunohistochemical study. Brain Res Mol Brain Res. 2002;100:85–93. doi: 10.1016/s0169-328x(02)00167-5. [DOI] [PubMed] [Google Scholar]
- Parkes LM, Rashid W, Chard DT, Tofts PS. Normal cerebral perfusion measurements using arterial spin labeling: reproducibility, stability, and age and gender effects. Magn Reson Med. 2004;51:736–743. doi: 10.1002/mrm.20023. [DOI] [PubMed] [Google Scholar]
- Yu DC, Huang SC, Barrio JR, Phelps ME. The assessment of the non-equilibrium effect in the ‘Patlak analysis' of FDOPA PET studies. Phys Med Biol. 1995;40:1243–1254. doi: 10.1088/0031-9155/40/7/007. [DOI] [PubMed] [Google Scholar]
- Farde L, Eriksson L, Blomquist G, Halldin C. Kinetic analysis of central [11C]raclopride binding to D2-dopamine receptors studied by PET—a comparison to the equilibrium analysis. J Cereb Blood Flow Metab. 1989;9:696–708. doi: 10.1038/jcbfm.1989.98. [DOI] [PubMed] [Google Scholar]
- Terry GE, Liow J-S, Zoghbi SS, Hirvonen J, Farris AG, Lerner A, et al. Quantitation of cannabinoid CB1 receptors in healthy human brain using positron emission tomography and an inverse agonist radioligand. NeuroImage. 2009;48:362–370. doi: 10.1016/j.neuroimage.2009.06.059. [DOI] [PMC free article] [PubMed] [Google Scholar]
- Hirvonen J, Johansson J, Teras M, Oikonen V, Lumme V, Virsu P, et al. Measurement of striatal and extrastriatal dopamine transporter binding with high-resolution PET and [11C]PE2I: quantitative modeling and test-retest reproducibility. J Cereb Blood Flow Metab. 2008;28:1059–1069. doi: 10.1038/sj.jcbfm.9600607. [DOI] [PubMed] [Google Scholar]
- Zoghbi SS, Anderson KB, Jenko KJ, Luckenbaugh DA, Innis RB, Pike VW. On quantitative relationships between drug-like compound lipophilicity and plasma free fraction in monkey and human. J Pharm Sci. 2012;101:1028–1039. doi: 10.1002/jps.22822. [DOI] [PMC free article] [PubMed] [Google Scholar]
- Fowler JS, Logan J, Wang GJ, Volkow ND, Telang F, Ding YS, et al. Comparison of the binding of the irreversible monoamine oxidase tracers, [11C]clorgyline and [11C]l-deprenyl in brain and peripheral organs in humans. Nucl Med Biol. 2004;31:313–319. doi: 10.1016/j.nucmedbio.2003.10.003. [DOI] [PubMed] [Google Scholar]
- Dewey SL, Logan J, Wolf AP, Brodie JD, Angrist B, Fowler JS, et al. Amphetamine induced decreases in [18F]-N-methylspiroperidol binding in the baboon brain using positron emission tomography (PET) Synapse. 1991;7:324–327. doi: 10.1002/syn.890070409. [DOI] [PubMed] [Google Scholar]
- Logan J, Dewey SL, Wolf AP, Fowler JS, Brodie JD, Angrist B, et al. Effects of endogenous dopamine on measures of [18F]N-methylspiroperidol binding in the basal ganglia: comparison of simulations and experimental results from PET studies in baboons. Synapse. 1991;9:195–207. doi: 10.1002/syn.890090306. [DOI] [PubMed] [Google Scholar]
Associated Data
This section collects any data citations, data availability statements, or supplementary materials included in this article.