

Abstract
Lyotropic phases of amphiphiles are a prototypical example of self-assemblies. Their structure is generally determined by amphiphile shape and their phase transitions are primarily governed by composition. In this paper, we demonstrate a new paradigm for membrane shape control where the electrostatic coupling of charged membranes to short DNA (sDNA), with tunable temperature-dependent end-to-end stacking interactions, enables switching between the inverted gyroid cubic structure (QIIG) and the inverted hexagonal phase (HIIC). We investigated the structural shape transitions induced in the QIIG phase upon complexation with a series of sDNAs (5, 11, 24, and 48 bp) with three types of end structure (“sticky” adenine (A)–thymine (T) (dAdT) overhangs, no overhang (blunt), and “nonsticky” dTdT overhangs) using synchrotron small-angle X-ray scattering. Very short 5 bp sDNA with dAdT overhangs and blunt ends induce coexistence of the QIIG and the HIIC phase, with the fraction of QIIG increasing with temperature. Phase coexistence for blunt 5 bp sDNA is observed from 27 °C to about 65 °C, where the HIIC phase disappears and the temperature dependence of the lattice spacing of the QIIG phase indicates that the sDNA duplexes melt into single strands. The only other sDNA for which melting is observed is 5 bp sDNA with dTdT overhangs, which forms the QIIG phase throughout the studied range of temperature (27 °C to 85.2 °C). The longer 11 bp sDNA forms coexisting QIIG and HIIC phases (with the fraction of QIIG again increasing with temperature) only for “nonsticky” dTdT overhangs, while dAdT overhangs and blunt ends exclusively template the HIIC phase. For 24 and 48 bp sDNAs the HIIC phase replaces the QIIG phase at all investigated temperatures, independent of sDNA end structure. Our work demonstrates how the combined effects of sDNA length and end structure (which determine the temperature-dependent stacking length) tune the phase behavior of the complexes. These findings are consistent with the hypothesis that sDNAs and sDNA stacks with lengths comparable to or larger than the cubic unit cell length disfavor the highly curved channels present in the QIIG phase, thus driving the QIIG-to-HIIC phase transition. As the temperature is increased, the breaking of stacks due to thermal fluctuations restores increasing percentages of the QIIG phase.
Introduction
Lyotropic phases of amphiphilic molecules are prototypical examples of self-assemblies. Generally, the shape of the amphiphile determines the phase and distinct self-assembled structure.1 Accordingly, amphiphiles with a cylindrical shape (i.e., with the headgroup area nearly equal to the tail area) tend to form lamellar bilayer structures; amphiphiles with an inverse cone shape (i.e., with the head group area smaller than the tail area) tend to assemble into inverse micellar structures (e.g., forming the inverted hexagonal HII phase at sufficient concentrations2); and cone-shaped amphiphiles usually assemble into spheroidal micellar structures. In terms of membrane elastic theory, the shape of the amphiphile molecule determines the spontaneous (i.e., preferred) curvature of the membrane C0 = 1/R0 (with R0 the spontaneous radius of curvature).1, 2 The elastic energy per unit area of a lipid membrane in terms of the membrane curvatures C1 = 1/R1 and C2 = 1/R2 (with R1, R2 the membrane radii), and the membrane bending (κ) and Gaussian (κG) elastic moduli is F/A = 0.5 κ (C − C0)2 + κG C1C2.3–5 Here, C = C1 + C2 is the mean curvature and C1C2 is the Gaussian curvature. The elastic moduli κ and κG can be related to the interactions between neighboring amphiphiles in the membrane.5 The first term in F/A is the cost of bending the membrane away from the preferred curvature C0. The second term in F/A describes membranes with either a negative Gaussian modulus κG < 0, which tend to form spherical shapes with positive Gaussian curvature C1C2 > 0, or a positive Gaussian modulus κG > 0, which will favor saddle-splay-shaped surfaces with C1C2 < 0. The latter include the surfaces of bicontinuous cubic phases.2, 4, 6 For large κ (compared to the thermal energy), switching between lipid phases with different curvature can be achieved by modifying the shape of the amphiphile, i.e., C0. This may be done by changing the composition of a mixture of amphiphiles, by altering the headgroup chemically, or by affecting its size otherwise, e.g., by changing the concentration of salts in the case of charged amphiphiles.
Self-organization is also one of the hallmarks of DNA, and DNA end-to-end interactions via directed, base-pairing interactions have been explored widely. For example, engineering of appropriate “sticky” (base-pairing) overhangs7 has enabled the fabrication of 2D and 3D DNA crystals8 with a rich variety of structures.9 Moreover, attractive end-to-end interactions exist even without base-pairing overhangs. Very short (6–20 base pairs (bp)), blunt DNA fragments stack end-to-end via hydrophobic interactions, forming 3D nematic and columnar liquid crystal (LC) phases.10 This nonspecific (sequence-independent) end-to-end interaction of DNA rods plays an important role in biology, e.g., in DNA hybridization and ligation. It also has recently been exploited to manufacture large nanostructures through the geometrically-controlled stacking of DNA helices.11 Attractive end-to-end interactions between DNA rods persist even in the presence of short noncomplementary (nonsticky) overhangs. Synchrotron small-angle X-ray scattering (SAXS) studies of the LC phase behavior of short DNAs confined between lipid bilayers revealed that while 10 nucleotides(nt)-long non-pairing oligo-deoxythymine (dT) overhangs suppress end-to-end stacking completely, 2 and 5 nt overhangs only do so partially.12 For example, 11 bp DNA with dTdT overhangs self-assemble end-to-end to form a novel 2D columnar N phase with finite-size columns, containing (on average) four DNA molecules.
Complexes of cationic liposomes (CLs) and DNA have attracted much attention, not only due to their applications in gene delivery13–16 and gene therapy,17–19 but also as model systems of self-assembly and confinement.12, 20, 21 CL–DNA complexes adopt a variety of structures. Examples are the common lamellar phase (a 2D smectic array of DNA within lipid bilayers22, 23) and the hexagonal24 and inverted hexagonal25 phases (with DNA embedded between hexagonally ordered, rodlike lipid micelles and intercalated in inverse cylindrical lipid micelles, respectively).
We used temperature-controlled synchrotron SAXS to study the phase behavior of complexes of sDNAs (5, 11, 24, and 48 bp) with varied ends (“sticky” dAdT, blunt, and “nonsticky” dTdT) with a lipid mixture of 85% glycerol monooleate (GMO, 1-monooleoyl-glycerol) and 15% DOTAP (“1,2 dioleoyl-3-trimethylammmonium propane”). This mixture forms the double-gyroid cubic phase (QIIG) in water.26 The QIIG phase consists of two intertwined but not interpenetrating water channels that are separated by a lipid bilayer surface (see Figure 1A). Complexation with sDNAs allowed us to change the phase behavior in accord with the rationale that long DNA and sDNA stacks induce the HIIC phase (cf. Figure 1A) to avoid having to conform to the highly curved channels of the QIIG phase. The length of sDNA stacks is governed by the interplay of attractive end-to-end interactions and the loss of orientational entropy for individual rods. The orientational entropy of sDNA rods decreases strongly as their length increases from less (5 bp) to much larger than (48 bp) the diameter of the water channels. Indeed, all sDNAs of 48 and 24 bp length (with low orientational entropy) formed the HIIC phase independent of temperature (27–85.2 °C), as did 11 bp sDNA (intermediate orientational entropy) with blunt and dAdT ends. Only 5 bp sDNA (high orientational entropy) with dTdT overhangs formed the QIIG, sDNA phase at all temperatures. For intermediate combinations of sDNA length and end structure (11 bp sDNA with dTdT ends, and 5 bp sDNA with blunt and dAdT ends), temperature reverses the QIIG, sDNA-to-HIIC phase transition as the gain in rotational entropy overrides the attractive end-to-end interactions that led to stacking and formation of the HIIC phase.
Figure 1.

Schematic depiction of the modulation of the phase behavior of DOTAP/GMO–sDNA complexes by sDNA stacking. A) Illustration of the two observed phases, the inverted hexagonal phase (HIIC, left)25 and the double-gyroid cubic phase (QIIG, sDNA, right), and the conditions for their formation.28, 32 Long sDNAs and sDNA stacks exceeding a critical length (LC) form complexes in the HIIC phase. The length of the sDNA stacks is controlled by temperature and end structure, which govern the end-to-end interactions. Decreasing the length below LC, by increasing the temperature or by weakening end-to-end interactions via tuning of the end structure, leads to formation of the QIIG, sDNA phase. B) Schematic representation of sDNA end-to-end interactions. Three types of end structure were investigated: pairing 3′-dAdT (top), blunt (middle), and nonpairing 3′-dTdT (bottom, red). In this system, all investigated end structures mediate attractive end-to-end interactions, with those resulting from dTdT ends being the weakest (see text for a more detailed discussion).
Our results demonstrate a novel means of controlling the phase behavior of charged amphiphiles, independent of changing the amphiphile shape or composition: addition of DNA exerts a templating effect on the lyotropic phase, which can be tuned by modifying the length and end structure of the DNA. If length and end structure of the DNA are judiciously chosen, this effect is reversible by temperature.
Experimental
Liposome Preparation
The lipids utilized in this study are commercially available (GMO: Nu-Check Prep; DOTAP: Avanti Polar Lipids) and were used as received. Liposomes were prepared by dissolving the lipid powders in chloroform:methanol (4:1, v/v) at the desired ratio (GMO:DOTAP = 85:15, mol:mol). The solvent was evaporated under a stream of nitrogen and then in a vacuum overnight. The lipid films were hydrated at 37 °C for 24 hours to achieve a final lipid concentration of 40 mM. The obtained dispersions were tip-sonicated (Vibra-cell, Sonics Materials) and stored at 4 °C.
DNA Preparation
Custom single-stranded oligodeoxynucleotides (sequences shown in Table S1 in the Supplementary Information) were purchased from Sigma-Genosys (Sigma Aldrich) as a HPLC-purified, desalted, and lyophilized film. The films were collected at the bottom of the vials by centrifugation in a table-top centrifuge and resuspended in 10 mM HEPES buffer (pH = 7.0) to ≈10 mg/mL. Concentrations were determined via UV/Vis absorption using a NanoDrop spectrophotometer (ND–1000, ThermoFisher Scientific). The double-stranded DNA molecules were prepared at a final concentration of 8 mg/mL by annealing equimolar amounts of complementary anti-sense and sense strands at 90 °C for 15 min, followed by slow cooling to room temperature.
DNA dehybridization calculations
We used the Nupack software package27 to determine the temperature-dependence of the dehybridization of the sDNAs. The calculated melting curves and a table of the resulting values for Tm are provided in the Supplementary Information.
Synchrotron Small-Angle X-ray Scattering
CL–DNA complexes were prepared by combining liposome and sDNA solutions in quartz capillaries, followed by centrifugation in a table-top centrifuge at 4 °C for 15 min to ensure mixing. All complexes were prepared at the isoelectric point (lipid/DNA charge ratio (ρ)=1). A total of 50 μg DNA was used per sample. After preparation, samples were stored at 4 °C. Synchrotron SAXS experiments were conducted at the Stanford Synchrotron Radiation Light-source, beamline 4-2. The 2D powder diffraction data was acquired on a MX-225 CCD detector (Rayonics) and radially averaged prior to integration using SAXSi (MATLAB based GUI, authored by Roy Beck). The lattice spacing of the GMO/DOTAP (85/15) lipid mixture is sensitive to hydration, increasing from 100 to 150 Å when the water content is raised from 20 to 40 wt%.26 Thus, all sample capillaries were first flame-sealed and the seals then covered with 5 min-epoxy glue to prevent water evaporation,. The effectiveness of this procedure is evident from the fact that aQ for the lipid mixture without DNA does not change with temperature (Figure 2B). Water evaporation during the synchrotron SAXS experiments is therefore not the cause of the decrease of lattice spacings observed for CL–sDNA complexes. This was further corroborated by measuring a few spacings twice, first during a heating cycle and second during the following cooling cycle.
Figure 2.
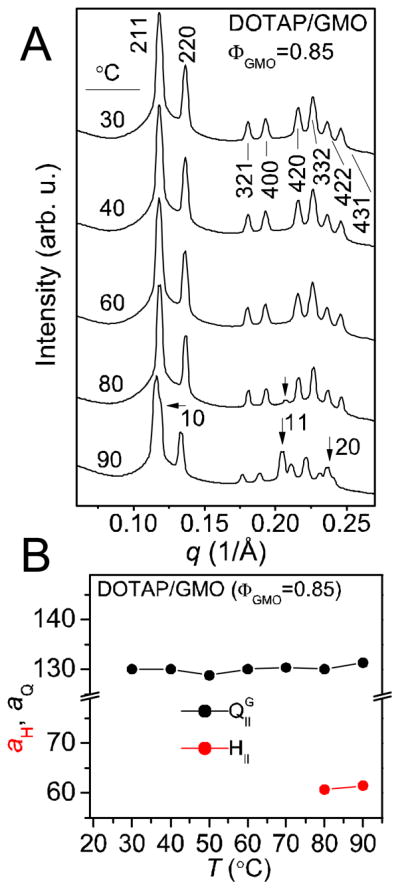
Synchrotron SAXS data, as a function of temperature, of a DOTAP/GMO (85:15, mol:mol) lipid mixture (without sDNA) at total lipid/water 60/40 (w/w). A) The SAXS scans reveal that the lipid mixture adopts the body-centered gyroid cubic structure (QIIG) with space group Ia3d up to T=80 °C. At this temperature the HII phase emerges (in coexistence with the QIIG phase) and the peaks characteristic for the HII phase are indicated by the black arrows. B) Lattice spacings of the HII (aH, red dots) and the QIIG (aQ, black dots) phases as a function of temperature.
Results and Discussion
We used temperature-controlled synchrotron SAXS to study the phase behavior of complexes of a lipid mixture of 85% GMO and 15% DOTAP with sDNAs (5, 11, 24, and 48 bp long) with varied ends (“sticky” dAdT, blunt, and “nonsticky” dTdT). Figure 1 summarizes our findings. Without DNA, the lipid mixture adopts the QIIG phase (Figure 1A, right).26 DNA rods longer than a critical length LC (of the order of the cubic lattice constant aQ; e.g., 48 bp sDNA) resist the strong bending necessary to fit into the highly curved water channels of the QIIG phase.
Consequently, they direct formation of the HIIC phase, which minimizes sDNA bending at the cost of forcing the lipid membranes to deviate from their preferred curvature (Figure 1A, left). For sDNAs of length < LC, additional factors come into play, and the adopted phase results from the competition of sDNA stacking energy and sDNA orientational entropy. The orientational entropy gained on stack disassembly is the largest for the very short 5 bp sDNAs. All three 5 bp sDNAs form the QIIG phase, and their end structure strongly affects the temperature of the phase transition. In the case of intermediate orientational entropy (11 bp sDNA), sDNA stacking dominates and the QIIG phase only forms when stacking is disfavored (“non-sticky” dTdT ends; cf. Figure 1B). In summary, reducing the length of sDNA, weakening the end-to-end interactions, and increasing the temperature all promote formation of the QIIG, sDNA phase. Not shown in Figure 1 is the effect of sDNA dehybridization, which we observed for 5 bp sDNAs with blunt ends and dTdT overhangs (see below).
The phase diagram of GMO in water displays a large region occupied by two inverted bicontinuous cubic phases: the QIIG phase (see Figure 1A) for lower water content, and the double diamond phase (QIID) for higher water content.28, 29 The QIIG phase also forms for a range of mixtures of GMO with the univalent cationic DOTAP,26 including the one used in this work: synchrotron SAXS scans (Figure 2A) of a mixture of 85% GMO and 15% DOTAP (at total lipid/water=60/40 (w/w), without sDNA) exhibit peaks that can be indexed exclusively to the QIIG phase up to a temperature of 70 °C. At 80 °C, [h k] reflections characteristic of an inverted hexagonal (HII) phase start to arise ([11]). The presence of an HII phase coexisting with the QIIG phase is even more evident at 90 °C, with readily visible [10], [11], and [20] peaks. The sample shows signs of minor radiation-induced degradation at this temperature, namely the slight splitting of the [220], [11], and [20] reflections. The lattice spacing of the QIIG phase (aQ) remains essentially constant at 130 Å, and that of the coexisting HII phase (aH) is 60 Å (Figure 2B).
Figure 3A shows synchrotron SAXS scans of isoelectric (lipid/sDNA charge ratio (ρ) = 1, as for all complexes in this study) complexes of the shortest (5 bp) sDNAs with the DOTAP/GMO mixture collected at 27 °C. Depending on the sDNA end structure, distinct SAXS patterns are observed, revealing two different supramolecular structures. The large number of sharp peaks (eight) observed for the sample containing 5 bp sDNA with dTdT overhangs (blue line, bottom) arises from a powder sample with large domains that perfectly indexes to a body-centered gyroid cubic structure with space group Ia3d, termed QIIG, sDNA in analogy to the corresponding CL–siRNA phase26, 30 (cf. also Figure 1A). The observed reflections [h k l] (as indicated in Figure 3A) are: [211], [220], [321], [400], [420], [332], [422], and [431], corresponding to a lattice spacing aQ = 2π√6/q211 = 141.3 Å (q211 = 0.109 Å−1). In contrast, complexes prepared from 5 bp sDNA with blunt ends (orange line, middle) or “sticky” dAdT overhangs (black line, top) display the characteristic SAXS pattern of the inverted hexagonal HIIC phase25 with five [h k] reflections: [10], [11], [20], [21], and [30]. The lattice spacing of this phase is aH = 4π/(√3q10) = 60.7 Å (q10 = 0.120 Å−1). In both patterns two very small additional peaks are present, indicated by blue arrowheads. Their position suggests that these peaks stem from a small amount of complexes in the QIIG, sDNA phase that coexist with those in the HIIC phase.
Figure 3.

Synchrotron SAXS scans for isoelectric complexes of a DOTAP/GMO (85:15, mol:mol) lipid mixture with sDNAs of different length (5 and 11 bp) and end structure (3′-dAdT (black lines), blunt (orange lines), and 3′-dTdT (blue lines)). A) Scans for complexes containing 5 bp sDNAs at 27 °C. The SAXS data reveals that the duplexes with dAdT overhangs and blunt ends form the inverted hexagonal phase, HIIC, while duplexes with dTdT overhangs form a body-centered gyroid cubic structure with space group Ia3d, termed QIIG, sDNA (cf. Figure 1A). The blue arrowheads point to residual reflections from a small percentage of complexes in the QIIG, sDNA phase. B) SAXS data for complexes containing 11 bp sDNAs at 27 °C. The HIIC phase is the only phase observed for dAdT overhangs and blunt ends. For dTdT overhangs, the arrowhead points to a reflection arising from a small amount of complexes in the QIIG, sDNA phase. C) Scans for complexes containing 5 bp sDNAs at 75.2 °C. The 5 bp sDNA with blunt and dTdT ends exclusively forms the QIIG, sDNA phase at this temperature, while the HIIC and QIIG, sDNA phase coexist for dAdT overhangs. D) SAXS data for complexes containing 11 bp sDNAs at 75.2 °C. The HIIC phase remains the only phase observed for dAdT overhangs and blunt ends, while the QIIG, sDNA phase is now the dominant phase for dTdT overhangs.
Figure 3B shows SAXS scans of isoelectric complexes of DOTAP/GMO with 11 bp sDNAs (blunt, dTdT, and dAdT) collected at 25 °C. These complexes differ from those in Figure 3A only in the length of the DNA. At 25 °C, the 11 bp sDNA duplexes adopt the HIIC phase with a lattice spacing of aH = 59.5 Å (q10 = 0.122 Å−1) regardless of end structure. Only in the case of nonpairing dTdT overhangs (blue line, bottom) is a small fraction of the QIIG, sDNA phase present, as indicated by the peak marked by the blue arrowhead.
Figures 3C and 3D show SAXS scans of the same samples presented in Figures 3A and 3B, now at 75.2 °C. Temperature affects the phase behavior strongly, and at this higher temperature, the complexes of the blunt 5 bp sDNA have undergone a phase transition to the QIIG phase (orange line, middle) with aQ = 134.0 Å (q211 = 0.115 Å−1), without a coexisting HIIC phase. A similar phase transition is observed for the complexes of 5 bp sDNA with dAdT overhangs (black line, top), but in this case the SAXS peaks indicate coexistence of phases (HIIC peak indicated by the black arrowhead). The corresponding lattice spacings are aH = 57.6 Å and aQ = 137.0 Å. The complexes of the 5 bp sDNA with dTdT overhangs (blue line, bottom) remain in the QIIG, sDNA phase, and the only detected difference is a shift of the peaks to larger values of q at elevated temperatures, corresponding to a smaller lattice spacing aQ = 133.5 Å (q211 = 0.115 Å−1). The scans in Figure 3D show that for 11 bp sDNA, only the complexes of sDNAs with dTdT overhangs have undergone a phase transition at 75.2 °C (blue line, bottom): the HIIC and the QIIG, sDNA phases coexist, with aH = 57.6 Å and aQ = 129.2 Å. The other two samples (11 bp sDNA with blunt ends and dAdT overhangs; orange (middle) and black (top) line, respectively) only exhibit a shift of their peaks to higher values of q while maintaining the inverted hexagonal structure (aH = 57.6 Å). Interestingly, this temperature-dependence of the phase behavior is the opposite of that of the lipid mixture without sDNA (i.e., the inverted hexagonal phase has become the low temperature phase).
The lattice spacings decrease as a function of temperature for both sDNA-containing phases (by ~5% over the investigated range of temperature of 27 to 85.2 °C) but are essentially constant for the lipid mixture without sDNA (Figure 2B). At low temperature, the lipid tails are stretched out, but with increasing temperature other conformations of the chains become more common. This effectively shortens and broadens the chains, thinning the membrane. In the CL–sDNA complexes, sDNA is electrostatically pinned to the lipid headgroups, which renders them more static than the tails.31 Thus, the overall thermal expansion mirrors that of the tails, the membranes thin, and the lattice spacing decreases. Without associated sDNA, both headgroups and tails are mobile, and the increased headgroup mobility (and expansion perpendicular to the membrane) compensates for the membrane-thinning caused by the tails.
Figure 4 displays the SAXS scans obtained for complexes of blunt 5 bp sDNA as a function of temperature, with an expanded view of the first peaks in the left panel. The HIIC phase predominates at low temperature (27 °C). As the temperature increases, reflections characteristic of the cubic QIIG, sDNA phase gradually increase in intensity, while those assigned to the HIIC phase decrease. At the same time, the peak positions slightly shift to higher values of q with temperature, reflecting the decrease in lattice spacing mentioned above. From 63.8 °C to 66.8 °C, however, the values of q decrease comparatively strongly (reflecting a sudden increase in lattice spacing), and only peaks assigned to the QIIG, sDNA phase remain. This dual change likely indicates a large extent of sDNA dehybridization (disassembly of double-stranded (ds) into single-stranded (ss) DNA). Stacking (and thus the HII phase) requires sDNA duplexes, and dehybridization increases the number of molecules within the CL lipid tubes, osmotically swelling the phase (through water uptake from the bulk solution). In addition, single-stranded DNA has a smaller persistence length and hydrodynamic radius than duplex DNA,32 which also may affect the lattice spacings of CL–sDNA complexes.
Figure 4.

Synchrotron SAXS scans for isoelectric complexes of a DOTAP/GMO (85:15, mol:mol) lipid mixture with blunt 5 bp sDNA as a function of temperature. The left panel displays an expanded view of the first peaks (q=0.10 to 0.15 Å−1). At low temperature (27 °C), the HIIC phase is dominant. As the temperature increases, Bragg reflections characteristic of the gyroid cubic phase, QIIG, sDNA, gradually increase in intensity while those assigned to the HIIC phase become smaller. At 66.8 °C, only peaks assigned to the QIIG, sDNA phase remain. The peaks initially shift to higher values of q as temperature increases (indicating a decreasing lattice spacing), but then q decreases (and the lattice spacing increases) from 63.8 °C to 66.8 °C and the HIIC phase disappears. This dual change likely indicates a large extent of sDNA dehybridization. Stacking (and thus the HIIC phase) requires sDNA duplexes, and dehybridization increases the number of molecules inside the channels, exerting an osmotic pressure that swells the phase.
Double-stranded sDNAs dehybridizes at elevated temperature, and the temperature at which an equal number of bases are paired and unpaired (often referred to as the DNA melting temperature Tm) depends on a number of factors such as base composition, DNA concentration, salinity of the DNA solution, and number of DNA base pairs (the shorter the DNA, the lower Tm). The ssDNA products of dehybridization are much more flexible than DNA duplexes, which affects predictions of the phase behaviour of their lipid complexes. Therefore, it is important to consider dehybridization effects on the phase behavior of CL–sDNA complexes. Algorithms and tools exist to predict the dehybridization of DNA in solution,27 but the required input parameters of salinity and DNA concentration can only be estimated for the CL–sDNA environment. We calculated the approximate DNA concentration in the sample pellets as described in the Supplementary Information. Salinity is harder to estimate because the CL membranes act as a macro-salt. In addition, the confinement of DNA within CL membranes is known to stabilize DNA against dehybridization.33 However, we can estimate an effective salinity from our data by assuming that the observed transition to a pure cubic phase and the correlated change in lattice spacing coincides with Tm for blunt 5 bp sDNA. Using the resulting value (1 M NaCl; this high concentration reflects the duplex-stabilizing effect of complexation) to estimate Tm of the other sDNAs (cf. Figure S2 in the Supplementary Information), we obtained a Tm of > 85 °C for 24 and 48 bp sDNAs, and a Tm of approximately 65 and 77 °C for 5 and 11 bp sDNAs, respectively. (Table S2 in the Supplementary Information shows all calculated values.) This suggests that dehybridization does not play a role in the phase behaviour of sDNA duplexes longer than 5 bp, a conclusion that is supported by the observed lattice spacings (see below). For these very short DNA molecules, the difference in flexibility between the double-stranded and single-stranded forms is unlikely to strongly affect the phase behaviour.
Figure 5 shows the lattice spacings obtained for the HIIC and QIIG, sDNA phases (aH and aQ, respecttively) as a function of temperature for complexes prepared with 11 bp sDNA with dTdT (A), blunt (B), and dAdT (C) overhangs as well as 5 bp sDNA dTdT (D), blunt (E), and dAdT (F) overhangs. These lattice spacings were calculated using the centered peak positions of the q10 and q211 reflections for the HIIC and QIIG, sDNA phases, respectively. The lattice spacings of complexes prepared with 11 bp sDNA duplexes decrease slightly and gradually as a function of temperature, due to the lateral thermal expansion of the lipid tails discussed above. The observed gradual changes provide no indication that the 11 bp sDNAs dehybridize within the CL–sDNA complexes in the investigated temperature range. Importantly, this means that the HIIC–to–QIIG, sDNA phase transition observed for 11 bp sDNA with dTdT overhangs is not caused by dehybridization.
Figure 5.

Lattice spacings of the QIIG, sDNA (aQ, black dots) and the HIIC (aH, red dots) phases as a function of temperature. Top row: complexes prepared from 11 bp sDNA with dTdT overhangs (A), blunt ends (B), and dAdT (C) overhangs. Bottom row: complexes prepared from 5 bp sDNA with dTdT overhangs (D), blunt ends (E), and dAdT (E) overhangs. For all complexes containing 11 bp sDNA, the lattice spacings decrease slowly and gradually as the temperature increases. The cubic lattice spacings of complexes of 5 bp sDNA with dTdT (D) and blunt (E) ends initially also decrease with temperature, but then suddenly increase near 55 °C (dTdT) and 65 °C (blunt) before decreasing again. This jump can be explained as the effect of sDNA dehybridization (cf. also Figure 4), which increases the number of sDNA molecules, generating an osmotic pressure that swells the phase. Lines through the data for aQ are a guide to the eye, highlighting the discontinuity of the slope in parts D and E in contrast to parts A and F.
The plot of lattice spacing vs. T for blunt 5 bp sDNA (Figure 5 E) clearly shows the features pointed out in the discussion of Figure 4: aQ initially decreases in with temperature, shows a jump to a larger spacing at ≈65 °C and then continues to decrease, but less steeply. The lattice spacing of the cubic phase of 5 bp sDNA with dTdT overhangs (Figure 5 D) shows a very similar behavior, albeit with the discontinuity occurring earlier, between 55 and 60 °C. This is in reasonable agreement with the calculated Tm of 61 °C. No inverted hexagonal phase forms with this sDNA, and change in phase is associated with the discontinuity in aQ. The temperature dependence of the lattice spacings of complexes of 5 bp sDNA with dAdT overhangs more closely resembles that for 11 bp sDNA with dTdT overhangs than those of the other 5 bp sDNAs (Figure 5 F). What at first glance appears as a discontinuity in the plot of lattice spacing vs. T at ≈70 °C likely is only a bad data point, because the HIIC phase persists over the observed temperature range and the slope of aQ vs. T does not change. (All other data points fit well to a single straight line, as observed for 11 bp sDNA with dTdT overhangs, but unlike the data for the other two 5 bp sDNAs (Figure 5).) The calculated Tm for 5 bp sDNA with dAdT overhangs is 59 °C, but the calculations of dehybridization temperature do not account for stacking effects (which result in pairing of the overhangs for sDNAs with dAdT overhangs) and are therefore likely to significantly underestimate Tm for sDNAs with sticky overhangs.
Figure 6 displays the phase diagram for all the DOTAP/GMO–sDNA complexes investigated in this work. The phases were identified by SAXS as described above and are plotted as a function of temperature, end structure, and duplex length. Complexes forming solely the cubic QIIG, sDNA phase are represented by black dots, while those exhibiting only the inverted hexagonal HIIC phase are represented by white dots. The coexistence of phases is indicated by a grayscale shading, with the amount of black representing the percentage of the cubic phase (%QIIG, sDNA) in a given sample. Note that the exact values for %QIIG, sDNA (for the samples displaying phase coexistence) are given in Table 1 and plotted in Figure 7. We quantified the amounts of each phase by fitting the overlapping first peaks of the two phases (q211 for QIIG, sDNA and q10 for HIIC) to a double Lorentzian line shape (cf. Figure S1 in the Supplementary Information) and integrating them, obtaining the fraction of cubic phase in percent as
Figure 6.

Complete phase diagram for isoelectric complexes of a DOTAP/GMO (85:15, mol:mol) lipid mixture with sDNAs of varied length (5, 11, 24, and 48 bp) and end structure (blunt ends and dAdT or dTdT overhangs) as a function of temperature. Each data point displays the structural information derived from the SAXS data using a grayscale. White and black dots represent single-phase HIIC and QIIG, sDNA complexes, respectively. Gray dots represent phase coexistence (HIIC and QIIG, sDNA), with the amount of black proportional to the percentage of QIIG, sDNA phase (%QIIG, sDNA). Note that the exact values for %QIIG, sDNA (for the samples displaying phase coexistence) are given in Table 1 and plotted in Figure 7. The percentages were calculated by fitting and integrating the first Bragg reflections of the QIIG, sDNA (q211) and HIIC (q10) phases (cf. Figure S1 in the Supporting Information).
Table 1.
Percentage of the cubic (QIIG, sDNA) phase observed in DOTAP/GMO–sDNA complexes as a function of temperature, as determined from small-angle X-ray scattering data (cf. Figure S1 in the Supplementary Information). Data is given only for complexes exhibiting phase coexistence (cf. Figure 6).
| Temperature (°C) | 27 | 32 | 34.4 | 39.5 | 44.6 | 48.9 | 51.4 | 56.1 | 60.2 | 63.8 | 66.8 | 69.3 | 75.2 | 77.9 | 81.5 | 85.2 | |
|---|---|---|---|---|---|---|---|---|---|---|---|---|---|---|---|---|---|
| %(QIIG, sDNA) | 5 bp dAdT | 13.6 | 13.7 | 16.8 | 19.8 | 23 | 30.3 | 33.3 | 50.5 | 53.4 | 55.8 | 61.1 | 67.5 | 71.9 | 74.7 | 81.6 | 82 |
| 5 bp blunt | 10.4 | 12.2 | 14.4 | 27.4 | 41.1 | 46.5 | 49.5 | 67 | 74.5 | 80 | 100 | 100 | 100 | 100 | 100 | 100 | |
| 11 bp dTdT | 9.1 | 12.7 | 12.7 | 12.8 | 15.6 | 19.5 | 33.3 | 50.5 | 60 | 61.3 | 67.3 | 71 | 74.1 | 75.3 | 78.2 | 79.9 | |
Figure 7.

Temperature dependence of the percentages of the double gyroid cubic (QIIG, sDNA, black lines and dots) and inverted hexagonal (HIIC, red lines and dots) phases for complexes displaying phase coexistence: DOTAP/GMO complexes with 5bp dAdT (A), 5 bp blunt (B), and 11 bp dTdT (C) sDNAs. Comparing the graphs for 5 bp DNA with dAdT overhangs and blunt ends shows that while the stacking (reflected by the amount of the HIIC phase) induced by these ends is similar at room temperature, blunt ends exhibits a stronger temperature-dependence (i.e., the curves are steeper). Thus, the end-to-end interaction mediated by blunt and dAdT ends is very similar but not identical.
where AQ(q211) and AH(q10) are the areas under the q211 peak and the q10 peak, respectively. The values of %QIIG, sDNA as a function of temperature are also listed in Table 1. The phase diagram allows a comprehensive qualitative comparison of the different DOTAP/GMO–sDNA complexes. Complexes containing 24 and 48 bp sDNAs formed the HIIC phase independent of the sDNA ends and temperature. For 11 bp sDNA with dAdT and blunt ends, the HIIC phase also formed exclusively at all investigated temperatures (27–85.2 °C). However, for 11 bp sDNA with dTdT ends, the HIIC phase coexisted with the QIIG, sDNA phase, and the amount of the cubic phase increased with temperature. Similar temperature-dependent behavior was observed for 5 bp sDNAs with dAdT and blunt ends, while 5 bp DNA with dTdT overhangs formed the QIIG, sDNA phase at all temperatures. In summary, the amount of cubic phase increases with decreasing length of the sDNA duplex and with increasing temperature. It also changes with end structure, in the order dTdT > blunt ≈ dAdT.
In the HIIC phase (Figure 1A, left), the DNA-containing channels are essentially straight over lengths exceeding the persistence length of DNA (500–1000 Å).34 In contrast, the channels of the QIIG, sDNA phase are highly curved even on the length scale of the dimension of the unit cell (aQ; about 140 Å at 27 °C and 130 Å at 75.2 °C; cf. Figure 1A, right). The employed lipid mixture contains a large molar fraction of GMO (85%); in this regime of low cationic lipid content, electrostatic interactions in the CL–DNA complex are not expected to facilitate bending of the incorporated DNA.26 Thus, fitting DNA into the QIIG, sDNA phase incurs a large energetic cost for incorporating long DNAs (for bending) or sDNA stacks (for bending and/or breaking up stacks). Therefore, long DNAs and sDNA stacks will prefer the HIIC phase, making the QIIG-to-HIIC phase transition an indicator of end-to-end interactions. (In this context, long means a length of the order of aQ ≈ 130 Å.)
While our data suggests that blunt 5 bp sDNA and 5 bp sDNA with dTdT overhangs molecules dehybridize in the observed temperature range, dehybridization is not the driving force for the phase formation. This is most evident for the 11 bp sDNAs, which have similar melting temperatures but different phase behavior. In addition, the phases at formed low temperatures, where sDNA dehybridization is negligible (e.g., QIIG, sDNA for 5 bp sDNA with dTdT overhangs, HIIC for long sDNAs, and coexisting phases for both 5 bp and 11 bp sDNAs), strongly depend on the structure of the sDNAs. The only observed effect of dehybridization on the phase behavior is the disappearance of the HIIC phase for blunt 5 bp sDNA, which is readily explained by the disruption of sDNA stacking that dehybridization causes. Otherwise, only the lattice spacings are affected.
The amount of sDNA stacking as a function of temperature depends on the strength of the end-to-end interactions and the extent of loss of orientational entropy for individual rods. Blunt and “sticky” dAdT overhangs induce stacking of sDNAs,10, 12 and previous studies have shown that even repulsive dTdT overhangs do not fully suppress stacking in a 2D system12 (cf. Figure 1B). The diameter of the water channels, Dw, in the QIIG phase can be estimated to about 29 to 35 Å.35 The length of a sDNA duplex is 163 Å for 48 bp, 82 Å for 24 bp, 37 Å for 11 bp, and 17 Å for 5 bp. Thus, the orientational entropy (SOri, a measure of the orientation configurations available to sDNA confined within the water channels) for individual 5 bp sDNA rods (with length < Dw) is high, while it is low for 24 bp and 48 bp sDNA rods (with lengths ≫ Dw). For 11 bp sDNA, which are just longer than Dw, the orientational entropy is intermediate between that of 24 bp and 5 bp sDNA.
The 24 bp and 48 bp sDNA lose only their low orientational entropy upon stacking. Thus, end-to-end interactions dominate and the HIIC phase replaces the QIIG phase at all temperatures and end structures investigated. In contrast, breaking of stacks restores the high SOri state for 5 bp sDNA. For these shortest rods the QIIG phase forms exclusively with weak end-to-end interactions (nonsticky dTdT overhangs). With dAdT overhangs or blunt ends (i.e., enhanced end-to-end interactions), the HIIC phase is prevalently but not exclusively formed at room temperature (implying presence of sDNA stack lengths larger than or about equal to aQ), but increasing temperature gradually restores the QIIG phase with high sDNA orientational entropy. Similar phase behavior is found for 11 bp sDNA with nonsticky dTdT overhangs. Here, the intermediate orientational entropy of 11 bp sDNA rods disfavors stacking less (and stacks with a given number of sDNAs are longer), and the residual attractive end-to-end interactions mediated by dTdT overhangs dominate at room temperature (stabilizing the HIIC phase). At higher temperature, the QIIG phase returns, as restoration of the intermediate SOri state drives disassembly of the stacks. In contrast, the stronger end-to-end interactions mediated by dAdT overhangs or blunt ends stabilize the HIIC phase for 11 bp sDNA even at the highest temperatures, dominating the contribution of SOri.
A few subtler points merit discussion. Intriguingly, the blunt and dAdT ends resulted in similar or identical phase behavior for all sDNA lengths (see also below, discussion of Figure 7). This is in accordance with earlier findings in bulk systems.36 The fact that the HIIC phase predominates at room temperature even for the short 24 and 11 bp sDNAs was unexpected in light of the fact that small interfering RNAs (siRNAs; 21 bp RNAs with 2-nt 3′ overhangs on each end that induce specific gene knockdown;37 L= 55 Å) form the bicontinuous cubic QIIG, siRNA phase. Evidently the different conformations of DNA and siRNA (B- and A-form, respectively) not only result in different aspect ratios, but also in a different propensity for stacking when confined in 1D water channels (with nucleic acids in the B-conformation stacking more efficiently than those in the A-conformation). Finally, it is worth stressing that complexation of suitable sDNAs reverses the thermotropic behavior of the lipid mixture: instead of a transition from QIIG to HIIC (no sDNA, see Figure 2), higher temperature induces the transition from HIIC to QIIG in CL–sDNA complexes.
To allow a closer look at the temperature-dependence of the phase behavior, Figure 7 shows the percentages of the QIIG, sDNA and HIIC phases in all systems that displayed coexistence. The gradual appearance of the QIIG, sDNA phase demonstrates that the HIIC-to-QIIG, sDNA transition is not first order. It also is consistent with our hypothesis that sDNA stacking is driving the phase transition, in that temperature-induced fluctuations disrupt stacking of sDNA, thus shortening sDNA stacks and allowing them to fit into the curved channels of the QIIG, sDNA phase. For 5 bp sDNA with blunt ends (Figure 7B), the temperature-dependence is stronger (i.e., the curves are steeper) compared to 5 bp sDNA dAdT (Figure 7A) and 11 bp sDNA dTdT (Figure 7C). The temperature at which both phases exist in equal amount is about 56 °C for these cases but about 52 °C for blunt 5 bp sDNA. This demonstrates that while similar, the end-to-end interaction mediated by blunt and dAdT ends is not identical. The temperature-dependence of the structural transition of CL–sDNA complexes from the HIIC to the QIIG, sDNA phase can thus serve as a tool to estimate the relative strength of the end-to-end interactions. Our data (for 5 and 11 bp sDNA) shows that dAdT overhangs and blunt ends mediate similar, strong attractive interactions leading to stacking, while the interactions mediated by dTdT overhangs are weaker but still attractive (because the HIIC phase dominates for 11 bp sDNA with dTdT overhangs at room temperature).
Conclusions
In this paper, we demonstrated how the electrostatic coupling of charged membranes to short DNA (sDNA) of varied length, with tunable, temperature-dependent end-to-end stacking interactions, enables switching between the inverted gyroid cubic structure (QIIG) and the inverted hexagonal phase (HIIC). While the structure of amphiphile self-assemblies is typically determined by amphiphile shape (the ratio of the projected area of tails and headgroup),1 adding short DNAs (sDNAs) to positively charged membranes provides additional degrees of freedom and can be used to template phases. Understanding the mechanisms that underlie membrane shape evolution is important because they enable function in nature (e.g. budding of vesicles for intracellular transport, and endo- and exocytosis). There are parallels between this work and the shape evolution of biological membranes, which is often driven by the interaction of lipids with membrane-associated, curvature-generating proteins.38, 39 The interplay of amphiphile molecular shape and sDNA stacking generates rich phase behavior, and appropriately chosen sDNAs introduce new thermotropic behavior, as the stacks disassemble with increasing temperature. We investigated the phase behavior of DOTAP/GMO–sDNA complexes as a function of temperature (27–85.2 °C), sDNAs length (5, 11, 24, and 48 bp; varying the orientational entropy of individual sDNA rods) and end structure (base-pairing dAdT, blunt, and nonpairing dTdT). These variables affect end-to-end stacking interactions of DNA in bulk36 and in a 2D system.12 The employed lipid mixture of 85% GMO and 15% DOTAP forms the bicontinuous cubic QIIG phase in the absence of DNA at room temperature, and coexisting QIIG and HII phases at 80 °C and above. We monitored the inverted hexagonal to gyroid cubic (HIIC-to-QIIG) phase transition in the DOTAP/GMO–sDNA complexes with synchrotron SAXS. All sDNAs but one (5 bp sDNA with dTdT ends) form the HIIC phase at room temperature, with small coexisting amounts of the QIIG, sDNA in the case of the shortest sDNAs. The HIIC and QIIG, sDNA phases both incorporate DNA within their channels, i.e., a 1D system. The channels in the HIIC structure are essentially straight over hundreds of nanometers, while those in the QIIG, sDNA structure are strongly curved. Our data is consistent with the hypothesis that longer sDNA duplexes or stacks of duplexes disfavour formation of the QIIG, sDNA phase to avoid bending or the disassembly of sDNA stacks. In other words, the energy gain of end-to-end interactions dominates with respect to the penalty of changing the CL curvature from the preferred QIIG to the HIIC phase as the next preferred arrangement. (The HIIC phase of DOTAP/GMO–siRNA complexes neighbors the QIIG, siRNA phase as a function of ΦGMO.26) The length of sDNA stacks is determined by the balance of attractive end-to-end interactions and the loss of orientational entropy for individual rods. The orientational entropy of sDNA rods decreases strongly as their length increases from less (5 bp) to much larger than (48 bp) the diameter of the water channels, which gives rise to a strong length dependence of the phase behavior of the CL–sDNA complexes.
The temperature dependence of the relative amounts of QIIG,sDNA and HIIC phases, quantitatively determined by analysis of the SAXS patterns, yielded information on the relative strength of DNA end-to-end interactions. The end-to-end stacking mediated by dAdT overhangs and blunt ends is qualitatively similar, but the stacking mediated by blunt ends exhibits a stronger temperature dependence (cf. Figure 7). Of note (and consistent with results in a 2D system12), 11 bp sDNA duplexes stack even if they carry nonpairing dTdT overhangs, but these interactions are weaker than those due to dAdT and blunt ends. Our findings have important implications for the engineering of self-assembled materials, especially in colloidal science, where interactions are generally weak.40 Understanding how DNA length and end structure affect end-to-end interactions allows us to envision DNA-mediated interactions for self-assembly beyond base-pairing. This is important because the ability to harness a variety of tunable, competing interactions is crucial for developing higher-order self-assemblies (self-assembled on multiple length scales) that are the basis of many materials found in nature.41
Supplementary Material
Acknowledgments
We acknowledge support by DOE–BES grant number DOE–DE–FG02–06ER46314 (interplay between membrane shape and DNA stacking), NSF DMR–1101900 (phase behavior), and NIH GM-59288. This work made use of the Central Facilities of the Materials Research Laboratory at UCSB which are supported by the MRSEC Program of the NSF under award no. DMR-1121053; a member of the NSF-funded Materials Research Facilities Network (www.mrfn.org). Cecília Leal was funded by the Swedish Research Council (VR) and in part by DOE–BES. The X-ray diffraction work was carried out at the Stanford Synchrotron Radiation Lightsource (SSRL) beam line 4.2. CRS acknowledges useful discussions with KAIST Faculty where he has a WCU (World Class University) Visiting Professor of Physics appointment supported by the National Research Foundation of Korea funded by the Ministry of Education, Science and Technology grant No. R33–2008–000–10163–0.
Footnotes
Electronic Supplementary Information (ESI) available: [An example of a double Lorentzian line fit to SAXS data of a sample displaying coexisting QIIG, sDNA and HIIC phases, illustrating the procedure that was used to calculate the percentage of cubic phase (%QIIG, sDNA); sequences of sense and antisense strands of the sDNAs used; calculation of sDNA concentration in the X-ray samples; calculated plots of sDNA dehybridization vs. temperature and values of Tm for the sDNAs]. See DOI: 10.1039/b000000x/
Notes and references
- 1.Israelachvili JN, Mitchell DJ, Ninham BW. J Chem Soc, Faraday Trans 2. 1976;72:1525–1568. [Google Scholar]
- 2.Seddon JM. Biochim Biophys Acta. 1990;1031:1–69. doi: 10.1016/0304-4157(90)90002-t. [DOI] [PubMed] [Google Scholar]
- 3.Helfrich WZ. Z Naturforsch. 1973;C28:693–703. doi: 10.1515/znc-1973-11-1209. [DOI] [PubMed] [Google Scholar]
- 4.Lipowsky R, Sackmann E. Structure and Dynamics of Membranes. New York: 1995. [Google Scholar]
- 5.Safran SA. Statistical Thermodynamics Of Surfaces, Interfaces, And Membranes. Addison-Wesley; Reading, Massachusetts: 1994. [Google Scholar]
- 6.Siegel DP, Epand RM. Biophys J. 1997;73:3089–3111. doi: 10.1016/S0006-3495(97)78336-X. [DOI] [PMC free article] [PubMed] [Google Scholar]
- 7.Seeman NC. J Theor Biol. 1982:237–247. doi: 10.1016/0022-5193(82)90002-9. [DOI] [PubMed] [Google Scholar]
- 8.Cheng J, Seeman NC. Nature. 1991;350:631–633. doi: 10.1038/350631a0. [DOI] [PubMed] [Google Scholar]
- 9.Seeman NC. Nature. 2003;421:427–431. doi: 10.1038/nature01406. [DOI] [PubMed] [Google Scholar]
- 10.Nakata M, Zanchetta G, Chapman BD, Jones CD, Cross JO, Pindak R, Bellini T, Clark NA. Science. 2007;318:1276–1279. doi: 10.1126/science.1143826. [DOI] [PubMed] [Google Scholar]
- 11.Woo S, Rothemund PWK. Nature Chem. 2011;3:620–627. doi: 10.1038/nchem.1070. [DOI] [PubMed] [Google Scholar]
- 12.Bouxsein NF, Leal C, McAllister CS, Ewert KK, Li Y, Samuel CE, Safinya CR. J Am Chem Soc. 2011;133:7585–7595. doi: 10.1021/ja202082c. [DOI] [PMC free article] [PubMed] [Google Scholar]
- 13.Felgner PL, Gadek TR, Holm M, Roman R, Chan HW, Wenz M, Northrop JP, Ringold GM, Danielsson M. Proc Natl Acad Sci U S A. 1987;84:7413–7417. doi: 10.1073/pnas.84.21.7413. [DOI] [PMC free article] [PubMed] [Google Scholar]
- 14.Niidome T, Huang L. Gene Ther. 2002;9:1647–1652. doi: 10.1038/sj.gt.3301923. [DOI] [PubMed] [Google Scholar]
- 15.Li SD, Huang L. Gene Ther. 2006;13:1313–1319. doi: 10.1038/sj.gt.3302838. [DOI] [PubMed] [Google Scholar]
- 16.Li SD, Huang L. J Control Release. 2007;123:181–183. doi: 10.1016/j.jconrel.2007.09.004. [DOI] [PubMed] [Google Scholar]
- 17.Li SD, Huang L. Gene Ther. 2000;7:31–34. doi: 10.1038/sj.gt.3301110. [DOI] [PubMed] [Google Scholar]
- 18.Edelstein ML, Abedi MR, Wixon J, Edelstein RM. J Gene Med. 2004;6:597–602. doi: 10.1002/jgm.619. [DOI] [PubMed] [Google Scholar]
- 19.Edelstein ML, Abedi MR, Wixon J. J Gene Med. 2007;9:833–842. doi: 10.1002/jgm.1100. [DOI] [PubMed] [Google Scholar]
- 20.Koltover I, Wagner K, Safinya CR. Proc Natl Acad Sci U S A. 2000;97:14046–14051. doi: 10.1073/pnas.97.26.14046. [DOI] [PMC free article] [PubMed] [Google Scholar]
- 21.Safinya CR, Ewert KK, Leal C. Liq Cryst. 2011;38:1715–1723. doi: 10.1080/02678292.2011.624364. [DOI] [PMC free article] [PubMed] [Google Scholar]
- 22.Rädler JO, Koltover I, Salditt T, Safinya CR. Science. 1997;275:810–814. doi: 10.1126/science.275.5301.810. [DOI] [PubMed] [Google Scholar]
- 23.Salditt T, Koltover I, Rädler JO, Safinya CR. Phys Rev E. 1998;58:889–904. [Google Scholar]
- 24.Ewert K, Evans HM, Zidovska A, Bouxsein NF, Ahmad A, Safinya CR. J Am Chem Soc. 2006;128:3996–4006. doi: 10.1021/ja055907h. [DOI] [PubMed] [Google Scholar]
- 25.Koltover I, Salditt T, Rädler JO, Safinya CR. Science. 1998;281:78–81. doi: 10.1126/science.281.5373.78. [DOI] [PubMed] [Google Scholar]
- 26.Leal C, Bouxsein NF, Ewert KK, Safinya CR. J Am Chem Soc. 2010;132:16841–16847. doi: 10.1021/ja1059763. [DOI] [PMC free article] [PubMed] [Google Scholar]
- 27.Zadeh JN, Steenberg CD, Bois JS, Wolfe BR, Pierce MB, Khan AR, Dirks RM, Pierce NA. J Comput Chem. 2011;32:170–173. doi: 10.1002/jcc.21596. [DOI] [PubMed] [Google Scholar]
- 28.Briggs J, Chung H, Caffrey M. J Phys II France. 1996;6:723–751. [Google Scholar]
- 29.Larsson K. Nature. 1983;304:664–665. [Google Scholar]
- 30.Leal C, Ewert KK, Shirazi RS, Bouxsein NF, Safinya CR. Langmuir. 2011;27:7691–7697. doi: 10.1021/la200679x. [DOI] [PMC free article] [PubMed] [Google Scholar]
- 31.Leal C, Sandström D, Nevsten P, Topgaard D. Biochim Biophys Acta. 2008;1778:214–228. doi: 10.1016/j.bbamem.2007.09.035. [DOI] [PubMed] [Google Scholar]
- 32.Tinland B, Pluen A, Sturm J, Weill G. Macromolecules. 1997;30:5763–5765. [Google Scholar]
- 33.Rosa M, Dias R, da Graça Miguel M, Lindman B. Biomacromolecules. 2005;6:2164–2171. doi: 10.1021/bm050137n. [DOI] [PubMed] [Google Scholar]
- 34.Francescangeli O, Pisani M, Stanic V, Bruni P, Weiss TM. Europhys Lett. 2004;67:669–675. [Google Scholar]
- 35.Engblom J, Miezis Y, Nylander T, Razumas V, Larsson K. Progr Colloid Polym Sci. 2000;116:9–15. [Google Scholar]
- 36.Zanchetta G, Nakata M, Buscaglia M, Clark NA, Bellini T. J Phys Condens Matter. 2008;20:494214, 494216. [Google Scholar]
- 37.Elbashir SM, Harborth J, Lendeckel W, Yalcin A, Weber K, Tuschl T. Nature. 2001;411:494–498. doi: 10.1038/35078107. [DOI] [PubMed] [Google Scholar]
- 38.McMahon HT, Gallop JL. Nature. 2005;438:590–596. doi: 10.1038/nature04396. [DOI] [PubMed] [Google Scholar]
- 39.Parthasarathy R, Groves JT. Soft Matter. 2007;3:24–33. doi: 10.1039/b608631d. [DOI] [PubMed] [Google Scholar]
- 40.Belman N, Israelachvili JN, Li Y, Safinya CR, Ezersky V, Rabkin A, Sima O, Golan Y. Phys Chem Chem Phys. 2011;13:4974–4979. doi: 10.1039/c0cp00999g. [DOI] [PubMed] [Google Scholar]
- 41.Muthukumar M, Ober CK, Thomas EL. Science. 1997;277:1225–1232. [Google Scholar]
Associated Data
This section collects any data citations, data availability statements, or supplementary materials included in this article.