

Abstract
Active release antimicrobial coatings for medical devices have been developed to prevent and treat biofilm implant-related infections. To date, only a handful of coatings have been put into clinical use, with limited success. In this study, a novel antimicrobial compound was incorporated into a silicone (polydimethylsiloxane or PDMS) polymer to develop a novel active release coating that addressed several limitations of current device coatings. The efficacy of this coating was optimized using an in vitro flow cells system, then translated to an animal model of a simulated Type IIIB open fracture wherein well-established biofilms were used as initial inocula. Results indicated that the novel coating was able to prevent infection in 100% (9/9) of animals that were treated with biofilms and the novel coating (treatment group). In contrast, 100% (9/9) of animals that were inoculated with biofilms and not treated with the coating (positive control), did develop infection. Nine animals were used as negative controls, i.e., those that were not treated with biofilms, and showed a rate of infection of 11% (1/9). Eight animals were treated with the novel coating only to determine its effect on host tissue. Results indicated that the novel active release coating may have significant promise for future application to prevent biofilm implant-related infections in patients.
Keywords: Active release coating, Biofilm, Initial inocula, Animal model, Infection
1. Introduction
Biofilm implant-related infections adversely affect thousands of patients and cost the U.S. healthcare system over $3 billion dollars each year [1]. These infections accompany devices such as orthopedic implants [2], catheters [3], mechanical heart valves [1], pacemakers [1,4], sutures [5,6], ventricular shunts [7], and stents [8]. One of the most practical strategies undertaken over the last 30 years to prevent these infections has been to develop biomaterial device coatings that release antimicrobial compounds into the surrounding tissues and fluids of a patient [9–11]. These coatings are referred to as active release coatings. To date, only a handful of these coatings have been put into clinical use [5,10,12–23]. Clinical studies have shown that these coatings have had minimal to no success in reducing rates of infection in patients [5,10,12–24].
This limited success may be due to three reasons. First, in some instances, researchers have tested the performance of an antimicrobial coating in vivo without optimizing its efficacy in vitro [14,25]. Furthermore, the most common method that has been used to test the efficacy of a device coating in vitro has been the use of stagnant broth solutions or hard agar surfaces. Depending on the application, if stagnant broth solutions or hard agar surfaces are used, an antimicrobial that elutes out of a device coating will likely reach concentrations that are not physiologically relevant. In a physiological environment, fluid flow has been shown to be more likely present, thus, antimicrobial coatings may benefit from being tested under fluid flow conditions in vitro prior to testing them in vivo [26–29].
Second, similar to the first limitation, investigators have at times performed in vivo testing with a reliance on minimum inhibitory concentration (MIC) data [14,25]. However, MIC values are wholly based on data from planktonic bacteria [30]. Thus, MIC values are not likely to translate to levels that are required to eradicate biofilm bacteria [31]. Furthermore, Williams and Costerton have recently hypothesized that wound sites and surgical sites are at risk of being contaminated with bacteria that reside in the biofilm phenotype, which may further reduce the efficacy of prophylactic antibiotics that are administered based on MIC values [31].
Third, in all animal models of biofilm-related infections that have been tested to date, planktonic bacterial cells have been used as initial inocula [25,26,32–41]. However, data has overwhelmingly indicated that bacteria from natural ecosystems, including the human body, predominantly reside in the biofilm phenotype [31,42–48]. Based on this information one could argue that wound sites, surgical sites and implanted devices are at risk of being contaminated with bacteria that reside in the biofilm phenotype [31]. Moreover, active release agents that are optimized against planktonic bacteria may have reduced efficacy when they are exposed to bacteria that reside in biofilms, both in in vitro and in vivo systems.
Each of these three limitations were addressed in this study by first optimizing an active release coating against biofilms of methicillin-resistant Staphylococcus aureus (MRSA) using an in vitro flow cell system. The coating that was developed was comprised of a silicone (polydimethylsiloxane or PDMS) polymer and an active release antimicrobial agent–cationic steroid antimicrobial-13 (CSA-13). CSA-13 is a synthetic analog of naturally occurring antimicrobial peptides (AMPs). Unlike AMPs, CSA-13 is not a peptide, thus it is not a target for proteases, it can be produced in commercial quantities at relatively low cost, and it has a very rapid, broad spectrum and nonspecific method of attack on bacterial cell membranes, which reduces the risk of engendering bacterial resistance [49,50]. CSA-13 has been shown to have superior activity to antibiotics and AMPs in head-to-head comparisons [50,51], it has a shelf life of several years, and can be sterilized by gamma radiation, autoclaving or ethylene oxide treatment. Based on these characteristics, CSA-13 may be a promising clinical alternative to traditional antibiotics, AMPs and other antimicrobial compounds.
The in vitro data that were generated and the CSA-13 coating itself were translated to a sheep model of a simulated Type IIIB open fracture [52]. The method by which infection was caused in the sheep model of this study was to first grow well-established biofilms of MRSA in a membrane biofilm reactor [53,54]. These biofilms were then used as initial inocula in the sheep. Using biofilms as initial inocula more accurately modeled the phenotype of bacteria from natural ecosystems that may contaminate open fracture sites. As an extension of the pilot work that was performed to develop this animal model [52], this study provided a model to test an active release coating in vivo wherein well-established, mature biofilms of MRSA were used as initial inocula. Using this model, the ability of the CSA-13 coating to prevent biofilm implant-related infection from developing was tested. Specifically, it was hypothesized that when CSA-13 was used as the active release agent of an active release coating on metal plates, it would prevent biofilm implant-related osteomyelitis from developing in an animal model of a simulated Type IIIB open fracture.
2. In vitro materials and methods
2.1. Reagents
CSA-13 was manufactured by Dr. Paul Savage’s research group at Brigham Young University, Provo, UT. Naphtha was purchased from Fisher Scientific Inc., Pittsburgh, PA, USA. A one-part room temperature vulcanizing (RTV-1) PDMS and primer (catalog #s MED-6607 and MED-160, respectively) were purchased from NuSil Technologies LLC, Carpinteria, CA, USA. This PDMS is on master file with the FDA. Modified Brain Heart Infusion broth and Dey Engley (D/E) broth were purchased from Fisher Scientific (catalog #B99070 and DF0819-17-2, respectively).
2.2. Stainless steel plates
For this study, sheets of 316L stainless steel (SS) were used to machine plates that were 2 cm × 2 cm with 2.7 mm screw holes drilled in each corner. Each plate had a thickness of 1.85 ± 0.01 mm. On the underside of each plate, a well with a depth of 300 μm and 1.2 cm width × 1.2 cm length was machined such that a 1 cm width × 1 cm length polyetheretherketone (PEEK) membrane could be placed in the well. The purpose for this PEEK membrane is described in the Biofilm Growth section below.
Prior to dip coating, each plate was grit blasted at 90 psi using fine grit silica beads in a dry media blast cabinet (model 36bp2, Trinity Tool Company, Fraser, MI, USA) in order to enhance the roughness of the surface. After grit blasting, the plates were cleaned and passivated following the American Society for Testing and Materials (ASTM) standard F86-04. Briefly, this passivation process involved cleaning and sonicating the plates in detergent, exposing them to a 35% nitric acid solution for 30–60 min and rinsing and sonicating them in copious amount of water for 20 additional minutes. Each plate was then allowed to air dry prior to dip coating.
2.3. PDMS suspension/concentration of CSA-13
It was experimentally determined that in order to reduce the number of bacteria in the MRSA biofilms to a potentially clinically acceptable level (less than 102 colony forming units (CFU)), an 18% w/w concentration of CSA-13 was needed in the active release coating. To determine this, 2%, 4%, 6%, 8%, 10%, 12%, 14%, 16%, 18% and 20% w/w concentrations of CSA-13 were tested against MRSA biofilms with n = 5 experiments per concentration using the flow cell system described below. All concentrations below 18% resulted in greater than 102 CFU at 24 h. A reduction that results in greater than 102 CFU would be considered unacceptable for clinical use by Clinical and Laboratory Standards Institute (CLSI) standards [55]. When 20% w/w was used, the PDMS polymer had undesirable mechanical properties due to reduced cross-linkage. Thus, CSA-13 was added to the PDMS dispersion such that a final 18% w/w concentration was obtained.
The CSA-13/PDMS dispersion was stirred for a minimum of 3 h. For those plates that were coated with PDMS only, no CSA-13 was added to the PDMS. Dispersions were degassed at ~25 in Hg to remove air bubbles prior to dip coating SS plates.
2.4. Dip coating procedure
Following passivation, SS plates were first hand dipped into MED-160 primer (NuSil Technologies) and allowed to dry for 45 min in ambient air and temperature on a rotating wheel to allow the primer to coat evenly over the surface of each plate. The rotating wheel was custom made to hold each plate on two prongs that were perpendicular to the face of the wheel.
After priming, SS plates were dipped by hand into a dispersion of PDMS only or PDMS with CSA-13. Plates were again placed onto the rotating wheel and allowed to cure for 7 days (as per the manufacturer’s recommendation) in a fume hood under ambient conditions. Importantly, the same technician dipped each of the plates under similar room conditions in an attempt to reduce lot-to-lot variability.
Uniformity of the coating was determined by measuring the thickness in three different areas of the plate using calipers with accuracy to 10 μm. The thickness was further confirmed by cutting the coating of several plates with a razor blade perpendicular to the plate surface, then measuring the thickness with a JEOL-6100 scanning electron microscope (SEM). The amount of CSA-13 per plate was calculated by weighing each plate before and after it was dipped, subtracting the weight of the plate, then multiplying the final coating weight by 0.18.
2.5. Flow cell
A flow cell unit was designed by the author DLW and machined by Biosurface Technologies (Bozeman, MT, USA). The unit consisted of 6 individual chambers, each having a 4 cm width × 4 cm length × 2 cm height (Fig. 1A and B). A 1/16″ inlet was machined in the center of each lid that covered each chamber. A barbed connection was used to connect each inlet to 1.42 mm inner diameter Tygon tubing (catalog # EW-96429-34, Cole Parmer, Vernon Hills, IL, USA). One end of the tubing was connected to the barb, the middle portion of the tubing passed through a peristaltic pump (Masterflex L/S, catalog # 07523-80, Cole Parmer), and the other end of the tubing was placed into 10% BHI broth (catalog # B99070, Fisher Scientific). As such, the broth could be pulled through the tubing and then through a chamber of the flow cell unit.
Fig. 1.

(A) Image of the flow cell unit. Arrows and labeling indicate the different components of the flow cell. (B) Image of a single chamber of the flow cell. (C) Image of the effluent tubes and bottles in which broth was collected after it flowed through a flow cell chamber. (D) Photograph of an SS plate being secured to a piece of autoclaved bone using a cortical bone screw. The PEEK membrane resided between the SS plate and bone piece.
One side of each chamber was drilled to have a 1/4″ outlet hole (see Fig. 1A). The bottom of the hole was exactly 1 cm from the bottom of each chamber. A barbed connection was used to connect 1/4″ inner diameter silicone tubing to an effluent bottle in which the BHI broth was collected after it had flowed through a chamber of the flow cell (Fig. 1C).
2.6. Biofilm growth
For this study a fresh, clinical isolate of MRSA was used. This isolate was collected from the knee of an infected patient and was passaged less than three times on Columbia blood agar. The isolate was confirmed to be one that formed biofilm as indicated by the presence of the icaADBC gene cluster, black colony growth on Congo Red agar and direct imaging of its growth on polyetheretherketone (PEEK) membranes using scanning electron microscopy (SEM) [54]. To grow the biofilms on PEEK membranes, a membrane biofilm reactor was used. The development and repeatability of growing biofilms in this reactor, as well as SEM images of the biofilms, have been published previously [53,54].
In short, biofilms were grown by first inoculating the reactor with 500 mL of modified Brain Heart Infusion (BHI) broth that contained 1 mL of a 0.5 McFarland standard of the MRSA isolate. In this instance, a 0.5 McFarland standard equated to ~107 cells/mL. Following inoculation, the reactor was incubated on a hot plate set at 34 °C for a 24-h period. After the initial 24-h growth period, a flow of dilute (10%) BHI broth was flowed through the reactor for an additional 24 h using a peristaltic pump set at a rate of 6.94 mL/min. With the hot plate set at 34 °C, the broth temperature was 30.3° ± 0.8° during the first 24 h and 30.2° ± 1.3° C during the second 24 h.
2.7. Quantification of MRSA cells in the biofilms
Quantitative and qualitative experiments have been performed previously to determine the repeatability, number of bacteria and maturity of biofilms on PEEK membranes that were used in the membrane biofilm reactor [54]. However, to confirm that the published numbers were consistent in this study, as well as to obtain a baseline of the number of CFU that grew on each membrane, two PEEK membranes were removed for quantification following each run of the reactor. The remaining six membranes were used in the actual experiment.
To quantify the CFU per membrane, PEEK membranes were vortexed in 5 mL of 10% BHI broth, sonicated for 10 min in a sonicating water bath set at 42k Hz and allowed to recover at room temperature for 20 min in the broth. A 10-fold dilution series was then used to calculate the CFU per PEEK membrane.
2.8. Flow cell setup/efficacy of CSA-13 in thin films
Following the 48-h growth period of the biofilm reactor, a PEEK membrane was aseptically removed and placed into a well on the underside of an SS plate. The plate was then secured to an autoclaved piece of bone using sterile cortical bone screws (Fig. 1D). The bone/SS plate/PEEK membrane construct was then placed into a chamber of the flow cell unit (see Fig. 1B). This procedure was repeated for all six chambers of the flow cell. Each chamber was then filled with 20 mL of 10% BHI broth in order to cover the entire bone/PEEK/SS plate construct. To model the body temperature of sheep, the incubator was set at 39 °C. Importantly, CSA-13 has the same activity at 39° C as it has at 37° C.
Over a 24-h period, a 10% BHI broth solution was flowed through the flow cell at a rate of 4.5 mL/h. This flow rate was chosen based on the work of Smith et al. [56], who showed that the rate of interstitial fluid flow in the hind limb of sheep can be between 1 and 8 mL/h. Moreover, the use of BHI broth was important as BHI is derived from boiled animal tissues. This broth was chosen to more closely model the environment that bacteria and CSA-13 would be exposed to in the future in vivo model.
At 4, 8 and 24-h time points, a bone/SS plate/PEEK membrane construct was aseptically removed from a chamber of the flow cell (Fig. 1B). The cortical bone screws were aseptically removed. The bone piece was placed into 20 mL of Dey Engley (D/E) broth (catalog #DF0819-17-2, Fisher Scientific), the SS plate was placed into 10 mL of D/E broth and the PEEK membrane was placed into 5 mL of D/E broth. The rationale for using D/E broth was because it contained lecithin, which is known to deactivate nitrogen containing antimicrobial compounds [57–59] and was confirmed to deactivate CSA-13. In this case, the CSA-13 was deactivated so that it did not have residual kill against bacteria during the quantification process. The different volumes of D/E broth were used to cover the entire surface of each of the different components within a 50 mL Falcon tube.
Each bone piece, SS plate and PEEK membrane was vortexed for 1 min, sonicated for 10 min and allowed to recover for 20 min prior to performing a 10-fold dilution series using tryptic soy agar to quantify the number of CFU. Each dilution was plated in duplicate. Results were calculated to show the number of CFU/g of tissue for the bone samples, total CFU/SS plate and total CFU/PEEK membrane. In addition, a 100 μL sample of broth was collected from each chamber and each effluent bottle to determine the CFU/mL of broth in each.
In total, n = 27 experiments were performed. This included n = 9 experiments that involved PDMS only coated plates with biofilms (positive control, Group 1), n = 9 experiments with CSA-13 coated plates tested against MRSA biofilms (test group, Group 2), and n = 9 that involved PDMS only coated plates with no biofilm on the PEEK membranes (negative control, Group 3). The rationale for performing these experiments in groups of 9 was to model the number of sheep that would be used in the future animal study, wherein 9 sheep would be treated in a similar manner as each of the three treatment groups outlined. As such, this study included the proper controls to ensure that PDMS itself did not have an antimicrobial effect on the biofilms (positive control, Group 1) and that the experiment was performed aseptically (negative control, Group 3).
2.9. Short term elution kinetics
At each collection time point of 4, 8 and 24 h, the broth from the chamber and from the effluent bottle was collected and analyzed using high pressure liquid chromatography/time of flight mass spectrometry (LC/MS) with a reverse phase C18 column to determine the amount of CSA-13 that had eluted out of the coating. More specifically, a 50 μL sample of broth was spiked with a known amount of deuterated CSA-13 (dCSA-13), which was mixed with NaOH to remove the positive charge from both CSA-13 compounds. The mixture was resuspended in dichloromethane (DCM) to separate the phases, then allowed to dry in order to be resuspended in 60% acetonitrile. A 5 μL sample was then injected into the LC/MS and pushed through the column over 3 ½ minutes while the acetonitrile concentration was increased from 60% to 100%. The ratio of counts from the CSA-13 and dCSA-13 was used to calculate the concentration of CSA-13/mL that was present in the original broth sample.
2.10. Long term elution kinetics/residual antimicrobial kill
Five CSA-13 coated SS plates were used to determine the amount of CSA-13 that eluted out of the PDMS polymer over a 15-day period. To do so, these five plates were placed into five separate chambers of the flow cell. A 10% BHI broth solution was flowed through the chambers for 15 days. At 24-h intervals, the broth was collected from the effluent bottles and analyzed using the same LC/MS technique as before.
In addition to collecting broth for elution kinetics data, each of the broth samples were also used to determine the efficacy of the eluted CSA-13 against planktonic bacterial cells in order to determine the duration of antimicrobial kill that the active release agent provided. This was done by pipetting 990 μL of a broth sample from each of the five plates that had eluted over a 30-day period into a test tube followed by 10 μL of water that had been adjusted to a 0.5 McFarland. The final concentration of bacteria was ~5 × 10⁵ cells/mL. The rationale for using this amount of bacteria was to coincide with the recommendations of CLSI standard M26-A. Each broth sample was incubated overnight at 39° C to model the temperature of a sheep’s body. A 10-fold dilution series was used to quantify the number of bacteria that remained in each broth sample with each dilution being plated in duplicate.
2.11. Extraction analysis
In order to determine if components of the PDMS material in the coating had broken off or deteriorated within the flow cell, a representative sample of BHI broth alone as well as samples of broth from Day 1, Day 5 and Day 10 of elution were analyzed by Matrix Assisted Laser Desorption Ionization Time of Flight Mass Spectrometry (MALDI/TOF). The mass spectral data was collected using delayed ion extraction mode on a Voyager-DE™ STR MALDI/TOF mass spectrometer (PerSeptive Biosystems, Framingham, MA, USA). Samples were spotted using a dried-droplet method. More specifically, fresh solution of saturated α-cyano-4-hydroxy cinnamic acid matrix (CHCA) in a solvent system of 50:50 water:acetonitrile 0.1% trifluoroaceticacid (TFA) was prepared by thoroughly mixing the matrix powder with 1 ml of solvent in a 1.7 ml eppendorf tube, and then centrifuged to pellet undissolved matrix. The supernatant of this matrix solution was used for sample preparation for MALDI analysis. Samples were loaded onto a target plate and mixed on the target with 1 μl of supernatant of saturated matrix solution. All the MALDI spectra were acquired in reflector mode, which was operated at 10,000 resolution over a mass range from 400 to 5000 Da.
2.12. Statistical analysis
To compare the number of CFU that were present in the various samples of the CSA-13 (Group 1) and the PDMS only (positive control, Group 2), the independent sample t test was used. Group 3 was not included as all of the CFU counts were 0. The t test was used based on the fact that in each case, the data sets from all samples in the two groups were normally distributed, the data were sampled independently, and Levene’s test of equality was statistically insignificant, suggesting that there was not a statistically significant difference in the variances of the two groups.
3. In vivo materials and methods
3.1. Stainless steel plates
SS plates were manufactured, cleaned, passivated, and dip coated in the same manner as they were for the in vitro analysis.
3.2. Biofilm growth
Biofilms were grown on the surface of PEEK membranes using the membrane biofilm reactor as they were for the in vitro analysis. However, for the in vivo work, after the 48-h growth period, all eight of the PEEK membranes containing MRSA biofilms were removed from the reactor, rinsed 3× in sterile PBS and transferred to 5 mL of dilute (10%) BHI broth. The biofilms were then transported to the surgical suite. Two surgeries were performed on any given surgery day, which required the use of four PEEK membranes (two per animal). At the end of each surgery day, the remaining four PEEK membranes were used to quantify the number of bacteria that were present on the membranes. Each PEEK membrane was found to have an average of 5.24 × 10⁹ ± 2.22 × 10⁹ (9.68 ± 0.19 when log10 transformed) CFU of bacteria. These numbers were not significantly different from the previously published numbers of bacteria that grew on these PEEK membranes [54].
3.3. Animal selection and grouping
All animal work was performed with approval from the Institutional Animal Care and Use Committee (IACUC) and the Environmental Health and Safety (EHS) department at the University of Utah. For this study, 2–3 year-old female Columbia Cross sheep, weighing 75±25 kg, were selected. This species of sheep had a flat area of bone on the proximal medial aspect of the tibia with a surface area that was suitable for securing of the plates with transcortical screws.
A total of n = 35 sheep were used in this study with n = 9 being treated with biofilm and PDMS only coated plates to serve as positive controls of infection (Group 1), n = 9 being treated with biofilm and PDMS with CSA-13 coated plates to serve as the treatment group (Group 2), n = 9 being treated with PDMS only coated plates and no bacteria to serve as negative controls of infection (Group 3) and n = 8 being treated with no biofilm and PDMS with CSA-13 coated plates to determine the effect of CSA-13 alone on host tissue (Group 4). For clarity, Table 1 provides an outline of the various animal Groups and treatments.
Table 1.
Outline of the various animal Groups and the type of coating that was present on the SS plates that were used in the sheep from each of the Groups.
| Animal Group | Treatment |
|---|---|
| Group 1 (n = 9) | Biofilm, PDMS only coated SS plates |
| Group 2 (n = 9) | Biofilm, CSA-13 coated SS plates |
| Group 3 (n = 9) | No biofilm, PDMS only coated SS plates |
| Group 4 (n = 8) | No biofilm, CSA-13 coated SS plates |
The n = 9 sheep in Group 3 and n = 8 sheep in Group 4 were treated with PEEK membranes that had been run through the membrane biofilm reactor without bacterial inoculation. Notably, there were originally n = 9 sheep in Group 4, but one gave birth to a lamb during the 12-week monitoring period and both animals were adopted out so that the ewe and lamb could remain together. Thus, only n = 8 sheep were used for Group 4.
3.4. Surgical procedure and postsurgical monitoring
The surgical and animal monitoring protocol was established and published previously in a pilot study [52]. The procedures that were followed in this study were the same as those followed in the pilot study.
Prior to surgery, the sheep were fasted for >12 h. Since the goal of this work was to develop a positive signal of infection (Group 1) and test the efficacy of CSA-13 (Group 2), no antibiotics were administered. Sheep were initially anesthetized using an intravenous (IV) injection of propofol (3–7 mg/kg) to allow for endotracheal tube intubation. Following intubation, the sheep were placed in the supine position and maintained under anesthesia with isoflurane to effect (ranged from ~2 to 3%). An IV catheter was placed in the left forelimb and 0.9% saline was administered at a rate of 10 mL/kg/h. Each sheep’s heart rate, temperature, carbon dioxide and oxygen levels, and respiration were monitored throughout the procedure.
The right hind limb of each sheep was circumferentially clipped free of hair/wool, from immediately above the hoof to the groin, and then scrubbed and prepped with Betadine and alcohol treatment. The hoof was isolated in a sterile rubber glove and wrapped with sterile VetWrap. After sterile draping, the proximal medial aspect of the leg and the region of the incision were treated with Chloraprep solution (catalog #B3063-88, Cardinal Health, Dublin, OH, USA) to further sterilize the skin.
An anterior midline sagittal incision was made from the region of the tibial tuberosity and extending distally, parallel to the anterior margin of the tibia. This incision was placed away from the plate and biofilm implantation site to avoid contamination of the site during wound healing. Dissection was carried medially and posteriorly, close to the bone, lifting the skin with the attached subcutaneous tissues from the surface of the medial tibial flare.
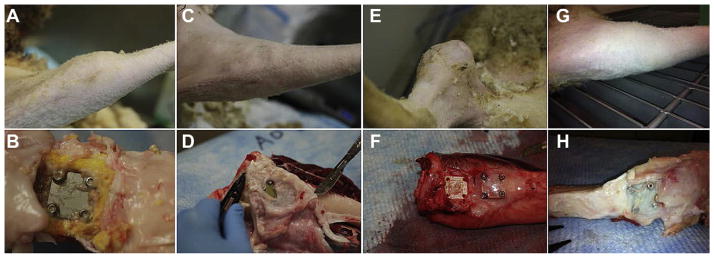
Since this study modeled a Type IIIB Gustilo open fracture—which may consist of periosteal stripping, bone exposure and massive contamination [60]— a 2 cm × 5 cm area of periosteum was removed from the proximal medial aspect of each sheep tibia (Fig. 2A). On the bare cortical surface, the positions of a proximal and distal plate were templated by sequentially drilling (Fig. 2B) and placing transcortical screws through each plate (Fig. 2C). The screws were not tightened at this stage. This technique allowed compensating for any irregularity in the “flat surface” of the tibia, tapped each hole and prevented thread stripping in the thin bone. This prepositioning avoided spurious contamination of the site when placing the infectious biofilm.
Fig. 2.

(A) Photograph taken during the surgical procedure. This particular image shows how the periosteum was removed from a 2 cm × 5 cm area of the proximal medial aspect of a sheep tibia using a periosteal elevator. (B) Photograph showing four holes that were sequentially drilled in the proximal medial aspect of a sheep tibia. (C) Photograph showing an SS plate that was secured to the cortical bone surface using cortical bone screws. The screws were inserted into the holes that were drilled as in (B). Recall that underneath the SS plate there was a PEEK membrane that either had biofilm on it or that did not have biofilm, depending on the animal Group. (D) Two SS plates were secured to the cortical bone surface of each sheep. One plate was used for microbiological analysis and the other was used for histological analysis. Both plates and both PEEK membranes had the same treatment in any given animal.
A PEEK membrane (with or without biofilm, depending upon the animal group) was aseptically removed from the 5 mL of BHI broth using sterile forceps. The corner of the membrane was touched against a sterile towel, removing excess broth but not biofilm, and preventing broth from contaminating the surgical field. The membrane was placed into the well of an SS plate.
Using careful, aseptic technique, the SS plate/PEEK membrane construct was placed in apposition to the tibia with the PEEK membrane residing between the bone and plate. Each plate was secured to the bone using 2.7 mm diameter × 10 mm length cortical bone screws (self tapping; catalog #ST270.10, Veterinary Orthopaedic Implants, St. Augustine, FL, USA). This process was performed twice in each sheep such that each sheep was treated with two PEEK membranes and two plates (Fig. 2D). The rationale for using two plates was to have one available for microbiological analysis and one for histological analysis at the end of the study. To the best of the surgeons’ ability, the two plates had a space of ~1 cm between them, however, anatomical variation existed amongst the sheep and not all were able to maintain exactly 1 cm of space between them.
After plate placement, a swab of the cortical bone surface was collected to determine if bacteria had already begun to dislodge away from the biofilm on the PEEK membrane. The surgical site was closed with interrupted 2-0 Vicryl (catalog #J339H, Ethicon, Cornelia, GA, USA) subcutaneous sutures and a running sub-cuticular 2-0 Proline (catalog #8533H, Ethicon) suture. A swab of the incision site was taken to determine if bacteria were present on the skin. Prior to wrapping the surgical site, the leg was cleaned with saline and isopropyl alcohol to kill bacteria that may have been present on the skin. This helped to reduce the risk of cross contamination throughout the animal facility and between animals.
For post operative analgesia, each sheep was given an epidural dose of morphine (0.1 mg/kg) and two fentanyl patches (100 μg/h) were placed in a shaved area on the left forelimb. An injection of flunixin (1.1 mg/kg) was administered to diminish inflammation. Post anesthesia monitoring extended until the animals could stand on their own, as well as eat and drink.
3.5. Surgical follow up
Throughout the course of the study, each sheep was monitored by the authors’ team and a veterinarian in the animal quarters to assess any symptoms of pain and distress. Under veterinary supervision, animals that showed signs of pain or distress were treated with Buprenex (0.01 mg/kg) or additional fentanyl patches. If excessive inflammation was present, they were further treated with Rimadyl (4.4 mg/kg).
Using a clinical grading system, based on the hallmarks of infection: calor (heat), rubor (redness), dolor (pain), and tumor (swelling), the sheep were monitored daily for a 12-week period for these signs of infection. A daily rectal temperature of each sheep was also taken. The animals were further monitored for limping, lethargy, irritability, and going “off feed” and/or water. Based on these criteria, a four tiered clinical grading system was established.
Grade I, or no infection, consisted of the signs of healing normally seen with surgical trauma and that resolved within one to two weeks of surgery. These signs included slight redness at the surgical site, mild warmth (to the touch), mild inflammation, a closed suture line, healed within 2 weeks, the sheep eating and drinking, a normal rectal temperature (for these sheep normal temperature was between 101.5 °F and 102.8 °F), and no signs of distress or limping. A Grade II infection included increased redness, a warmer surgical site with moderate inflammation, evidence of suture line dehiscence, irritable behavior, normal temperature and not limping. Sheep were euthanized if they displayed signs of a Grade III infection. This grade was characterized by significant redness and palpable heat at the surgical site, an open suture line with drainage, significant inflammation, tenderness, lethargy, fever, off feed and/or water, and positive bacterial growth on wound culture. A Grade IV infection was defined, but never allowed to develop in any of the animals. This included excessive heat, excessive inflammation, purulent drainage, implant exposure, excessive limping, local tenderness, off feed and/or water, lethargy, and fever.
3.6. Bone labeling
As stated by Bloebaum et al. [61], “Fluorochrome labeling is a well-established method of measuring the mineral apposition rate (MAR), at which osteoid matrix, produced by osteoblast cells, is deposited and mineralized to form new bone.”
In this study, calcein fluorochrome (catalog #C-0875, Sigma–Aldrich) was used as a non-antibacterial agent to label bone and to calculate the mineral apposition rate (MAR), i.e. the remodeling rate of the sheep bone. The method by which this works is after the calcein is injected, it is taken up by osteoblast cells and released into the collagen matrix of newly forming bone. After processing, calcein fluoro-chrome can be observed in tissue samples as they are imaged using an excitation wavelength of 495 nm and emission of 515 nm. The imaging that was performed in this study is described in the MAR Analysis section below.
Calcein was prepared in reverse osmosis water to a final concentration of 30 mg/mL. Approximately 1/3 of the final volume was sodium hydroxide due to the acidic nature of calcein. The pH was adjusted to 7.2–7.4, filtered using a 0.22 μm filter for sterility and the solution administered IV at 0.33 mL/kg of body weight. Two separate injections were given: one 16 days and one 5 days prior to the established endpoint of each sheep to create a double label in the bone. The infected sheep that were euthanized prior to the 12-week endpoint, or those that were euthanized early for another reason, did not receive calcein injection.
3.7. Euthanasia/gross photography/radiographs/microbiological sampling
Sheep were euthanized at the end of 12 weeks, or once a Grade III infection was determined to exist. To euthanize, animals were initially sedated with an IV injection of ketamine (5 mg/kg) and diazepam (0.5 mg/kg). Euthanasia was then performed by IV injection of beuthenasia D solution (1 mL/4.5 kg).
A swab of the incision site (~1 cm2 area) was taken and streaked onto Columbia blood agar for semi-quantitative analysis. More specifically, 1 + growth was defined as having growth in the first zone of streaking, 2 + having growth in the second zone and 3 + having growth in the third zone. The agar plate was incubated overnight at 37 °C. Next, the skin at and surrounding the incision site was prepped using chlorhexidine/isopropyl alcohol antiseptic. A scalpel was used to aseptically re-open the incision site and a swab of the subdermal tissue was collected to determine if bacteria had penetrated into the soft tissues superficial to the plates and PEEK membranes. This swab was also cultured on Columbia blood agar for semi-quantitative analysis.
Gross photography of the soft tissues and bone were collected throughout the sampling/dissection process. Radiographs were obtained using a cabinet x-ray system (Model 43855A, Faxitron X-Ray Corporation, Lincolnshire, IL, USA) set at 60 kV for 5 s, and processed with a Scan-X In-Line Eraser Digital Imaging System (Air Techniques, All Pro Imaging, Melville, NY, USA) with Faxitron DX software.
Following radiographs, one of the SS plates was randomly selected and the underlying PEEK membrane was removed and placed into 5 mL of 10% BHI broth. The PEEK sample was vortexed for 1 min, sonicated for 10 min and allowed to recover in the broth at room temperature for 20 min (to allow the bacteria to convert from the biofilm to planktonic phenotype) before performing a 10-fold dilution series on TSA. The density of bacteria in CFU/PEEK membrane was recorded for each PEEK membrane and then log10 transformed. An additional swab of the bone surface (~1/2 cm2) was taken to determine if bacteria had remained on the surface of the bone.
3.8. Tissue embedment/sectioning
After radiographic imaging, all of the soft tissue was dissected from the bone with the exception of the tissue that was directly over the undisturbed SS plate. The sample was then fixed in modified Karnovsky’s fixative using 3 × 24 h changes. The bone sample was placed in 70% ethanol for 3 × 24 h then dehydrated in a Tissue-Tek VIP (Miles Scientific) instrument using ascending concentrations of ethanol (from 70% to 80%–95% to 100%) and xylene. It was then placed into a solution of 80% methyl methacrylate (MMA; catalog #M55909-17L, Sigma, St. Louis, MO, USA) and 20% N-butyl (catalog #524980-4L, Sigma) (the combination of these two solutions is hereafter referred to as Solution A), and mixed for 5 days to infuse the tissues. After 5 days, Solution A was poured out and a fresh aliquot of Solution A, mixed with 2.5 g/L of Perkadox 16 (the catalyst for polymerization, catalog #AKZ16BG5CS, North American Composites, Los Angeles, CA, USA), was added to the sample. The sample was kept in a desiccator at 4 °C for 7 days. Finally, 5 g/L of Perkadox 16 was added to another batch of fresh Solution A and exchanged for the used mixture in the container and the sample was kept in a desiccator at 4 °C for an additional 9 days. Samples were then placed in a new container and Solution A with 5 g/L of Perkadox 16 was added and polymerized in 2 cm layers using ultraviolet light. Each layer required 48 h to fully polymerize. The final product resulted in a polymethyl methacrylate (PMMA) embedded sample containing the bone, PEEK membrane, SS plate and soft tissue regions.
Once embedded, tissue samples were cut using a band saw to remove excess PMMA and isolate the area of interest. Samples were further sectioned into ~2 mm sections using a diamond blade water saw. Radiographs of the sections were obtained following the same procedure outlined above. Five sections were obtained per plate. Two sections were ground and polished to an optical finish, gold coated and analyzed using SEM backscatter electron (BSE) imaging. The remaining three slides were mounted to plastic slides and ground to approximately 50–70 μm and analyzed with light microscopy for MAR and histopathological analysis.
3.9. SEM analysis
SEM analysis was performed using a JEOL-6100 LaB6 filament SEM to qualitatively examine bone morphology in the region where an SS plate/PEEK membrane and screws were implanted. Backscatter electron (BSE) images were collected to examine the varying levels of mineralization, how the infection influenced the periosteal response in bone, and cortical bone activity.
3.10. MAR analysis
The procedure for collecting MAR data was based on the published work of Bloebaum et al. In short, after sample sections ground to ~50–70 μm thickness, images were first collected using a mercury lamp Nikon Labophot microscope to detect the presence of calcein double-labeled osteons of the host bone. Three slides from each sheep were analyzed. From each slide, three osteons per slide were randomly selected in the cortical/periosteal bone region beneath an SS plate and a total of seven measurements were made along the span of each double label using ImagePro Plus software. An area of host bone that was not near the plate was also examined. The MAR of bone was calculated using the formula:
where Σx is the sum of all the measurements between double labels, e is the micrometer calibration factor (μm), (π/4) is the obliquity correction factor, n is the total number of measurements, and t is the time interval between calcein injections expressed in days.
3.11. Histology
For histological analysis, sample slides were further ground to a thickness of ~50 μm and stained with Sanderson’s Rapid Bone Stain (catalog #S-SRBS1, Dorn and Hart Microedge, Villa Park, IL, USA). To perform this staining procedure, Sanderson’s Rapid Bone Stain solution was warmed to 50–55 °C. Each slide was placed in the heated solution for 1 ½ minutes, rinsed in distilled water and dried with a wipe. To counter stain, each slide was placed in acid fuchsin (room temperature) for 15 s and dried with a wipe.
Macroscopic images of slides were collected using a Nikon DSLR Macro Camera (Nikon, Melville, NY, USA). Higher magnification images were collected using a Nikon Eclipse E600 microscope (Nikon Instruments Inc.). Using a modified histopathologic grading scale of Smeltzer et al. [62], a version of which has been used by our group previously [52], slides were examined to determine what level of osteomyelitis was present in the bone and or surrounding tissue regions. Osteomyelitis was indicated by the presence of bacteria, as determined by the microbiological analysis, in conjunction with chronic inflammation and bone necrosis/sequestra formation. Cortical bone growth/response was not a strong indicator of infection as it was present in the majority of sheep from all Groups. Thus, it appeared to be a normal bone response to the surgical trauma and implantation. The modified histopathological grading scale is provided in Table 2.
Table 2.
Histological parameters and scoring system.
| Intra- and peri-osseous chronic inflammation |
| 0 Not present |
| 1 Minimal to mild chronic inflammation with no significant fibrosis |
| 2 Moderate to severe chronic inflammation with no significant fibrosis |
| 3 Minimal to mild chronic inflammation with significant fibrosis |
| 4 Moderate to severe chronic inflammation with significant fibrosis |
| Bone necrosis |
| 0 No evidence of necrosis |
| 1 Single focus of necrosis without sequestrum formation |
| 2 Multiple foci of necrosis without sequestrum formation |
| 3 Single focus of sequestrum |
| 4 Multiple foci of sequestra |
| Cortical bone response |
| 0 No cortical bone response |
| 1 Cortical bone growth that does not extend beyond plate border |
| 2 Cortical bone growth that begins to extend beyond plate border |
| 3 Cortical bone growth that covers a plate part way |
| 4 Cortical bone growth that covers a plate entirely |
3.12. Pulsed field gel electrophoresis
To confirm that the MRSA bacterial isolate used for inoculation in this study was in fact the same isolate that was recovered by the various culture techniques that were performed at necropsy, pulsed field gel electrophoresis (PFGE) was used to examine deoxyribonucleic acid (DNA) banding patterns between the isolates. To perform PFGE, the original isolate and each cultured isolate were first confirmed to be S. aureus by latex agglutination then digested overnight at 27 °C using SmaI restriction endonuclease. Salmonella serotype Braenderup (H9812) was used as an internal standard. This internal standard isolate was digested overnight at 37 °C with XbaI. Gels were run using a CHEF DR-II system (Bio Rad Laboratories, Hercules, CA, USA) at 200 V and 14 °C. Initial switch time was 5 s and the final switch time was 40 s with a total run time of 21 h.
3.13. Statistical analyses
From a Kaplan–Meier survival curve, a Log–Rank test was used to examine the statistical significance in survival times between those sheep treated with biofilm and those that were not. A separate Log–Rank test was used to compare the time it took for animals in both groups to become infected. Time to infection differed from survival time since some sheep in Group 1 survived the full 12 weeks of the study, but displayed signs of infection very early on.
Because the number of bacteria collected from PEEK membranes were not normally distributed, the non-parametric Kruskal Wallis test was used for analysis, as opposed to an ANOVA, to compare the number of bacteria that were collected on the PEEK membranes of the animals. In all instances, an alpha level of 0.05 was established to define statistical significance. All statistical data was analyzed using SPSS 17.0 software.
4. In vitro results
4.1. Dip coating
Plates that were coated with PDMS only (Fig. 3A) had a final coating weight of 71.4 ± 14.6 mg and a thickness of 97 ± 18 μm. In contrast, plates that were coated with PDMS/CSA-13 (Fig. 3B) had a coating thickness of 113 ± 22 μm and a final coating weight of 96.3 ± 9.7 mg. The amount of CSA-13 per plate was calculated to be 17.2 ± 0.61 mg. Notably, the increase in coating thickness of plates that were dipped in the PDMS/CSA-13 suspension compared to those that were dipped in the PDMS only suspension was believed to be due to the fact that the PDMS/CSA-13 suspension was thicker (more viscous) with the CSA-13 added to it, which appeared to have led to a slight increase in the amount of solution adhering to the plates.
Fig. 3.
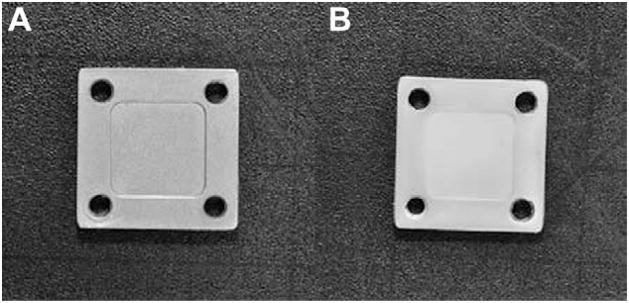
(A) SS plate coated with PDMS only after being dipped in the 1:1 naphtha:PDMS dispersion, cured for 7 days and sterilized by ETO. (B) SS plate coated with the 1:1 naphtha:PDMS + 18% w/w CSA-13 dispersion, cured for 7 days and sterilized by ETO. The slight jaggedness that can be seen in the inner edges of the holes is due to the prongs that were used to hold the plates in place on the spinning wheel as they cured. These plates had a white tint to them due to the presence of CSA-13, which comes as a white powder.
4.2. Biofilm quantification
A total of n = 36 PEEK membranes from 18 different runs of the biofilm reactor were used to quantify the CFU/PEEK membrane in order to obtain a baseline of cells on each membrane. Results showed that, similar to previously published data, there were 9.41± 0.35 log10 CFU/PEEK membrane [54].
4.3. Efficacy of CSA-13 in thin films
Over the 24-h period that the 10% BHI broth was flowed through the flow cells, there were 107 ± 6 mL of broth that flowed through each of the chambers. Results from the samples that were in chambers with PDMS only coated plates showed that there was a slight decrease in the number of CFU/PEEK membrane compared to the number of CFU/PEEK membrane that were quantified immediately after the 48-h growth period in the biofilm reactor. More specifically, there were 7.75 ± 0.75 log10 CFU/PEEK membrane that were quantified on membranes after 24 h of exposure to PDMS only coated plates (Fig. 4A). This difference was statistically significant (p < 0.05).
Fig. 4.

(A) Results from the quantification of bacteria that were exposed to SS plates coated with PDMS only. These data are presented in log10 transformed numbers of CFU/PEEK membrane, CFU/ml of broth, CFU/SS plate and CFU/g of bone tissue. (B) Results from the quantification of bacteria that were exposed to SS plates coated with PDMS/CSA-13.
The broth samples from the chambers and bottles that were collected with the PDMS only coated plates had an increase in the number of CFU/mL of broth at each time point (Fig. 4A). By 24 h, there were 8.19 ± 0.20 log10 CFU/mL of chamber broth and 6.46 ± 1.89 log10 CFU/mL of bottle broth.
Results indicated that those biofilms on PEEK membranes which were exposed to plates coated with PDMS and CSA-13 had greater than an 8 log10 reduction of bacteria on the surface over a 24-h period (Fig. 4B). More specifically, there were 0.50 ± 0.75 log10 CFU/PEEK membrane after 24 h. When compared to the number of bacteria that were on the PEEK membranes used for quantification, the difference was statistically significant (p≪0.05). The broth samples collected from chambers that had CSA-13 coated plates had no detectable amounts of bacteria after 24 h in the broth from the chamber or from the bottles (Fig. 5B). There were 0.22 ± 0.67 log10 CFU/SS plate detected.
Fig. 5.

Release profile of CSA-13 out of the PDMS coating over a five-day period. The overall % release of CSA-13 is noted at each day.
Interestingly, the number of bacteria in the bone samples exposed to CSA-13 increased over the 24-h period, with 3.49 ± 1.42 log10 CFU/g of tissue being detected in the first 4 h and 5.27 ± 1.52 log10 CFU/g of tissue being detected after 24 h (Fig. 4B). This was believed to be due to an interaction of the positively charged CSA-13 with the negatively charged components of the bone.
However, there were ~3 log10 more CFU in the bone samples from chambers with PDMS only coated plates compared to those bone samples that were in the chambers with CSA-13 coated plates. Specifically, after 24 h, there were 8.41 ± 1.08 log10 CFU/g of bone in the PDMS only group, versus 5.27 ± 1.52 log10 CFU/g of bone in the CSA-13 treated samples. This difference suggested that CSA-13 had significantly greater efficacy than no CSA-13 at all. This difference was statistically significant (p < 0.05), as were all of the differences in bacterial numbers between each of the samples in the positive control group and the treatment group. There was no growth in any of the samples that were tested without a bacterial inoculum, which confirmed that the process could be performed aseptically.
4.4. Short term elution kinetics
Elution kinetics results indicated that although there was a reduction in the overall μg/mL of CSA-13 from 4 h to 24 h in the chamber broth and in the bottle broth, there was no significant difference in the overall % release of CSA-13 (see Table 3), which was indicative of zero-order release. This was likely due to the fact that CSA-13 was saturated in the solution during that time. In addition, over time, it appeared that CSA-13 molecules may have accumulated in the bone samples and the molecules were likely interacting with the bacterial cells that were present, which may explain the slightly lower overall % release at 24 h compared to 4 and 8 h. The overall % release was calculated using the total volume of broth that had flowed through the flow cell over 24 h. By 24 h, 107 ± 6 mL of broth had flowed through each of the chambers and into the effluent bottles and there were approximately 15 mL of broth in the chambers. No CSA-13 was detected in the broth from those chambers that had PDMS only coated plates.
Table 3.
LC/MS data and overall % release calculated from each of the broth samples at 4, 8 and 24 h of sample collection. The data showed that there was a decrease in the μg/ml of solution over time, but that during the first 24 h, there was zero-order release kinetics of the overall % release.
| Broth sample | μg/mL | Overall % release |
|---|---|---|
| 4 hour chamber | 66.56 ± 32.4 | 8.8 ± 4.1 |
| 4 hour bottle | 16.66 ± 12.48 | |
| 8 hour chamber | 57.37 ± 36.89 | 8.5 ± 3.7 |
| 8 hour bottle | 19.35 ± 12.62 | |
| 24 hour chamber | 23.68 ± 18.86 | 8.1 ± 3.9 |
| 24 hour bottle | 9.38 ± 5.25 |
4.5. Long term elution kinetics/residual antimicrobial kill
Long term elution data indicated that the release of CSA-13 declined in a first-order fashion over the first five days (Fig. 5). After five days, the detection limit of the particular LC/MS technique used in this study was surpassed as the broth samples contained less than 0.5 μg/mL of CSA-13 thus only five days of data are presented. In this portion of the study, by 24 h there were approximately 13 μg/mL of CSA-13 in the broth that was collected and by day 5 there were approximately 0.69 μg/mL.
Table 4 presents the data that was collected by testing the residual antimicrobial efficacy of the broth that was collected during the long term elution kinetics study. These data indicated that over the first 10 days, there were sufficient amounts of CSA-13 in the broth samples to reduce the number of bacteria by greater than 3 log10 units (from 105 to 102 CFU/mL). By day 12, there was a noticeable increase in the number of CFU/mL indicating that the concentration of CSA-13 in the broth had dipped below bactericidal levels.
Table 4.
Data outlining the number of log10 transformed bacteria/mL that were present in the broth samples collected over 15 days of the long term elution study. These data suggested that for the first 10 days of release, the amount of CSA-13 in the broth samples was sufficient to reduce a 105 inoculum to less than 102 in a 24-h period. By day 12, the number of bacteria increased to greater than ~106 cells/mL, suggesting that by that time, the levels of CSA-13 began to decrease to below bactericidal concentrations. Each day of release represented an n = 5 broth samples from the n = 5 plates that were used for the long term elution study.
| Day | Log10 CFU/ml |
|---|---|
| 1 | 0 ± 0 |
| 2 | 0 ± 0 |
| 3 | 0 ± 0 |
| 4 | 0 ± 0 |
| 5 | 0.82 ± 1.21 |
| 6 | 0.92 ± 1.31 |
| 7 | 1.75 ± 1.88 |
| 8 | 0.22 ± 0.61 |
| 9 | 0.92 ± 1.31 |
| 10 | 1.79 ± 1.89 |
| 11 | 2.70 ± 3.09 |
| 12 | 6.52 ± 6.91 |
| 13 | 7.14 ± 6.97 |
| 14 | 6.18 ± 6.51 |
| 15 | 6.52 ± 6.91 |
4.6. Extraction analysis
MALDI/TOF analysis indicated that no detectable amounts of PDMS material were present in any of the broth samples tested.
In summary, the results from all of the in vitro data suggested that when used as the active release agent of this coating technology, and at an 18% w/w concentration, CSA-13 would have the ability to reduce the number of bacteria in MRSA biofilms to a level that could be handled by a host. In this case, the host was a sheep.
5. In vivo results
5.1. Dip coating
Plates that were coated specifically to be used in the in vivo portion of this study had slightly different, but not statistically significantly different, weights compared to those that were coated for in vitro analysis. Those coated with PDMS only had a final coating weight of 73.0 ± 6.4 mg and a thickness of 83 ± 12 μm. In contrast, plates that were coated with PDMS/CSA-13 (Fig. 3B) had a coating thickness of 120 ± 5 μm and a final coating weight of 93.9 ± 13.4 mg. The amount of CSA-13 per plate was calculated to be 17.49 ± 0.53 mg.
5.2. Surgical follow up
A survival curve including each of the 35 sheep in this study was plotted using a Kaplan–Meier survival curve (Fig. 6A). The reason that one sheep in Group 1, two sheep in Group 2 and three sheep in Group 3 went slightly longer than the 12-week endpoint was due to logistical reasons for euthanasia.
Fig. 6.

(A) Kaplan–Meier survival curve outlining the number of weeks that each sheep survived during the course of the study. (B) Kaplan–Meier curve indicating the time it took for each sheep to show signs of infection.
Three of the nine sheep in the positive control group (Group 1) were euthanized early due to a Grade III infection. Two other sheep in Group 1 were euthanized just days prior to the 12-week endpoint, due to the fact that each of them had their surgical leg break during routine observation. Both of these breaks occurred near the inferior plate in the sheep and it was believed that these breaks occurred as a result of osteomyelitic bone that had been weakened. These five sheep in Group 1 that were euthanized early did not receive a double label of calcein. The two sheep that had their legs break and the remaining four sheep in Group 1 that survived to the 12-week endpoint each displayed Grade II signs of infection during the monitoring period. Furthermore, each of the nine sheep in Group 1 displayed signs of inflammation and abscess formation, i.e. infection, between day 3 and 18 after surgery.
Eight of nine sheep in Group 2 survived to the 12-week endpoint with minimal acute inflammation that resolved within the first week or two following surgery with no signs of infection at any point in the study. One sheep from Group 2 was euthanized at 5 weeks due to a chronic limp that was not related to infection, but rather it appeared to have a small, incomplete fracture that may have developed during surgery. This sheep did not receive a calcein double label.
One sheep from Group 3 had a large abscess develop 11 days following surgery and was euthanized as it displayed signs of a Grade III infection. This sheep likewise did not receive a calcein label. The remaining eight sheep in Group 3 showed no signs of infection and their acute inflammation resolved within one or two weeks following surgery. All sheep in Group 4 survived to the 12-week endpoint with minimal acute inflammation that resolved within one to two weeks following surgery.
The Log–Rank test indicated that there was no statistically significant difference in survival times between any of the groups (p = 0.137). There was no statistically significant difference in the time to infection for Group 2, Group 3 and Group 4 (p = 0.651; Fig. 6B), but there was a difference in the time to infection between Group 1 and all other Groups (p = 0.000) (Fig. 6B). These differences corroborated with the microbiological data.
5.3. Microbiology
From the swabs that were taken of the subdermal tissues immediately after the SS plates had been secured to the bone during surgery, it was found that MRSA bacteria were released from the biofilm onto the bone surface and into the surrounding tissues within minutes after inoculation for Groups 1 and 2. No bacteria were cultured from those sheep in Group 3 or Group 4 at the time of surgery.
At necropsy, microbiological data showed that all sheep had between 1+ and 2 + growth of bacteria on their skin near the incision site area. These were normal flora bacteria. All sheep in Group 1 had between 2+ and 3 + growth in the subdermal tissues. No sheep in Group 2 or Group 4 had growth in the subdermal tissue. Interestingly, the one sheep from Group 3 that had a large abscess and soft tissue infection had no growth by culture. It was concluded that the infecting organism was not culturable by the methods used in this study. However, the clinical indications suggested that the tissue was highly infected and the histology showed that this tissue had significant inflammation and necrotic tissue indicative of infection.
PEEK membranes collected from Group 1 sheep contained an overall log10 density of 6.11 ± 0.89 CFU/PEEK membrane. No bacteria were detected on the PEEK membranes of Group 2 or Group 4 sheep. There was no growth on the PEEK membrane of the sheep in Group 3 that had a soft tissue infection. However, a different sheep from Group 3 had 2.39 log10 CFU of Alloiococcus otitis and Corynebacterium on a PEEK membrane at the time of necropsy, but that sheep did not show signs of infection during the 12-week monitoring period. When compared using a Kruskal Wallis test, it was found that there was no statistically significant difference in bacterial numbers from PEEK membranes between Group 2, Group 3 and Group 4 (p = 0.389), whereas there was a difference between Group 1 and all other Groups (p = 0.000 in each case).
These data indicated that the microbiological findings correlated with the clinical observations of the sheep, wherein those treated with biofilm and no CSA-13 (Group 1) suffered a Grade II or higher infection, and those treated with biofilm and CSA-13 (Group 2) did not suffer from infection, only one sheep from Group 3 suffered a soft tissue infection and no sheep in Group 4 developed infection.
Notably, when removing the SS plates for microbiological analysis, it was observed that in each of the Group 1 sheep, the bone screws had become completely loose and in three animals the plates had lifted off the surface of the bone. This was due to bone resorption around the screws, which was a result of infection as indicated by SEM analysis and histological results (see SEM and Histology results). No screws or implants came loose in sheep from Groups 2, 3 or 4.
It was interesting to observe that in Group 2, Group 3 and Group 4 sheep, the cortical bone began to grow on/attach to the PEEK membranes, which made it difficult to remove them for quantification. In contrast, the PEEK membranes in the infected sheep had no attachment of bone to them and were easily removed.
5.4. Pulsed field gel electrophoresis
Using PFGE analysis, it was confirmed that all of the MRSA isolates that were cultured from sheep in Group 1 were the same as those that were used as initial inocula.
5.5. Gross photography/radiography
Gross photographs of the sheep limbs provided evidence that an abscess formed in the surgical area of Group 1 sheep (Fig. 7A). No abscess formation was seen in sheep from Group 2 or Group 4 (Fig. 7C and G) and only one had an abscess form in Group 3 (Fig. 7E). Furthermore, signs of infected tissue, including pus and significant inflammatory and cortical bone response, could be seen in Group 1 sheep once the skin was resected (Fig. 7B). In contrast, only a thin membrane of tissue grew over the plates in Group 2 (Fig. 7D), Group 3 (Fig. 7F) and Group 4 (Fig. 7H) sheep with minimal periosteal/cortical bone response.
Fig. 7.
(A) Photograph of an abscess that was present in the proximal medial aspect of a sheep tibia from Group 1. (B) Photograph of the subdermal tissue of a sheep from Group 1. Note the presence of necrotic and inflammatory tissue (brown next to plate). The yellow tissue was indicative of callus formation. (C) Photograph of the proximal medial aspect of a sheep tibia from Group 2. (D) Photograph of the subdermal tissue in a sheep that was treated with CSA-13. The yellowing of the plate was likely due to the calcein green that was injected. A thin membrane of tissue had grown over the plates. (E) Photograph of the abscess that was present in the one sheep from Group 3 that had a soft tissue infection. (F) Photograph of the subdermal tissue in a sheep from Group 3. One plate had been removed prior to this picture being taken, but note the thin fibrous membrane that was still intact over the other SS plate. (G) Photograph of a tibia from a sheep in Group 4. The legs of these sheep looked the same as those from Group 2. (H) Photograph of a dissected tibia from a sheep in Group 4. Note the thin membrane of tissue that grew over the SS plates. The plates in these sheep had a yellowing effect as did those in Group 2.
All 17 sheep that were treated with CSA-13 had what appeared to be areas of coagulated blood underneath the SS plates (Fig. 8). It was hypothesized that this blood coagulated due to the fact that CSA-13 had a slight hemolytic effect as it eluted in a bolus dose initially. The pressure from securing the SS plates to the bone may have then entrapped some of the hemolyzed/coagulated blood underneath the plate.
Fig. 8.
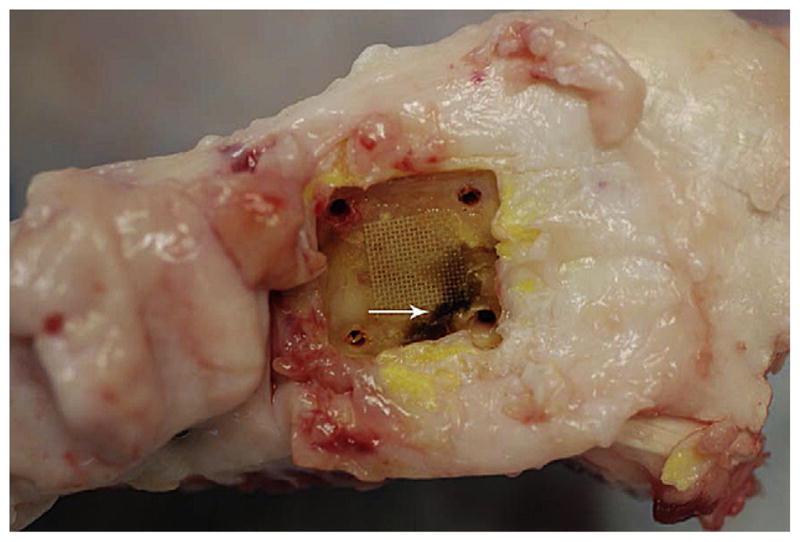
Representative photograph of a dissected tibia from a sheep in Group 2. An SS plate had been removed and a PEEK membrane can be seen on the surface of the bone. The dark area (arrow) indicated coagulated blood. Note that it was present under those regions of the plate that were compressed by the cortical screws.
Radiographic evidence also suggested that in Group 1 sheep, “moth eaten,” osteomyelitic bone was visible (Fig. 9A). This result was particularly apparent in the microradiographs that were taken of bone sections after they had been embedded and cut (Fig. 9B). From these sections a significant cortical bone response and an endosteal response indicative of osteomyelitis and responsive new bone formation could be seen in Group 1 sheep. No such response was seen in Group 2 (Fig. 9C and D), Group 3 (Fig. 9E and F) or Group 4 (Fig. 9G and H).
Fig. 9.

(A) Radiograph of the tibia of a sheep from Group 1 that suffered from osteomyelitis. This radiograph is from one of the sheep that broke its leg during a routine checkup. Note the “moth eaten” bone in the inferior and superior regions of the SS plates (arrows). (B) Microradiograph of a bone section (Group 1 sheep) that was cut after it had been embedded in PMMA. This radiograph provides evidence for why the bone screws were loose in Group 1 sheep; the screws had lost contact with the host bone. The infection had caused the screws to come loose, and contributed to resorption of bone throughout the cortical bone regions, which led to the “moth eaten” appearance. (C) Radiograph of a tibia from a sheep that was treated with CSA-13 coated plates (Group 2). (D) Microradiograph of a bone section from a sheep treated with CSA-13 coated plates. Areas of “C” shaped resorption can be seen near both screws. (E) Radiograph of a tibia from a sheep in Group 3. (F) Microradiograph of a bone section from a sheep in Group 3. (G) Radiograph of a tibia from a sheep in Group 4. (H) Microradiograph of a bone section from a sheep in Group 4. In this Group of sheep, the “C” shaped areas of resorption were less noticeable compared to sheep in Group 2.
These radiographs indicated areas of resorption near the screws of sheep in Group 2 that were treated with CSA-13 and biofilm. Specifically, areas of bone resorption were seen below the SS plates and near the screws forming “C” shaped areas of radiolucencies (Group 2; Fig. 9D).
5.6. SEM analysis
In Group 1 sheep, BSE images indicated that there was a considerable amount of bone resorption directly underneath the SS plates. This resorption led to the formation of a single focus of sequestrum or multiple foci of sequestra, which was commonly seen in these bone regions of sheep from Group 1 (Fig. 10A). Resorption was also seen near the bone screws in Group 1 sheep (Fig. 10B), which supported the observation mentioned previously that these screws were loose. Bone resorption that occurred in this Group of sheep appeared to accompany the presence of infection. There were no screws loose in Group 2 or Group 4 sheep and no sequestrum formation was observed underneath the SS plates (Fig. 10C and G).
Fig. 10.
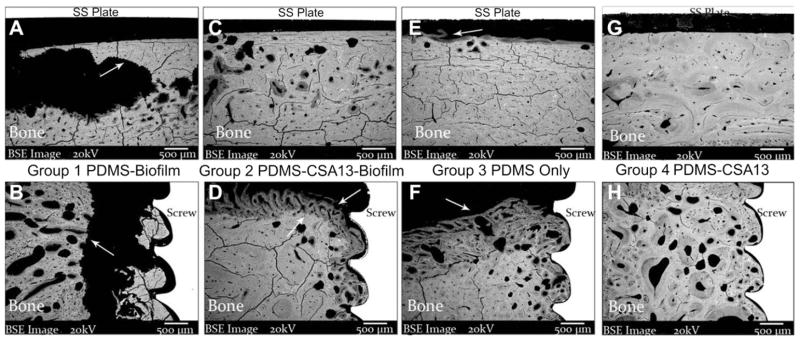
SEM images of bone directly underneath SS plates and near cortical bone screws in sheep from each Group (all 30× original magnification). (A) SEM micrograph of the cortical bone surface directly underneath an SS plate that was from a sheep in Group 1. The arrow indicates an area of significant resorption that likely prefaced the formation of a sequestrum in the periosteal region. Resorption was indicated by the presence of jagged bone edges as a result of osteoclast activity and infection (as will be seen in the Histology section). Cracks that can be seen in the bone were an artifact of processing. (B) SEM micrograph of an area near a bone screw in a sheep from Group 1. The arrow again indicates an area of resorption. Note the presence of bone chips next to the screw and the gap between the bone chips and the resorbed bone surface. This gap provided an indication as to why the screws were loose in Group 1 sheep. (C) SEM micrograph of a cortical bone surface underneath an SS plate from a sheep in Group 2 (CSA-13 treated). The bone surface itself looked healthy and had no signs of resorption in the area where bacteria had been placed. (D) The arrow that is facing up in this SEM micrograph indicates the jagged border to which bone resorption had occurred whereas the arrow that is facing down points to new bone that was forming. The screw threads were in close contact with the bone surface. (E) SEM micrograph of the cortical bone surface underneath an SS plate that had been coated with PDMS only. Minor areas of remodeling were seen in this region of sheep from Group 3. (F) SEM micrograph of a bone region from a sheep in Group 3. Bone remodeling was seen (arrow), but there were no indications that resorption had occurred as it had in Group 2 sheep. The remodeling in this bone was likely a result of surgical trauma, and the bone grew close to the screw surface. (G) SEM micrograph from a sheep in Group 4. There were no signs of sequestra formation underneath the SS plates in this Group of sheep. (H) SEM micrograph of a region near a cortical bone screw from a sheep in Group 4.
Notably, the resorption that occurred near the screw regions in those sheep from Group 2 did not appear to accompany infection. In contrast, in those regions where resorption was seen to have occurred by radiographic analysis, the SEM data indicated that new bone was forming in those regions (Fig. 10D and H). Thus, new bone was able to replace and repair the bone that had been resorbed. This suggested that although the bone had resorbed away, it did not appear to adversely affect new bone growth, integration with the screw threads or the overall success of the implants and coating.
In Group 3 sheep, areas of minimal remodeling were seen directly underneath the SS plates (Fig. 10E) and bone remodeling was seen near the screws (Fig. 10F). There were no indications that the bone had resorbed away in the regions near the screws in Group 3 or in Group 4 sheep as it did in those sheep from Group 2. Rather, it appeared that the bone remodeling that occurred in Group 3 and Group 4 sheep was related to the surgical procedure.
A much larger gap was seen between the cortical bone surface and SS plates of Group 1 sheep when compared to Group 2, Group 3 or Group 4. More specifically, the distance from the bone to the plate surfaces in Group 1 was ~1179 ± 1257 μm. In Group 2, Group 3, and Group 4, the gaps were 316 ± 382 μm, 456 ± 313 μm and 304 ± 483 μm, respectively. As will be seen in the histopathological results, the larger gap in Group 1 sheep was due to the presence of significant fibrous tissue formation and chronic inflammation. Notably, these data were collected only from sheep that survived to a 12-week endpoint.
5.7. MAR analysis
MAR results were collected from n = 4 sheep in Group 1, n = 8 in Group 2, n = 8 in Group 3 and n = 7 in Group 4. For sheep in Group 1, the average bone remodeling rate directly underneath the SS plate was 1.71 ± 0.12 μm/day. In Group 2 sheep the average rate was 1.53 ± 0.32 μm/day, in Group 3 sheep the average was 1.31 ± 0.15 μm/day and in Group 4 sheep the average was 1.46 ± 0.16 μm/day. Images of double labels in the periosteal regions of Group 1 sheep showed that an intense remodeling response was present (Fig. 11A). However, typical double labels of osteoids were seen in the cortical bone regions (Fig. 11B). No significant response was seen in the periosteal regions of sheep in Group 2 and osteoid structures were present in the cortical bone region indicative of remodeling (Fig. 11C and D). A similar response as Group 2 was seen in Group 3 sheep (Fig. 11E and F) and this same response was seen in Group 4 sheep. Notably, calcein double labels further indicated bone viability.
Fig. 11.
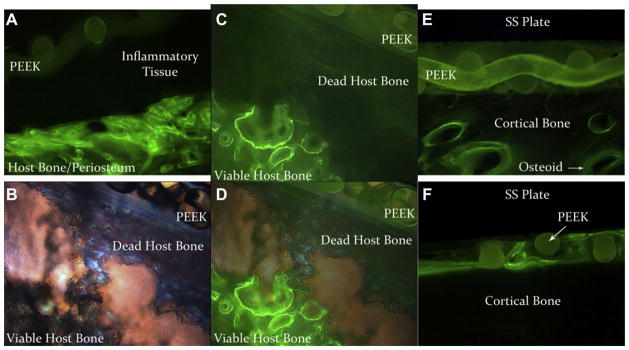
(A) Fluorescent microscope image of calcein double labels that were present in the periosteal region directly underneath an SS plate of a sheep from Group 1. Initially, the PEEK membrane that had biofilm grown on it was placed in apposition to the host bone. Inflammation and fibrous capsule formation caused the PEEK membrane and the SS plate to lift off the surface of the bone. Periosteal growth in Group 1 sheep was highly responsive as a result of infection. (B) Polarized light image of a sequestrum in a sheep from Group 1. (C) Same image as in (B), but with fluorescent double labels. (D) Combined image of (B) and (C). Areas of viable bone and dead bone are labeled. Viable areas are indicated by the presence of calcein labels whereas dead bone is void of double labels. The PEEK membrane can be seen in apposition to the dead host bone. (E) Fluorescent microscope image of calcein double labels in the periosteal/cortical bone region of a sheep from Group 2. Note the lack of periosteal response and typical osteoid growth despite the fact that bacteria had been present on the PEEK membrane. (F) Fluorescent microscope image of the periosteal/cortical bone region of a sheep from Group 3. This image demonstrates how the bone grew throughout the interstices of the PEEK membrane without any significant periosteal response.
5.8. Histology
Compared to Table 2, the histological sections from each of the four animal Groups displayed distinct morphologies of soft tissue and bone response to the various treatment methods (Table 5). Foremost, seven sheep from Group 1 showed clinical signs of Grade III osteomyelitis that were confirmed by chronic inflammation, significant fibrous encapsulation near screws and plates, and necrotic bone with sequestra formation (Table 5). The two sheep in Group 1 that were euthanized after one week had not yet displayed significant signs of inflammation, necrotic bone or sequestra formation likely due to the shortness of time that they survived, but they had positive growth by culture and displayed significant clinical signs of Grade III infection. None of the sheep in Group 2 or Group 4 showed signs of osteomyelitis and as mentioned, only one sheep in Group 3 had a soft tissue infection.
Table 5.
Results of comparing the histological sections of each sheep to Table 2. These results indicated that inflammation was present in sheep from all groups, with the highest level of inflammation being present in Group 1 sheep. Furthermore, bone necrosis was only seen in sheep from Group 1. A cortical bone response was also seen in sheep from each group, but this was a normal response to surgical trauma.
| # of sheep from Group 1 | # sheep from Group 2 | # sheep from Group 3 | # sheep from Group 4 | |
|---|---|---|---|---|
| Inflammation | ||||
| 0 | 0 | 1 | 5 | 1 |
| 1 | 2 | 4 | 3 | 6 |
| 2 | 0 | 3 | 1 | 0 |
| 3 | 3 | 1 | 0 | 1 |
| 4 | 4 | 0 | 0 | 0 |
| Bone necrosis | ||||
| 0 | 2 | 9 | 9 | 8 |
| 1 | 0 | 0 | 0 | 0 |
| 2 | 2 | 0 | 0 | 0 |
| 3 | 0 | 0 | 0 | 0 |
| 4 | 5 | 0 | 0 | 0 |
| Cortical bone response | ||||
| 0 | 2 | 2 | 3 | 1 |
| 1 | 3 | 1 | 5 | 6 |
| 2 | 2 | 4 | 0 | 1 |
| 3 | 1 | 1 | 0 | 0 |
| 4 | 1 | 1 | 1 | 0 |
Sections stained with Sanderson’s bone stain showed that there was an observable difference between the bone/implant interface of Group 1 compared to Group 2, Group 3 and Group 4 sheep (Fig. 12). In three sheep from Group 1, chronic inflammation caused SS plates to be completely lifted off the surface of the cortical bone (Fig. 12A). Multiple foci of sequestra were found in Group 1 sheep, particularly in the region directly underneath the SS plates (Fig. 13A). No sequestra and less inflammation was seen in the same regions of sheep from Group 2, Group 3 and Group 4 (Fig. 13C, E & G). In addition, bone resorption commonly accompanied inflammation in the screw regions of Group 1 sheep (Fig. 13B). In contrast to what was seen in Group 1 sheep, bone remodeling was observed near the screws as opposed to resorption in those sheep from Group 2, Group 3 and Group 4 (Fig. 13D, F & H). Histological analysis of bone sections further indicated that new bone growth was present in those regions wherein resorption had occurred near the screws of sheep in Group 2 (Fig. 13D). Notably, there was no observable difference in bone or soft tissue morphology between sheep from Group 3 and Group 4, suggesting that CSA-13 alone had no adverse effect to bone remodeling or the overall health of the soft tissues.
Fig. 12.

(A) Macroscopic image of a bone section from a sheep in Group 1. This section was stained with Sanderson’s bone stain and highlights the presence of infected bone, chronic inflammation, significant bone resorption and shows how an SS plate was lifted off the surface of the cortical bone. (B) Macroscopic image of a bone section from a sheep in Group 2. Note the lack of inflammation directly underneath the SS plate despite the fact that billions of bacteria had been placed there initially. As was seen in the radiographs, there was a “C” shaped area of resorption near the screws, yet the dark pink bone indicated that new bone was forming in those regions. (C) Macroscopic image of a bone section from a sheep in Group 3. (D) Macroscopic image of a bone section from a sheep in Group 4.
Fig. 13.
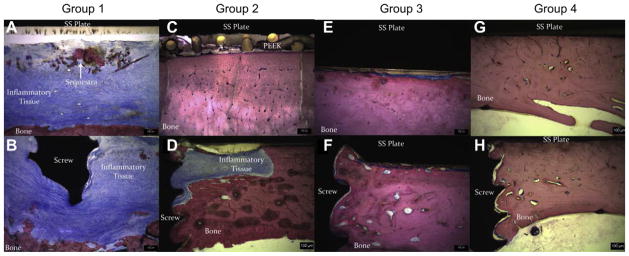
Images taken of bone sections that were processed from sheep in each of the four Groups. Each section was stained with Sanderson’s bone stain. The micron bar is 100 μm in each case. (A) Image taken from directly underneath an SS plate of a sheep in Group 1. Multiple foci of sequestra were seen along with significant inflammation and bone resorption on the cortical bone surface. (B) Additional image taken near a screw region in a sheep from Group 1. This area also showed significant chronic inflammation and bone resorption in the cortical bone regions. (C) Image taken directly underneath an SS plate from a sheep in Group 2. Note the lack of inflammatory cells, sequestra formation and fibrous capsule. (D) Image of a screw region from a sheep in Group 2. The area where bone resorption occurred and that was being filled in by new bone can be seen. (E) Image taken from directly underneath an SS plate that was in a sheep from Group 3. Few inflammatory cells and a thin fibrous capsule can be seen. This was common in all sheep treated with PDMS only coated implants. (F) Image of a screw region in a sheep from Group 3. There were few inflammatory cells and minimal fibrous capsule formation. (G) Image from underneath an SS plate that was in a sheep from Group 4. No sequestra were seen and no inflammation was found in this particular section. (H) Image taken from a screw region in a sheep of Group 4. The bone integrated well with the screw threads and there was little to no inflammation seen in this section.
Taken together, the results of the animal work indicated that CSA-13 had the ability to prevent osteomyelitis in 100% of sheep from Group 2 that were treated with biofilm and SS plates that contained the CSA-13 coating. Importantly, 100% of sheep from Group 1, which were treated with biofilm and PDMS only coated plates, did develop infection. One of nine sheep in Group 3 became infected and no sheep in Group 4 became infected. Results further suggested that those tissues exposed to CSA-13 did not appear to be adversely affected.
6. Discussion
Active release coatings for biomaterial devices have had limited clinical success. In order to address the limitations that have potentially contributed to this lack of success, this study initially performed in vitro testing using a flow cell system to model the flow of fluids in a physiological environment. Furthermore, an antimicrobial compound, CSA-13, was used as the active release agent of an active release coating as opposed to a traditional antibiotic compound. Well-established biofilms were used for the in vitro analysis and as initial inocula in the animal model. Overall it appeared that the in vitro work, wherein the CSA-13 coating reduced the number of bacteria in biofilms by greater than 8 log10 units in a 24-h period, translated to the in vivo work, wherein 100% of sheep from Group 2 were free of infection. Thus, at an 18% w/w concentration, CSA-13 appeared to reduce the number of bacteria in the biofilms to a level that could be handled by the host.
Using biofilms as initial inocula addressed the previous three limitations [31] that may accompany the use of planktonic bacteria in animal models of infection, such as those that are designed to develop combination products of biomaterial coatings and other antimicrobials. 1) Planktonic cells may be cleared by the immune system more readily than cells residing in a biofilm. Thus, when planktonic cells are used in in vivo models, it may be that they are eradicated before they can form biofilms. As mentioned, this may contribute to the low reproducibility for the induction of osteomyelitis. 2) It is becoming ever more evident that planktonic bacterial cells are more susceptible to antibiotics than those residing in a biofilm [63]. If antibiotics are administered prophylactically immediately following inoculation, they may affect planktonic bacteria more effectively and rapidly than they would biofilm bacteria. 3) When planktonic bacteria are added to the body, the possibility exists for them to be dispersed rapidly away from the site of initial inoculation due to the presence of flowing fluids in the body. This could dilute the concentration of bacteria per given area—potentially making it easier for the body to handle the bacterial load and prevent attachment to tissue or a medical device. Despite these limitations, the investigators acknowledge that the use of planktonic or biofilm bacteria is application dependent and there are multiple methods of developing infection that can benefit chronic biofilm-related infection studies.
Notably, osteomyelitis developed in all (100%) sheep from Group 1 (positive control) of this study, whereas 0% (0/9) of sheep in Group 2 (treatment group) became infected. As such, the hypothesis that CSA-13 would prevent biofilm implant-related infection from developing was supported. This contrast of 100% vs. 0% infection provided two points of interest with respect to CSA-13. First, the results of this work indicated that CSA-13 had the ability to eradicate very high inocula of bacteria residing in the biofilm phenotype. Traditional antibiotics do not appear to have this same ability [63]. Although the data is not shown, the authors have tested vancomycin as the active release agent of the PDMS coating described in this project against the same MRSA biofilms used in this study. Results from this work showed that under the same in vitro conditions, vancomycin was only able to reduce the number of bacteria in biofilms by ~2.5 log10 units, which may have little to no clinical relevancy. Second, when used as the active release agent of the PDMS coating in this study, CSA-13 was able to elute into the surrounding tissues and fluids and prevent biofilm implant-related osteomyelitis from developing. With respect to its method of action against these biofilms, the function of CSA-13 has been elucidated by Epand et al. [49] and Bucki et al. [50]. In short, the positively charged components of CSA-13 allow it to interact with the negatively charged components of bacterial cell membranes. CSA-13 causes a disruption, i.e., permeabilizes the cell membrane, which causes the cellular surface to become corrugated and ultimately cytoplasmic components to be released. Cellular death then follows. Importantly, this method of action is similar to the method of action of naturally occurring AMPs as was shown by Fantner et al. [64]. Taken together, the results of this study indicated that the CSA-13-based active release coating developed for this study may have the potential to translate to clinical paradigms of biofilm implant-related infections. The fact that 1 in 9 sheep (11%) in the negative control group (Group 3) became infected and that one other sheep in this group had positive growth on a PEEK membrane further demonstrated the effectiveness of the CSA-13 coating.
As was reported in our pilot study [52], the biofilms in this study appeared to have a gradual adverse clinical effect on the sheep. More specifically, osteomyelitis developed slowly, and persisted without significant signs of distress in 6 of 9 of the animals in Group 1. This may be similar to biofilm-related infections that are seen clinically [2]. In patients, biofilm-related infections can take months or years to develop, and may persist without significant morbidity or mortality [2]. This may be due to the quiescent nature of biofilms and the fact that they have already established a community. Planktonic bacteria have yet to develop a community and it appears that their “goal” in the majority of ecosystems is to find a location to colonize and then begin to develop a biofilm community [65].
From the radiographic, SEM and histological data, there were important observations made specifically related to Group 2 sheep, i.e., those that were treated with CSA-13 coated plates and biofilm. Resorption was specifically seen near the screw regions in all nine sheep from this Group. In all cases, the resorption that occurred did not appear to adversely affect the overall health of the tissues or the success of the coating, and new bone growth was present in the regions where resorption had occurred. Furthermore, in those sheep from Group 4 that were treated with CSA-13 and no biofilm, this pattern of resorption and bone remodeling was not seen.
The authors hypothesize that the process of bone resorption that was followed by new bone growth in Group 2 sheep was a result of initial trauma caused by the MRSA biofilms. This observation would coincide with what was elucidated from the in vitro work. More specifically, from the in vitro work it was seen that MRSA biofilms were not completely eradicated by CSA-13 within 24 h. There were less than 101 CFU on average on the surface of the PEEK membranes, but there were also roughly 105 CFU in the bone samples. This suggested that the bacteria in the biofilms had the ability to “hide out” in the bone wafers. Thus, in the in vivo setting, it may have taken CSA-13 and the host immune components several days after surgery to eradicate all of the bacteria, in particular if the bacteria were “hiding out” in the host bone as they did in vitro. As such, it appeared that the bacteria may have colonized and perhaps caused an acute infection in the host bone that led to resorption. Yet once the bacteria were eradicated by CSA-13 and the host, the bone was able to remodel those areas that had resorbed by laying down new bone. These data suggested that at an 18% w/w concentration, there was a sufficient amount of CSA-13 in the coating to lower the number of bacteria in a biofilm from a very high inoculum to a level that the host could handle although it may have taken a few days.
At least five limitations accompanied this study and will need to be addressed with future work. First, these results are based on the use of a single species of microorganism and although the outcomes are hypothesized to be similar with other biofilm forming organisms, different organisms may lead to different results. More specifically, although S. aureus is a common cause of metal, device-related infections [66], a wide variety of other organisms can cause biofilm-related infections including Pseudomonas aeruginosa, Enterococcus faecalis, coagulase negative staphylococci, Escherichia coli, Acinetobacter baumanii, Klebsiella pneumoniae and others. Second, the efficacy of the CSA-13 coating will need to be confirmed with other biomaterial devices such as catheters, endotracheal tubes, intramedullary nails, total joint replacement devices and pacemaker leads. Third, as this was a developmental model to test the ability of biofilms to cause infection, antibiotics were not used. However, if this were a clinical scenario, prophylactic antibiotics would have accompanied the implantation of the devices. Fourth, in the animal model that was used for this study, there was no fracture created and the amount of CSA-13 that was present in the sheep was not determined. Additional work is currently being undertaken to address this fourth limitation. Fifth, in the in vitro experiments, the release kinetics of CSA-13 were variable during the first 24 h and the amounts of CSA-13 may have been lower than what was actually released due to adherence of the molecules to the plastic tube, compounds in the broth, the bone, and/or bacterial cells. Despite this limitation, the release profile of CSA-13 was such that infection was prevented in the in vivo analysis. Work is currently under way to more accurately determine the concentration of CSA-13 that is released in vivo using an additional animal model.
The animal model used in this study provided a promising outcome in that it may be used by future researchers and clinicians to utilize a reproducible model to examine the therapeutic potential of systemic antimicrobials and/or antimicrobial coatings on biomedical devices to treat and prevent biofilm-related osteomyelitis, as well as other biofilm-related infections. It may be that the use of this and similar animal models using biofilms as initial inocula will result in an important addition to the field of biofilm research that adds onto the work that has been done with planktonic bacteria. This addition may lead to the development of antimicrobial therapies, such as coatings on devices, that could help prevent biofilm-related infections in a more effective manner.
7. Conclusion
These data indicated that when used as the active release agent of a PDMS-based active release coating, CSA-13 had the ability to prevent biofilm implant-related osteomyelitis from developing in a sheep model of a simulated Type IIIB open fracture. As such, CSA-13 shows promise to translate to clinical applications wherein it could prevent biofilm implant-related infections from developing and alleviate suffering in a variety of patients.
Acknowledgments
This material is based upon work supported by the Office of Research and Development, Rehabilitation R&D Service, Department of Veterans Affairs Medical Center, Salt Lake City, UT. The project described was also supported by Award Number R01AR057185 from the National Institute Of Arthritis And Musculoskeletal And Skin Diseases. The content is solely the responsibility of the authors and does not necessarily represent the official views of the National Institute Of Arthritis And Musculoskeletal And Skin Diseases or the National Institutes of Health. This study was also supported by the Albert and Margaret Hofmann Chair and the Department of Orthopaedics, University of Utah School of Medicine, Salt Lake City, UT. The authors wish to thank Mr. and Mrs. George and Lisa Etheridge, Mr. and Mrs. Jim and Maria Hess, and Dr. Richard E. and Mrs. Susan Jones for their generous donations. Gratitude is given to Dennis Romney for manufacturing the SS plates used in this study, and Kassie Woodbury, Andrew Grange, Dr. David Moore, Ryan Farnsworth and Julia Lerdahl for their technical and animal support. Finally, the authors thank the animal care team, surgical technicians and veterinary staff at the University of Utah CMC facility.
References
- 1.Darouiche RO. Treatment of infections associated with surgical implants. N Engl J Med. 2004;350:1422–9. doi: 10.1056/NEJMra035415. [DOI] [PubMed] [Google Scholar]
- 2.Gristina AG, Costerton JW. Bacteria-laden biofilms: a hazard to orthopedic prostheses. Infect Surg. 1984;3:655–62. [Google Scholar]
- 3.Guggenbichler JP, Assadian O, Boeswald M, Kramer A. Incidence and clinical implication of nosocomial infections associated with implantable biomaterials-catheters, ventilator-associated pneumonia, urinary tract infections. GMS Krankenhhyg Interdiszip. 2011;6:Doc18. doi: 10.3205/dgkh000175. [DOI] [PMC free article] [PubMed] [Google Scholar]
- 4.Marrie T, Nelligan J, Costerton J. A scanning and transmission electron microscopic study of an infected endocardial pacemaker lead. Circulation. 1982;66:1339–41. doi: 10.1161/01.cir.66.6.1339. [DOI] [PubMed] [Google Scholar]
- 5.Chen SY, Chen TM, Dai NT, Fu JP, Chang SC, Deng SC, et al. Do antibacterial-coated sutures reduce wound infection in head and neck cancer reconstruction? Eur J Surg Oncol. 2011;37:300–4. doi: 10.1016/j.ejso.2011.01.015. [DOI] [PubMed] [Google Scholar]
- 6.Sugarman B, Musher D. Adherence of bacteria to suture materials. Proc Soc Exp Biol Med. 1980;167:156–60. doi: 10.3181/00379727-167-41141. [DOI] [PubMed] [Google Scholar]
- 7.Stoodley P, Braxton EEJ, Nistico L, Hall-Stoodley L, Johnson S, Quigley M, et al. Direct demonstration of Staphylococcus biofilm in an external ventricular drain in a patient with a history of recurrent ventriculoperitoneal shunt failure. Pediatr Neurosurg. 2010;46:127–32. doi: 10.1159/000319396. [DOI] [PMC free article] [PubMed] [Google Scholar]
- 8.Costerton JW, Montanaro L, Arciola CR. Biofilm in implant infections: its production and regulation. Int J Artif Organs. 2005;28:1062–8. doi: 10.1177/039139880502801103. [DOI] [PubMed] [Google Scholar]
- 9.Costerton JW. Biofilm theory can guide the treatment of device-related orthopaedic infections. Clin Orthop Relat Res. 2005;437:7–11. doi: 10.1097/00003086-200508000-00003. [DOI] [PubMed] [Google Scholar]
- 10.Hetrick EM, Schoenfisch MH. Reducing implant-related infections: active release strategies. Chem Soc Rev. 2006;35:780–90. doi: 10.1039/b515219b. [DOI] [PubMed] [Google Scholar]
- 11.Zilberman M, Elsner JJ. Antibiotic-eluting medical devices for various applications. J Control Release. 2008;130:202–15. doi: 10.1016/j.jconrel.2008.05.020. [DOI] [PubMed] [Google Scholar]
- 12.Liu XS, Zola JC, McGinnis DE, Squadrito JF, Zeltser IS. Do silver alloy-coated catheters increase risk of urethral strictures after robotic-assisted laparoscopic radical prostatectomy? Urology. 2011;78:365–7. doi: 10.1016/j.urology.2011.04.032. [DOI] [PubMed] [Google Scholar]
- 13.Moretti EW, Ofstead CL, Kristy RM, Wetzler HP. Impact of central venous catheter type and methods on catheter-related colonization and bacteraemia. J Hosp Infect. 2005;61:139–45. doi: 10.1016/j.jhin.2005.02.012. [DOI] [PubMed] [Google Scholar]
- 14.Fei J, Yu H-j, Pan C-j, Zhao C-h, Zhou Y-g, Wang Y. Efficacy of a norvancomycin-loaded, PDLLA-coated plate in preventing early infection of rabbit tibia fracture. Orthopedics. 2010;33:310. doi: 10.3928/01477447-20100329-06. [DOI] [PubMed] [Google Scholar]
- 15.Bologna RA, Tu LM, Polansky M, Fraimow HD, Gordon DA, Whitmore KE. Hydrogel/silver ion-coated urinary catheter reduces nosocomial urinary tract infection rates in intensive care unit patients: a multicenter study. Urology. 1999;54:982–7. doi: 10.1016/s0090-4295(99)00318-0. [DOI] [PubMed] [Google Scholar]
- 16.Brin YS, Golenser J, Mizrahi B, Maoz G, Domb AJ, Peddada S, et al. Treatment of osteomyelitis in rats by injection of degradable polymer releasing gentamicin. J Control Release. 2008;131:121–7. doi: 10.1016/j.jconrel.2008.07.022. [DOI] [PMC free article] [PubMed] [Google Scholar]
- 17.Galal I, el-Hindawy K. Impact of using triclosan-antibacterial sutures on incidence of surgical site infection. Am J Surg. 2011;202:133–8. doi: 10.1016/j.amjsurg.2010.06.011. [DOI] [PubMed] [Google Scholar]
- 18.Ranucci M, Isgro G, Giomarelli PP, Pavesi M, Luzzani A, Cattabriga I, et al. Impact of oligon central venous catheters on catheter colonization and catheter-related bloodstream infection. Crit Care Med. 2003;31:52–9. doi: 10.1097/00003246-200301000-00008. [DOI] [PubMed] [Google Scholar]
- 19.Justinger C, Slotta JE, Schilling MK. Incisional hernia after abdominal closure with slowly absorbable versus fast absorbable, antibacterial-coated sutures. Surgery. 2011 doi: 10.1016/j.surg.2011.08.004. [Epud ahead of print] [DOI] [PubMed] [Google Scholar]
- 20.Fraenkel D, Rickard C, Thomas P, Faoagali J, George N, Ware R. A prospective, randomized trial of rifampicin-minocycline-coated and silver-platinum-carbon-impregnated central venous catheters. Crit Care Med. 2006;34:668–75. doi: 10.1097/01.CCM.0000201404.05523.34. [DOI] [PubMed] [Google Scholar]
- 21.Fuchs T, Stange R, Schmidmaier G, Raschke MJ. The use of gentamicin-coated nails in the tibia: preliminary results of a prospective study. Arch Orthop Trauma Surg. 2011;131:1419–25. doi: 10.1007/s00402-011-1321-6. [DOI] [PMC free article] [PubMed] [Google Scholar]
- 22.Arvaniti K, Lathyris D, Clouva-Molyvdas P, Haidich AB, Mouloudi E, Synnefaki E, et al. Comparison of oligon catheters and chlorhexidine-impregnated sponges with standard multilumen central venous catheters for prevention of associated colonization and infections in intensive care unit patients: a multicenter, randomized, controlled study. Crit Care Med. 2012;40:420–9. doi: 10.1097/CCM.0b013e31822f0d4b. [DOI] [PubMed] [Google Scholar]
- 23.Storch M, Perry LC, Davidson JM, Ward JJ. A 28-day study of the effect of coated VICRYL* plus antibacterial suture (coated polyglactin 910 suture with triclosan) on wound healing in guinea pig linear incisional skin wounds. Surg Infect. 2002;3:S89–98. doi: 10.1089/sur.2002.3.s1-89. [DOI] [PubMed] [Google Scholar]
- 24.Corral L, Nolla-Salas M, Ibanez-Nolla J, Leon MA, Diaz RM, Martin MC, et al. A prospective, randomized study in critically ill patients using the oligon vantex catheter. J Hosp Infect. 2003;55:212–9. doi: 10.1016/j.jhin.2003.07.001. [DOI] [PubMed] [Google Scholar]
- 25.Darouiche RO, Mansouri MD. Dalbavancin compared with vancomycin for prevention of Staphylococcus aureus colonization of devices in vivo. J Infect. 2005;50:206–9. doi: 10.1016/j.jinf.2004.05.006. [DOI] [PubMed] [Google Scholar]
- 26.Darouiche RO, Mansouri MD, Zakarevicz D, AlSharif A, Landon GC. In vivo efficacy of antimicrobial-coated devices. J Bone Jt Surg. 2007;89:792–7. doi: 10.2106/JBJS.F.00414. [DOI] [PubMed] [Google Scholar]
- 27.Price JS, Tencer AF, Arm DM, Bohach GA. Controlled release of antibiotics from coated orthopedic implants. J Biomed Mater Res. 1996;30:281–6. doi: 10.1002/(SICI)1097-4636(199603)30:3<281::AID-JBM2>3.0.CO;2-M. [DOI] [PubMed] [Google Scholar]
- 28.Schierholz JM, Steinhauser H, Rump AFE, Berkels R, Pulverer G. Controlled release of antibiotics from biomedical polyurethanes: morphological and structural features. Biomaterials. 1997;18:839–44. doi: 10.1016/s0142-9612(96)00199-8. [DOI] [PubMed] [Google Scholar]
- 29.Kalicke T, Schierholz J, Schlegel U, Frangen TM, Koller M, Printzen G, et al. Effect on infection resistance of a local antiseptic and antibiotic coating on osteosynthesis implants: an in vitro and in vivo study. J Orthop Res. 2006;24:1622–40. doi: 10.1002/jor.20193. [DOI] [PubMed] [Google Scholar]
- 30.Ceri H, Olson ME, Morck DW, Storey DG. Minimal biofilm eradication concentration (MBEC) assay: susceptibility testing for biofilms. In: Pace JL, Rupp ME, Finch RG, editors. Biofilms, infection, and antimicrobial therapy. Boca Raton: CRC Press; 2006. pp. 257–69. [Google Scholar]
- 31.Williams DL, Costerton JW. Using biofilms as initial inocula in animal models of biofilm-related infections. J Biomed Mater Res B. 2011;100:1163–9. doi: 10.1002/jbm.b.31979. [DOI] [PubMed] [Google Scholar]
- 32.Buret A, Ward KH, Olson ME, Costerton JW. An in vivo model to study the pathobiology of infectious biofilms on biomaterial surfaces. J Biomed Mater Res. 1991;25:865–74. doi: 10.1002/jbm.820250706. [DOI] [PubMed] [Google Scholar]
- 33.Cirioni O, Mocchegiani F, Ghiselli R, Silvestri C, Gabrielli E, Marchionni E, et al. Daptomycin and rifampin alone and in combination prevent vascular graft biofilm formation and emergence of antibiotic resistance in a subcutaneous rat pouch model of staphylococcal infection. Euro J Vasc Endovasc Surg. 2010;40:817–22. doi: 10.1016/j.ejvs.2010.08.009. [DOI] [PubMed] [Google Scholar]
- 34.Lambe DW, Ferguson KP, Mayberry-Carson KJ, Tober-Meyer B, Costerton JW. Foreign-body-associated experimental osteomyelitis induced with Bacteroides fragilis and Staphylococcus epidermidis in rabbits. Clin Orthop Relat Res. 1991;266:285–94. [PubMed] [Google Scholar]
- 35.Darouiche RO, Farmer J, Chaput C, Mansouri M, Saleh G, Landon GC. Anti-infective efficacy of antiseptic-coated intramedullary nails. J Bone Jt Surg. 1998;80:1336–40. doi: 10.2106/00004623-199809000-00013. [DOI] [PubMed] [Google Scholar]
- 36.Darouiche RO, Mansouri MD, Gawande PV, Madhyastha S. Antimicrobial and antibiofilm efficacy of triclosan and dispersin B combination. J Antimicrob Chemother. 2009;64:88–93. doi: 10.1093/jac/dkp158. [DOI] [PubMed] [Google Scholar]
- 37.Davis SC, Ricotti C, Cazzaniga A, Welsh E, Eaglstein WH, Mertz PM. Microscopic and physiologic evidence for biofilm-associated wound colonization in vivo. Wound Repair Regen. 2008;16:23–9. doi: 10.1111/j.1524-475X.2007.00303.x. [DOI] [PubMed] [Google Scholar]
- 38.Hansen LK, Berg K, Johnson D, Sanders M, Citron M. Efficacy of local rifampin/minocycline delivery (AIGISRX®) to eliminate biofilm formation on implanted pacing devices in a rabbit model. Int J Artif Organs. 2010;33:627–35. doi: 10.1177/039139881003300908. [DOI] [PubMed] [Google Scholar]
- 39.Lucke M, Schmidmaier G, Sadoni S, Wildemann B, Schiller R, Haas NP, et al. Gentamicin coating of metallic implants reduces implant-related osteomyelitis in rats. Bone. 2003;32:521–31. doi: 10.1016/s8756-3282(03)00050-4. [DOI] [PubMed] [Google Scholar]
- 40.Mayberry-Carson KJ, Tober-Meyer B, Smith JK, Lambe DW, Costerton JW. Bacterial adherence and glycocalyx formation in osteomyelitis experimentally induced with Staphylococus aureus. Infect Immun. 1984;43:825–33. doi: 10.1128/iai.43.3.825-833.1984. [DOI] [PMC free article] [PubMed] [Google Scholar]
- 41.Williams D, Bloebaum R, Petti CA. Characterization of Staphylococcus aureus strains in a rabbit model of osseointegrated pin infections. J Biomed Mater Res A. 2008;85:366–70. doi: 10.1002/jbm.a.31485. [DOI] [PubMed] [Google Scholar]
- 42.Wimpenny J, Manz W, Szewzyk U. Heterogeneity in biofilms. FEMS Microbiol Rev. 2000;24:661–71. doi: 10.1111/j.1574-6976.2000.tb00565.x. [DOI] [PubMed] [Google Scholar]
- 43.Costerton JW, Geesey GG, Cheng KJ. How bacteria stick. Sci Am. 1978;238:86–95. doi: 10.1038/scientificamerican0178-86. [DOI] [PubMed] [Google Scholar]
- 44.Lawrence JR, Korber DR, Hoyle BD, Costerton JW, Caldwell DE. Optical sectioning of microbial biofilms. J Bacteriol. 1991;173:6558–67. doi: 10.1128/jb.173.20.6558-6567.1991. [DOI] [PMC free article] [PubMed] [Google Scholar]
- 45.Geesey GG, Richardson WT, Yeomans HG, Irvin RT, Costerton JW. Microscopic examination of natural sessile bacterial populations from an alpine stream. Can J Microbiol. 1977;23:1733–6. doi: 10.1139/m77-249. [DOI] [PubMed] [Google Scholar]
- 46.James GA, Swogger E, Wolcott R, Pulcini ED, Secor P, Sestrich J, et al. Biofilms in chronic wounds. Wound Repair Regen. 2008;16:37–44. doi: 10.1111/j.1524-475X.2007.00321.x. [DOI] [PubMed] [Google Scholar]
- 47.Feazel LM, Baumgartner LK, Peterson KL, Frank DN, Harris JK, Pace NR. Opportunistic pathogens enriched in showerhead biofilms. Proc Natl Acad Sci U S A. 2009;106:16393–9. doi: 10.1073/pnas.0908446106. [DOI] [PMC free article] [PubMed] [Google Scholar]
- 48.Dowd SE, Sun Y, Secor PR, Rhoads DD, Wolcott BM, James GA, et al. Survey of bacterial diversity in chronic wounds using pyrosequencing, DGGE, and full ribosome shotgun sequencing. BMC Microbiol. 2008;6:43. doi: 10.1186/1471-2180-8-43. [DOI] [PMC free article] [PubMed] [Google Scholar]
- 49.Epand RF, Pollard JE, Wright JO, Savage PB, Epand RM. Depolarization, bacterial membrane composition, and the antimicrobial action of ceragenins. Antimicrob Agents Chemother. 2010;54:3708–13. doi: 10.1128/AAC.00380-10. [DOI] [PMC free article] [PubMed] [Google Scholar]
- 50.Bucki R, Sostarecz AG, Byfield FJ, Savage PB, Janmey PA. Resistance of the antibacterial agent ceragenin CSA-13 to inactivation by DNA or F-actin and its activity in cystic fibrosis sputum. J Antimicrob Chemother. 2007;60:535–45. doi: 10.1093/jac/dkm218. [DOI] [PubMed] [Google Scholar]
- 51.Chin JN, Rybak MJ, Cheung CM, Savage PB. Antimicrobial activities of ceragenins against clinical isolates of resistant Staphylococcus aureus. Antimicrob Agents Chemother. 2007;51:1268–73. doi: 10.1128/AAC.01325-06. [DOI] [PMC free article] [PubMed] [Google Scholar]
- 52.Williams DL, Haymond BS, Woodbury KL, Beck JP, Moore DE, Epperson RT, et al. Experimental model of biofilm implant-related osteomyelitis to test combination biomaterials using biofilms as initial inocula. J Biomed Mater Res A. 2012;100:1888–900. doi: 10.1002/jbm.a.34123. [DOI] [PMC free article] [PubMed] [Google Scholar]
- 53.Williams DL, Haymond BS, Bloebaum RD. Use of delrin plastic in a modified CDC biofilm reactor. Res J Microbiol. 2011;6:425–9. doi: 10.1007/s00284-011-9908-2. [DOI] [PubMed] [Google Scholar]
- 54.Williams DL, Woodbury KL, Haymond BS, Parker AE, Bloebaum RD. A modified CDC biofilm reactor to produce mature biofilms on the surface of PEEK membranes for an in vivo animal model application. Curr Microbiol. 2011;62:1657–63. doi: 10.1007/s00284-011-9908-2. [DOI] [PubMed] [Google Scholar]
- 55.CLSI. Methods for determining bactericidal activity of antimicrobial agents. Clinical and Laboratory Standards Institute; 1999. pp. 1–28. [Google Scholar]
- 56.Smith JB, McIntosh GH, Morris B. The traffic of cells through tissues: a study of peripheral lymph in sheep. J Anat. 1970;107:87–100. [PMC free article] [PubMed] [Google Scholar]
- 57.Patterson RA. A new method for the isolation of M. tuberculosis. Am J Public Health Nations Health. 1956;46:1429–30. doi: 10.2105/ajph.46.11.1429. [DOI] [PMC free article] [PubMed] [Google Scholar]
- 58.Wayne LG. Some observations on the use of benzalkonium chloride (zephiran) in tuberculosis bacteriology. Am Rev Respir Dis. 1959;80:912–3. [Google Scholar]
- 59.Thornton CG, MacLellan KM, Thomas L, Brink J, Wolfe DM, Llorin OJ, et al. Processing respiratory specimens with C18-carboxypropylbetaine: development of a sediment resuspension buffer that contains lytic enzymes to reduce the contamination rate and lecithin to alleviate toxicity. J Clin Microbiol. 1998;36:2004–13. doi: 10.1128/jcm.36.7.2004-2013.1998. [DOI] [PMC free article] [PubMed] [Google Scholar]
- 60.Gustilo RB, Mendoza RM, Williams DN. Problems in the management of type III (severe) open fractures: a new classification of type III open fractures. J Trauma. 1984;24:742–6. doi: 10.1097/00005373-198408000-00009. [DOI] [PubMed] [Google Scholar]
- 61.Bloebaum RD, Willie BM, Mitchell BS, Hofmann AA. Relationship between bone ingrowth, mineral apposition rate, and osteoblast activity. J Biomed Mater Res A. 2007;81A:505–14. doi: 10.1002/jbm.a.31087. [DOI] [PubMed] [Google Scholar]
- 62.Smeltzer MS, Thomas JR, Hickmon SG, Skinner RA, Nelson CL, Griffith D, et al. Characterization of a rabbit model of staphylococcal osteomyelitis. J Orthop Res. 1997;15:414–21. doi: 10.1002/jor.1100150314. [DOI] [PubMed] [Google Scholar]
- 63.Nickel JC, Ruseska I, Wright JB, Costerton JW. Tobramycin resistance of Pseudomonas aeruginosa cells growing as a biofilm on urinary catheter material. Antimicrob Agents Chemother. 1985;27:619–24. doi: 10.1128/aac.27.4.619. [DOI] [PMC free article] [PubMed] [Google Scholar]
- 64.Fantner GE, Barbero RJ, Gray DS, Belcher AM. Kinetics of antimicrobial peptide activity measured on individual bacterial cells using high-speed atomic force microscopy. Nat Nanotechnol. 2010;5:280–5. doi: 10.1038/nnano.2010.29. [DOI] [PMC free article] [PubMed] [Google Scholar]
- 65.O’Toole G, Kaplan HB, Kolter R. Biofilm formation as microbial development. Annu Rev Microbiol. 2000;54:49–79. doi: 10.1146/annurev.micro.54.1.49. [DOI] [PubMed] [Google Scholar]
- 66.Harris LG, Richards RG. Staphylococci and implant surfaces: a review. Injury. 2006;37:S3–14. doi: 10.1016/j.injury.2006.04.003. [DOI] [PubMed] [Google Scholar]