

Abstract
Stimulated Raman scattering (SRS) microscopy allows label-free chemical imaging based on vibrational spectroscopy. Narrowband excitation with picosecond lasers creates the highest signal levels and enables imaging speeds up to video-rate, but sacrifices chemical specify in samples with overlapping bands compared to broadband (multiplex) excitation. We develope a rapidly tunable picosecond optical parametric oscillator with an electro-optical tunable Lyot filter, and demonstrate multi-color SRS microscopy with synchronized line-by-line wavelength tuning to avoid spectral artifacts due to sample movement. We show sensitive imaging of three different kinds of polymer beads and live HeLa cells with moving intracellular lipid droplets.
Coherent Raman scattering microscopy, as a label-free, highly sensitive, chemically specific imaging technique, has recently found wide applications in biomedical imaging [1–7]. Stimulated Raman scattering (SRS) microscopy [4–7] has emerged as an alternative to coherent anti-Stokes Raman scattering (CARS) microscopy, as it is free from spectral distortions, straightforward in contrast interpretation, and is linearly dependents on analyte concentration.
Narrowband excitation with picosecond lasers for SRS microscopy is commonly used due to its spectral resolving capability and high sensitivity, and video-rate molecular imaging in vivo with epi-detected SRS has been demonstrated [7]. In such implementation, a single Raman band is probed at a time. However, to distinguish M chemical components with overlapping Raman bands in complex biological samples, N (N ≥ M) frequencies should be measured. Then the concentration maps of individual chemical species are numerically decomposed from the multi-colored images based on multivariant analysis. Reliable multi-color SRS imaging methods are required to quantitatively resolve multiple chemical species.
In the narrowband implementation of SRS microscopy for complex samples, a single Raman frequency is probed throughout an image frame, and the laser frequency is sequentially tuned frame-by-frame [8,9]. However, for live cell or tissue imaging with sample movements, such as random organelle drifting on a time scale shorter than the image frame rate, numerical decomposition will inevitably introduce spectral artifacts due to sample motion, limiting the usefulness of frame-by-frame wavelength tuning based multi-color SRS microscopy [10].
Alternatively, femtosecond SRS [11] and multi-color SRS microscopy [12] were presented with simultaneous multi-channel spectral detection, similar to multiplex-CARS [13,14]. Spectrally tailored excitation SRS microscopy [15] was demonstrated for highly specific molecular imaging, implemented through the collective excitation of selected vibrational frequencies with a spatial light modulator based pulse-shaper. Modulation multiplexing based multiplex SRS microscopy [10] was achieved by modulating individual wavelength bands at different radio-frequencies with an acousto-optical tunable filter device. In all these techniques, the intensity information for multiple frequencies is obtained on a pixel-by-pixel basis, making them less susceptible to sample motion induced spectral artifacts. But in practice, their sensitivities are lower as part of the excitation power is wasted on spectral bands that do not have information, which decreases the imaging speed. Also, the high speed electronics necessary to synchronize the independent femtosecond and picosecond sources is susceptible to timing jitter.
In this paper, we demonstrate a line-by-line wavelength tuning based SRS microscopy with an optical parametric oscillator (OPO) rapidly tuned by an electro-optical modulator, which retains the high sensitivity and reduces spectral artifacts due to sample motion.
Figure 1(a) shows the diagram of the fast tuning OPO. It is based on a commercial OPO (Levante Emerald, APE-Berlin), which is synchronously pumped by a frequency-doubled Nd:YVO4 mode-locked laser (76 MHz, 5 ps pulses at 532 nm, High-Q laser GmbH). The original Lyot filter is replaced by a homemade electro-optical tunable Lyot filter. Following the design shown in Ref.[16], it is made up of a static multi-order crystalline quartz waveplate (United Crystal Company), a LiNbO3 based Pockel's cell (EO-AM-NR-C1, Thorlabs), and two Glan-Brewster prisms (MGLBAS5, Karl Lambrecht).
Fig. 1.

(a) Schematic of the fast tuning OPO. DM: dichroic mirror, M: mirror, G: Glan-Brewster prism, W: waveplate, EO: electro-optical crystal, LBO: lithium triborate crystal. (b) Tuning characteristic of the OPO with an electric-optical tunable Lyot filter. The dots show average values, and the error bars show the standard deviations after 100 repetitions.
Parametric down-conversion is based on the provided temperature tuned LBO crystal (20 mm long), with type-I noncritical phase matching. It is found that even though the phase matching condition selects the intracavity polarization, the Glan-Brewster prisms are still necessary to avoid discontinuities in tuning the wavelength. The temperature of the LBO crystal and the cavity length are set to generate near-infrared signal at the desired central wavelengths, and fast wavelength tuning is accomplished by applying sequential DC voltages to the electric-optical modulator.
To achieve fast wavelength tuning, voltages on the Pockel's cell are applied stepwise with homemade circuits. The tuning speed is limited by the slow slew rate of the operational amplifier (PA97DR, Cirrus Logic), which takes ~100 μs to go from −400 V to +400 V. This is much longer than the timescale (~1 μs) for building-up of the steady-state operation, determined by cavity dynamics intrinsic to the OPO [16,17]. Figure 1(b) shows the wavelength tuning performance of the OPO, monitored with a fast spectrograph of 0.2 nm spectral resolution (USB 4000, Ocean Optics). Stepped voltage sweeps, increasing from −400 V to 400 V monotonically with increments of 50 V and durations of 15 ms, are repeated 100 times, and the peak wavelengths are recorded. It is shown that the output wavelengths change linearly and reproducibly with the applied voltages. With a 50-λ waveplate, the achieved tuning span around 805 nm is ~7.5 nm (covering ~115 cm−1), with the free spectral range determined by the sum of the waveplate and the residual static birefringence of the electro-optical crystals. For every output, the spectral bandwidth is ~0.3 nm, resulting in a spectral resolution of ~5 cm−1. Unlike the results of Ref.[18], hysteresis is observed when the applied stepwise voltages are first increased and then decreased over the full voltage range (data not shown).
The SRS signal is detected using a high-frequency modulation-transfer scheme [4]. The tunable OPO signal is used as the pump beam for SRS. The 1064 nm beam is used as the Stokes beam, and is amplitude modulated at 10 MHz. The spatially and temporally overlapped pump and Stokes beams are sent through a laser scanning microscope (IX81/FV1000, Olympus) and focused onto the sample. The SRS (stimulated Raman loss) signal is detected with a homemade lock-in amplifier [7].
The FV1000 is operated in the `Line Kalman' mode, in which the galvos repeatedly scan each physical line for multiple times before moving to the next. We utilize the line trigger signal from FV1000 to synchronize the driving voltages for the Pockel's cell by an analog output card (PCI-6229, National Instruments) with a custom Labview program, so that each physical line is scanned N times at N pre-selected OPO wavelengths sequentially. Wavelength switching occurs at falling edges of the line trigger, during the retrace of galvos when the image data is not collected. During each frame of the 2D galvo scan, N images at the corresponding Raman frequencies are constructed from the simultaneously recorded raw SRS signals (PCI-6132, with another custom Labview program) in accordance to the line trigger voltages from FV1000. Then the multivariant calibration based on least-squares analysis is applied to convert the raw image data into concentration maps of each chemical component [10,12].
We first evaluate the validity of spectral decomposition by imaging mixed beads coated on a cover glass, including melamine, poly(methyl methacrylate) (PMMA), and polystyrene. Their spontaneous Raman spectra are shown in Fig. 2(a), from which the desired probing wavelengths and corresponding applied voltages can be chosen. Figures 2(b–d) show the SRS images (330×330 pixels) at 3054 cm−1, 2979 cm−1, 2959 cm−1 respectively, with a 60× objective lens (NA 1.2, water). The calibration matrix is constructed [10] from the in situ imaging data of the three different beads, and is used to reconstruct the concentration image. Figure 2(e) shows the RGB composite image with each color for each bead composition. It can be seen that this scheme is well suited to distinguish multiple chemical components with overlapping Raman bands.
Fig. 2.

(color online) (a) Spontaneous Raman spectra of melamine, PMMA, and polystyrene beads. (b–d) Raw images taken at 3054 cm−1, 2979 cm−1, and 2959 cm−1. (e) Reconstructed SRS image (Red: 2 μm polystyrene, Green: 1–10 μm PMMA, Blue: 2.9 μm melamine).
Next we image live HeLa cells to show the ability to minimize artifacts from organelle drifting during imaging. For cells or tissues containing primarily lipid and protein, probing at two Raman bands is sufficient to map their distribution. Here, the frequency shifts of 2838 cm−1, and 2914 cm−1 (corresponding to pump wavelengths of 817.2 nm, and 812.1 nm respectively) are used. As shown in Fig. 3(a), the 2914 cm−1 channel is attributed to both lipid and protein, and the 2838 cm−1 channel is mainly attributed to lipid. The powers at the objective focus are: 28 mW of Stokes, 81 mW at 817.2 nm, and 78 mW at 812.1 nm. The pixel dwell time is 8 μs, and the wavelengths are switched every 5.184 ms. By picking specific regions with features corresponding to protein and lipid, the calibration matrix is created [10]. Figure 3(b) shows the retrieved image of the HeLa cell, which shows the distribution of protein and lipid. Lipid droplets are shown in green, and protein is shown in red throughout the cytoplasm and nucleus. In comparison, the retrieved image from sequential frame-by-frame wavelength tuning is shown in Fig. 3(c). After decomposition, the moving lipid droplets introduce artifacts as protein signals, such as the red droplets marked with arrows, which is obviously due to lipid droplet motion when compared with Fig. 3(b).
Fig.3.
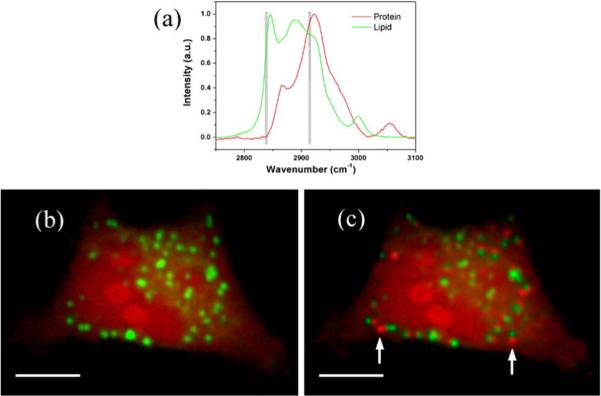
(color online) (a) Spontaneous Raman spectra of protein and lipid. (b) Reconstructed SRS image by line-by-line tuning, free of spectral artifacts due to lipid droplet driftings. (c) Reconstructed SRS image by frame-by-frame tuning. The two arrows point to artifacts due to lipid droplet driftings. Red: protein, green: lipid. Both images are 460×318 pixels. The scale bar is 10 μm. (60×water objective lens used)
In conclusion, we develop a rapidly tunable OPO with an elctro-optical tunable Lyot filter for multi-color SRS microscopy. With this system, all the necessary spectral information for each image line is recorded on the time scale of 10 milliseconds instead of seconds, substantially minimizing spectral artifacts due to sample motions compared to conventional frame-by-frame sequential tuning. Also, the current system can be used for hyperspectral imaging, to get detailed information of a vibrational spectrum [8,9]. With sequential line-by-line wavelength tuning, imaging of mixed beads and live HeLa cells are demonstrated.
Acknowledgments
We thank Fa-ke Lu, and Wenlong Yang for help on preparing HeLa cells and helpful discussions. This work was supported by the National Institute of Health's T-R01 (1R01EB010244-01) awarded to X.S.X.
Referrences
- 1.Zumbusch A, Holtom GR, Xie XS. Three-dimensional vibrational imaging by coherent anti-Stokes Raman scattering. Physical Review Letters. 1999;82:4142–4145. [Google Scholar]
- 2.Cheng JX, Volkmer A, Book LD, Xie XS. An epi-detected coherent anti-stokes raman scattering (E-CARS) microscope with high spectral resolution and high sensitivity. Journal of Physical Chemistry B. 2001;105:1277–1280. [Google Scholar]
- 3.Evans CL, Xie XS. Coherent Anti-Stokes Raman Scattering Microscopy: Chemical Imaging for Biology and Medicine. Annual Review of Analytical Chemistry. 2008;1:883–909. doi: 10.1146/annurev.anchem.1.031207.112754. [DOI] [PubMed] [Google Scholar]
- 4.Freudiger CW, Min W, Saar BG, Lu S, Holtom GR, He C, Tsai JC, Kang JX, Xie XS. Label-Free Biomedical Imaging with High Sensitivity by Stimulated Raman Scattering Microscopy. Science. 2008;322:1857–1861. doi: 10.1126/science.1165758. [DOI] [PMC free article] [PubMed] [Google Scholar]
- 5.Ozeki Y, Dake F, Kajiyama S. i., Fukui K, Itoh K. Analysis and experimental assessment of the sensitivity of stimulated Raman scattering microscopy. Optics Express. 2009;17:3651–3658. doi: 10.1364/oe.17.003651. [DOI] [PubMed] [Google Scholar]
- 6.Nandakumar P, Kovalev A, Volkmer A. Vibrational imaging based on stimulated Raman scattering microscopy. New Journal of Physics. 2009;11:033026. [Google Scholar]
- 7.Saar BG, Freudiger CW, Reichman J, Stanley CM, Holtom GR, Xie XS. Video-Rate Molecular Imaging in Vivo with Stimulated Raman Scattering. Science. 2010;330:1368–1370. doi: 10.1126/science.1197236. [DOI] [PMC free article] [PubMed] [Google Scholar]
- 8.Suhalim JL, Chung C-Y, Lilledahl MB, Lim RS, Levi M, Tromberg BJ, Potma EO. Characterization of Cholesterol Crystals in Atherosclerotic Plaques Using Stimulated Raman Scattering and Second-Harmonic Generation Microscopy. Biophysical Journal. 2012;102:1988–1995. doi: 10.1016/j.bpj.2012.03.016. [DOI] [PMC free article] [PubMed] [Google Scholar]
- 9.Ozeki Y, Umemura W, Sumimura K, Nishizawa N, Fukui K, Itoh K. Stimulated Raman hyperspectral imaging based on spectral filtering of broadband fiber laser pulses. Optics Letters. 2012;37:431–433. doi: 10.1364/OL.37.000431. [DOI] [PubMed] [Google Scholar]
- 10.Fu D, Lu F-K, Zhang X, Freudiger C, Pernik DR, Holtom G, Xie XS. Quantitative Chemical Imaging with Multiplex Stimulated Raman Scattering Microscopy. Journal of the American Chemical Society. 2012;134:3623–3626. doi: 10.1021/ja210081h. [DOI] [PMC free article] [PubMed] [Google Scholar]
- 11.Ploetz E, Laimgruber S, Berner S, Zinth W, Gilch P. Femtosecond stimulated Raman microscopy. Applied Physics B-Lasers and Optics. 2007;87:389–393. [Google Scholar]
- 12.Lu F-K, Ji M, Fu D, Ni X, Freudiger CW, Holtom G, Xie XS. Multicolor stimulated Raman scattering microscopy. Molecular Physics. 2012;110:1927. doi: 10.1080/00268976.2012.695028. [DOI] [PMC free article] [PubMed] [Google Scholar]
- 13.Cheng JX, Volkmer A, Book LD, Xie XS. Multiplex coherent anti-stokes Raman scattering microspectroscopy and study of lipid vesicles. Journal of Physical Chemistry B. 2002;106:8493–8498. [Google Scholar]
- 14.Wurpel GWH, Schins JM, Muller M. Chemical specificity in three-dimensional imaging with multiplex coherent anti-Stokes Raman scattering microscopy. Optics Letters. 2002;27:1093–1095. doi: 10.1364/ol.27.001093. [DOI] [PubMed] [Google Scholar]
- 15.Freudiger CW, Min W, Holtom GR, Xu B, Dantus M, Xie XS. Highly specific label-free molecular imaging with spectrally tailored excitation-stimulated Raman scattering (STE-SRS) microscopy. Nature Photonics. 2011;5:103–109. doi: 10.1038/nphoton.2010.294. [DOI] [PMC free article] [PubMed] [Google Scholar]
- 16.Saar BG, Holtom GR, Freudiger CW, Ackermann C, Hill W, Xie XS. Intracavity wavelength modulation of an optical parametric oscillator for coherent Raman microscopy. Optics Express. 2009;17:12532–12539. doi: 10.1364/oe.17.012532. [DOI] [PubMed] [Google Scholar]
- 17.Godard A, Rosencher E. Energy yield of pulsed optical parametric oscillators: A rate-equation analysis. Ieee Journal of Quantum Electronics. 2004;40:784–790. [Google Scholar]
- 18.Ewbank MD, Rosker MJ, Bennett GL. Frequency tuning a mid-infrared optical parametric oscillator by the electro-optic effect. J. Opt. Soc. Am. B. 1997;14:666–671. [Google Scholar]