Abstract
Shearwave Dispersion Ultrasound Vibrometry (SDUV) is used to quantify both tissue shear elasticity and shear viscosity by evaluating dispersion of shear wave propagation speed over a certain bandwidth (50–500 Hz). The motivation for developing elasticity imaging techniques is based on the possibility of diagnosing disease process. However, it is important to study the mechanical properties of healthy tissues; such data can enhance clinical knowledge and improve understanding of the mechanical properties of tissue. The purpose of this study is to evaluate the feasibility of SDUV for in vitro measurements of renal cortex shear elasticity and shear viscosity on healthy swine kidney. A total of eight excised kidneys from female pigs were used in these in vitro experiments, and a battery of different tests were performed to gain insight on the material properties of the renal cortex. From these eight kidneys, the overall renal cortex elasticity and viscosity was 1.81 ± 0.17 kPa and 1.48 ± 0.49 Pa·s, respectively. In an analysis of the material properties over time after excision, there was not a statistically significant difference in shear elasticity over a 24 hour period, but a statistically significant difference in shear viscosity was found. Homogeneity of the renal cortex was examined and it was found that shear elasticity and shear viscosity were statistically different within a kidney, suggesting global tissue inhomogeneity. More than 30% increases in shear elasticity and shear viscosity were observed after immersion in 10% formaldehyde. Lastly, it was found that the renal cortex is rather anisotropic. Two values for shear elasticity and shear viscosity were measured depending on shear wave propagation direction. These various tests elucidated different aspects of the material properties and the structure of the ex vivo renal cortex.
I. INTRODUCTION
Renal fibrosis is a pathological process that alters the kidney structure and therefore its biomechanical properties. Renal fibrosis is a consequence of chronic kidney disease (CKD). Progressive CKD leads to renal failure, which is a condition that requires dialysis and kidney replacement [1]. Early detection of renal fibrosis could provide critical prognostic information required to guide therapy or alternatively to avoid invasive procedures. However, a major obstacle is the inability to detect fibrosis early and monitor it regularly with sufficient sensitivity and specificity.
Tissue pathology state such as fibrosis is linked to tissue mechanical properties [2]. Hence, several methods that noninvasively estimate tissue mechanical properties have been developed. For instance, kidney mechanical properties have been studied using several elasticity techniques. Elastography, a method that utilizes compression and ultrasound-based strain imaging to obtain maps of relative stiffness [3], has been used in several ex vivo studies in kidneys [4-6] and some in vivo human studies of kidney transplant patients [7, 8]. Areas of lower strain correlated with fibrotic or scarred tissue, implying that this tissue is stiffer than normal tissue.
A method that uses focused ultrasound to produce an acoustic radiation force to push tissue and measures the resulting deformation called acoustic radiation force impulse (ARFI) imaging has been used to image renal tumors [9, 10]. The elastic contrast between the tumor and the normal tissue was almost 11.5 times greater than the contrast observed using conventional ultrasound B-mode images. While elastography and ARFI are useful approaches, they do not provide a quantitative measure of tissue stiffness, but only a relative mapping.
Recent results with transient elastography (TE), a method that uses an external actuator to provide a single cycle of low-frequency (typically around 50 Hz) vibration and ultrasound methods to track the resulting motion [11, 12], showed that stiffness in renal allografts correlated significantly with the degree of fibrosis [13].
A dynamic method called magnetic resonance elastography (MRE) uses an external mechanical actuator to create shear waves in soft tissues, and the 3D shear wave motion is measured using special motion-sensitized pulse sequences [14-16], has been applied to quantitatively evaluate the stiffness of renal cortex and medulla in ex vivo porcine kidneys and in vivo rat and swine models [15, 17-21]. In the study in rats, comparisons were made between normal animals and animals that developed nephrocalcinosis due to exposure to ethylene glycol. The shear stiffness in the renal cortex was 3.87 ± 0.83 kPa in the control group and increased to 5.02 ± 1.06 kPa and 6.49 ± 1.33 kPa after 2 and 4 week exposures [17]. In studies in swine, the renal artery was occluded in progressive steps, and the cortical and medullary shear stiffness decreased as a result of decreased perfusion [18-21]. While MRE can obtain 3D elasticity data, it is not widely available and scans take considerable time.
The kidney, like many other soft tissues, can be modeled as a viscoelastic material, that is, the kidney has both elastic and viscous characteristics [22-26]. Shear waves can also be used to investigate the viscoelastic properties of tissue, the shear elasticity and shear viscosity. Shear waves of a certain frequency can be induced and the speed can be measured, where the speed is related to the material properties. When shear wave speeds are measured at several frequencies in a viscoelastic medium, the shear wave speed will vary with frequency, a property called dispersion. Dispersion can be used to quantitatively characterize the viscoelasticity of the medium [27]. Supersonic Shear Imaging (SSI) [28, 29] and Shearwave Dispersion Ultrasound Vibrometry (SDUV) [27, 30] take advantage of the dispersive nature of soft tissue and can quantitatively solve for both tissue elasticity and viscosity.
To fully characterize the kidney, measurements of the elastic and viscous components of the tissue need to be measured. TE and MRE only measure the elastic part and not the viscous part of the tissue response. If viscosity is not taken into account, measurements of shear stiffness can be biased higher than their actual values [15, 31]. SSI can provide maps of stiffness and viscosity, but specialized hardware is necessary to implement this method. SDUV is capable of providing quantitative measurements of tissue viscosity, in addition to elasticity, and uses an intermittent pulse sequence that make SDUV compatible with current ultrasound scanners.
Mechanical testing is usually regarded as the gold standard method to evaluate mechanical properties of a material. Kidney mechanical properties have been studied with a variety of mechanical tests such as compression, tensile and shear tests [22, 25, 32]. In these studies, the general behavior of kidney has been characterized as non-linear and viscous. The elastic modulus (E) for kidney samples was reported as 4.8 MPa [22] and 14.7-40 kPa [25, 32] for complete kidney. A series of rheological tests on pig kidney samples have been performed by Nasseri, et al., to characterize kidney non-linear viscoelastic behavior [33]. It was found that the limit of linear viscoelasticity is of the order of 0.2 % strain, where the storage and loss modulus were 2.5 kPa and 1.5 kPa, respectively. Mechanical testing on kidney involves considerable technical difficulties as demonstrated by the wide range of values found on the literature. One of the major difficulties with testing kidney and other soft tissue is mounting the test specimens, because inadequate or inappropriate mounting results in failure or slippage in the grips of the test equipment. Additionally, soft tissues undergo considerable extension or compression at loads below the resolving capability of the measuring device. Tissue mechanical testing is useful for the purposes of comparative testing, but the inherent variability in biological tissue and the technical problems discussed above limits the usefulness of these measurements. As a result, tissue mimicking phantoms have been used to evaluate the accuracy of elasticity methods by classical mechanical test [34-38], including SDUV [31].
The motivation of this study is to facilitate future in vivo SDUV studies in kidney because visual inspection of the cross section of kidney shows that kidney tissue is inhomogeneous and anisotropic. In this paper, the assumption of linear tissue response to a harmonic excitation is studied as well as repeatability of the method, tissue homogeneity and tissue anisotropy in healthy swine kidneys. Moreover, long-term variability of kidney viscoelastic properties is studied as well as differences caused by exposure to formaldehyde. SDUV feasibility is demonstrated using two transducers as well as one transducer.
Although the motivation for developing elasticity imaging techniques relies on the possibility of diagnosing disease process, it is important to study the mechanical properties of healthy kidney. Additionally, such data can enhance clinical knowledge and improve understanding of the mechanical properties of tissues.
II. Methods
A. Principle of SDUV
Shearwave Dispersion Ultrasound Vibrometry (SDUV) applies a focused ultrasound beam to generate harmonic shear waves or impulse shear waves with many frequency components that propagate outward from the vibration center [39, 40]. Chen, et al., originally reported using modulated ultrasound to create harmonic shear waves to characterize the viscoelastic properties of gelatin phantoms using shear wave dispersion [39, 40]. A limitation of this method was that the modulation frequency had to be changed multiple times to evaluate the dispersion over a significant frequency bandwidth. This method was advanced to make faster measurements by transmitting repeated tonebursts of ultrasound [40]. The advantage of using these repeated tonebursts is that the shear waves have motion amplitudes with high signal-to-noise ratio at harmonics of the repetition frequency [40, 41]. This advance allows evaluation of the shear wave dispersion in a single measurement.
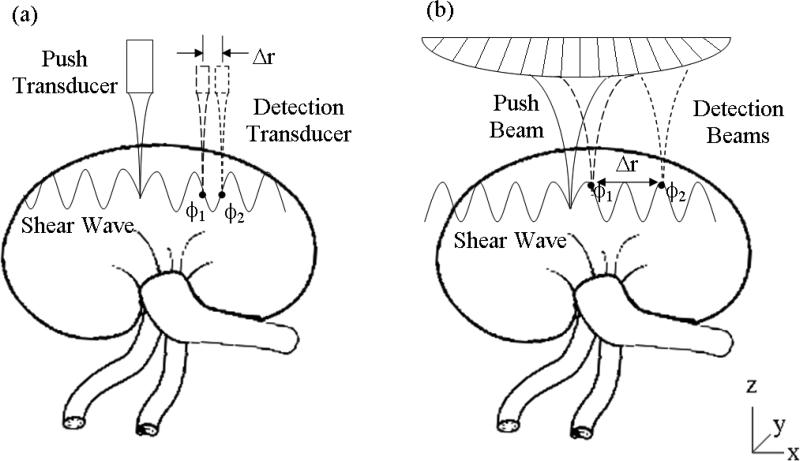
The shear wave speed is estimated from its phase measured at least at two locations separated by Δr along its traveling path (Figure 1):
| (1) |
where Δϕs = ϕ1 – ϕ2 is the phase change over the traveled distance Δr. Ultrasound pulses are repeatedly transmitted to the same detection location with a pulse repetition frequency (PRF) of several kilohertz. A fixed time point in the echo corresponding to a selected tissue region along the ultrasound beam is used across all echoes to obtain the vibration versus time record as the shear wave passes that tissue region. A Kalman filter is then applied to the vibration-time record to lock-in and extract only the signal at the shear wave frequency and its harmonics [42]. Although estimates of both amplitude and phase of tissue vibration are provided by the Kalman filter, only phase is used by SDUV. Then the detect ultrasound beam is focused at other locations along the shear wave propagation path to repeat measurement of shear wave phase. Generally, a regression is made on the phase versus distance over multiple locations to improve wave speed estimation.
Figure 1.
(a) Illustration of the experimental setup to do SDUV with two transducers. (b) Implementation of SDUV with a curved array transducer. SDUV applies a localized force generated by a ‘Push Transducer’ or by a electronically focused push (‘Push Beam’) coupled to the tissue, transmitting repeated ultrasound tone bursts of ultrasound. To detect shear wave propagation, a separate transducer acts as the detector (‘Detection Transducer’) and is moved to detect the shear wave motion at several spatial locations or same transducer is used to detect tissue response (‘Detection Beams’).
A rheological model is required to estimate shear elasticity and shear viscosity. The most common rheological models are the Voigt and the Maxwell model. The Voigt model has been shown to be appropriate for describing viscoelastic properties of tissue in the low frequency range (50-500 Hz) [43-46]. For a viscoelastic, homogenous, isotropic material, the Voigt model relates the shear wave propagation speed, cs, and the frequency of shear wave, ωs by [43]
| (2) |
where ρ, μ1 and μ2 are the density, shear elasticity and shear viscosity of the medium, respectively. The shear wave speed is estimated with (1), dispersion measurements are then made by using a toneburst repetition frequency of 50 Hz and the resulting harmonics of 100 Hz, 150 Hz, 200 Hz, etc. arise and the shear wave speeds over this bandwidth are fit by (2) to solve for the shear elasticity and shear viscosity.
B. SDUV with two transducers
SDUV was first implemented using two transducers: one push transducer to generate shear waves and one detection transducer to monitor shear wave propagation. Figure 1(a) illustrates the setup to do SDUV with two transducers. Shear waves are generated with ultrasound radiation force at the “Push Transducer” focal point. The ‘Push Transducer’ has a diameter of 44 mm, a center frequency of 3 MHz and a focal length of 70 mm. This transducer was driven by a signal generator and 40 dB power amplifier. Shear waves generated at the transducer focal point propagate through renal tissue and vibration was detected by a single element transducer with a diameter of 12.5 mm, a center frequency of 5 MHz and a 50 mm focus length (‘Detection Transducer’). The ‘Push Transducer’ and ‘Detection Transducer’ were aligned confocally with a pulse-echo technique using a small sphere as a point of target. The force was localized 5 mm deep into the kidney surface. The pulse repetition frequency of pushes was 50 Hz. The propagation of the shear wave was tracked by the single element transducer in pulse-echo mode over a range of 5 mm along the x-axis. The ultrasound echoes were digitized at 100 MHz and processed by the previously described method [42] to estimate the shear wave phase.
C. SDUV with a single transducer
The SDUV setup illustrated in Figure 1(a) limits the clinical application of SDUV because it requires two transducers. To overcome this limitation, SDUV has been implemented on a Verasonics V-1 system. Figure 1(b) illustrates the setup used to do SDUV with a curved linear array transducer (C4-2, Philips Healthcare, Andover, MA). The Verasonics V-1 system (Verasonics, Redmond, WA) is a programmable ultrasound research platform that has 128 independent transmit channels and 64 receive channels. The system is integrated around a software-based beamforming algorithm that performs a pixel-oriented processing algorithm. This algorithm facilitates conventional and high frame rate imaging. The high frame rate imaging, using plane wave transmissions, is attractive for shear wave imaging because the full shear wave propagation can be captured in a two-dimensional plane [47]. This type of imaging is performed in Supersonic Shear Imaging [28], and has been shown to be useful in characterizing the multiple types of tissues in a single acquisition such as muscle layers overlying the liver [46]. The transmitter can produce long tonebursts with sustained high power necessary for generating radiation force.
A 3 MHz, 331 μs push beam was transmitted and focused in the renal cortex to generate shear waves in the medium. The push beam was repeated every 20 ms to get a pulse repetition frequency of 50 Hz. The mechanical response was measured with the same transducer with plane wave compounding imaging technique [47]. A set of 3 plane waves with different emission angles were transmitted at 6 kHz pulse repetition frequency (PRF). By coherently compounding each set of 3 plane waves, a compound image PRF of 2 kHz was produced. The push occurs at x = 0 mm, and causes shear displacements outward in the +x-, and –x directions. Local tissue displacement is estimated using 1-D autocorrelation between two compounded images [48].
III. Experiments
A total of eight excised kidneys from female pigs were used in these in vitro experiments. The kidneys were removed immediately after sacrifice and placed in saline solution at room temperature. A series of different tests were performed to evaluate the use of SDUV for measurements of the viscoelasticity of the excised kidney (Table I).
Table I.
Performed test to evaluate the use of SDUV for measurements of the viscoelasticity of the excised swine kidney.
| Kidney | 1 | 2 | 3 | 4 | 5 | 6 | 7 | 8 |
|---|---|---|---|---|---|---|---|---|
| Experiments | ||||||||
| Linearity Study | x | |||||||
| SDUV repeatability | x | x | x | x | x | x | x | x |
| Organ homogeneity | x | x | x | x | ||||
| Time influence | x | x | ||||||
| Formalin study | x | |||||||
| Anisotropy study | x | |||||||
| Transducers for SDUV | 2 | 2 | 2 | 2 | 2 | 2 | 2 | 1 |
| Time of experiment after animal sacrifice (hrs) | 21 | 15 | 24 | 3 | Every 3 hrs for 24 hrs | Every 3 hrs for 24 hrs | 3 | 3 |
| Shear wave direction* | ||||||||
| Tangential | x | x | x | x | x | x | x | x |
| Radial | x |
The tangential direction (y-axis) is where the shear wave propagate in a direction perpendicular to blood vessels and the radial direction (z-axis) is where the shear waves propagate in a direction parallel to blood vessel orientation
A. Linearity study
The radiation force density applied to a tissue can be described as:
| (3) |
where F is the acoustic radiation force, c is the speed of sound in the medium, α is the absorption coefficient of the medium and I is the in situ temporal average intensity at a given spatial resolution [49]. Given that the pressure is proportional to the voltage applied to the transducer and the ultrasound intensity is proportional to pressure squared, and the displacement is proportional to the force, then the tissue displacement is proportional to the square of the voltage applied to the “Push Transducer”. The assumption of linear tissue response to a harmonic excitation was studied by measuring shear wave dispersion at four different excitation voltage amplitudes (3.0 V, 2.6 V, 2.1 V and 1.5 V) on one excised kidney (Kidney #1, refer to Table I). Shear elasticity and shear viscosity were measured in a 5 × 5 mm2 patch 5 times.
B. SDUV repeatability
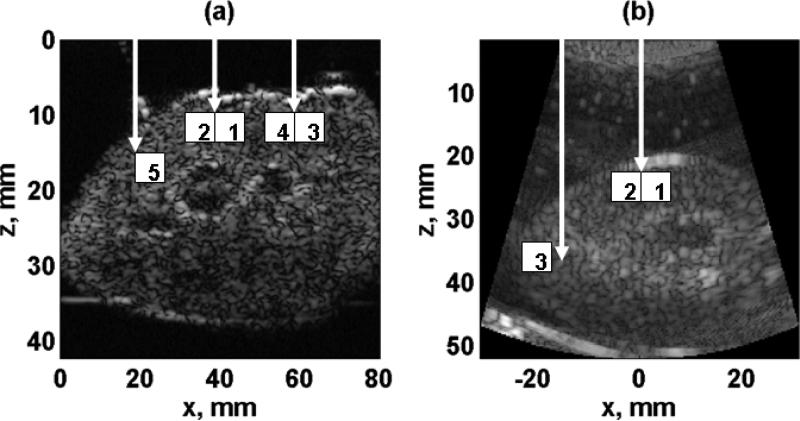
The repeatability of SDUV with both setups (SDUV with two transducers and SDUV with a curved linear array transducer) was evaluated. Figure 2(a) illustrates a B-mode image along zx-plane using the setup with two transducers. In this case, the SDUV repeatability was evaluated by repeating the SDUV measurement five times in a 5 × 5 mm2 patch in the renal cortex (ROI1 in Figure 2(a)) of seven kidneys (Kidneys #1-7, refer to Table I). Figure 2(b) illustrates a B-mode image along zx-plane using the setup with the curved linear array transducer. Similarly, the SDUV repeatability was evaluated by doing the SDUV measurement four times in a 5 × 5 mm2 patch in the renal cortex (ROI1 in Figure 2(b)) of one kidney (Kidney #8, refer to Table I).
Figure 2.
(a) Two transducer setup. B-mode image along zx-plane. The beam was focused at 3 locations (white arrows). The motion was tracked along 5 regions of 5 × 5 mm along x-axis (white squares). (b) Curved array transducer setup. B-mode image along zx-plane. Shear waves propagating perpendicular to blood vessels (tangential direction) were generated by a push beam focused at x = 0 (ROI 1 and 2). Shear waves propagating parallel to blood vessels (radial direction) were generated by a push beam focused at the edge of the kidney (ROI 3).
C. Organ homogeneity
Visual inspection of the cross section of the kidney reveals that the kidney tissue is globally inhomogeneous. To study this feature, the organ variability of renal cortex shear elasticity and shear viscosity was studied by doing SDUV measurements at five different locations (Figure 2(a), ROI1, ROI2, ROI3, ROI4 and ROI5) in different 5 × 5 mm2 patches in four kidneys (Kidneys #1-4, refer to Table I). Furthermore, a 5 × 5 mm2 patch was studied every 1 mm on z-axis (ROI2 in Figure 2(a)) in one kidney (Kidneys #2, refer to Table I).
D. Anisotropy study
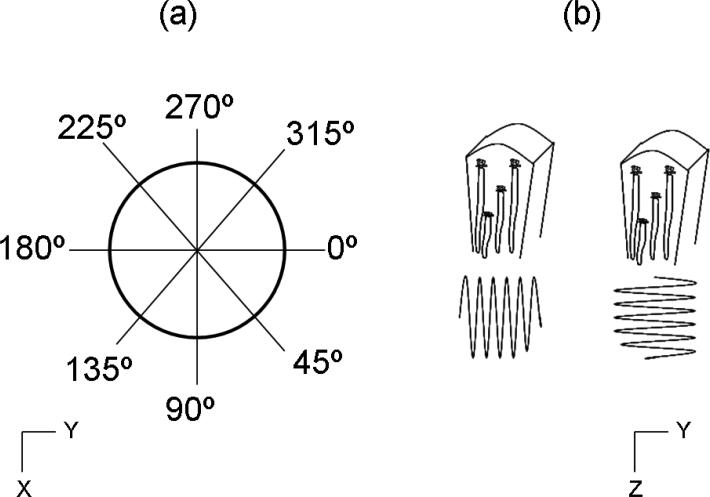
It is acknowledged that kidney tissue may not be isotropic, in other words, its properties are not the same for all orientations of the coordinate axes. To study this feature, SDUV measurements were made in 5 × 5 mm2 patches on zx- and zy-planes every 45° with respect to the z-axis (Figure 3(a)). Additionally, shear waves were generated in two different directions. Figure 3(b) depicts these orientations. In the tangential excitation (y-axis Figure 3(b)), the shear wave propagates in a direction perpendicular to blood vessels, and in the radial excitation (z-axis Figure 3(b)), the shear wave propagates in a direction parallel to blood vessel orientation. These SDUV measurements were made in one excised kidney (Kidney #8, refer to Table I.).
Figure 3.
(a) SDUV measurements were made every 45° respect to z-axis. (b) Shear waves were generated in two different directions. The blood vessels are running vertically in the kidney section shown. In the tangential direction (y-axis), the shear wave propagates in a direction perpendicular to blood vessels, and in the radial direction (z-axis) the shear wave propagates in a direction parallel to blood vessel orientation.
E. Time influence
To evaluate the long-term variability of ex vivo kidney viscoelastic properties, shear elasticity and shear viscosity were measured at one location in a 5 × 5 mm2 patch five times. Measurements were made from 3 hours after sacrifice over 24 hours every 3 hours in two kidneys (Kidney #5 and #6, refer to Table I). During the course of the experiment, the kidneys were placed in saline solution at room temperature.
F. Formalin study
Tissue stiffness can be increased by inducing collagen cross-link with aldehydes [50-54]. Differences in the material properties in the renal cortex when exposed to a chemical agent that changed the tissue structure and stiffness were explored. To test the level of contrast of SDUV for different tissue state, SDUV measurements were made in an excised kidney (Kidney #7, refer to Table I) before and after immersion in 10% formaldehyde for 3 hours. Renal cortex shear elasticity and shear viscosity measurements were performed at 17 different locations in 5 × 5 mm2 patches.
G. Statistical analysis
Results are reported as mean ± standard deviation. The number of samples, repetitions and size of regions on interest (ROI) were made on the basis of the data and the degree of their scatter and reproducibility. Univariate analysis of variance (ANOVA) was used to test for statistically significant differences among variables for the different experiments. Because the kidney is modeled as a viscoelastic material, differences in shear wave speed between various excitation frequencies in one excised kidney (Kidney #1, refer to Table I) were studied. To investigate renal cortex homogeneity, shear elasticity and shear viscosity among one region and five different regions in one kidney (Kidney #2, refer to Table I) were compared. To study the time influence effect in both shear elasticity and shear viscosity, μ1 and μ2 at different time frames for two individual kidneys (Kidney #5 and #6, refer to Table I) were compared. Additionally, shear elasticity of kidneys at specific time frames were compared. A paired t-test was used to investigate the level of contrast of SDUV for different tissue state in the formalin study. To study the anisotropy of the kidney, shear elasticity and shear viscosity of different angles and different shear wave propagation directions were compared. Statistical significance for all tests was accepted for p ≤ 0.05.
Signal-to-noise ratio (SNR) was calculated to characterize how the real measurements were disturbed by noise. SNR was calculated as the ratio of mean to standard deviation of measurements.
IV. Results
A. Linearity study
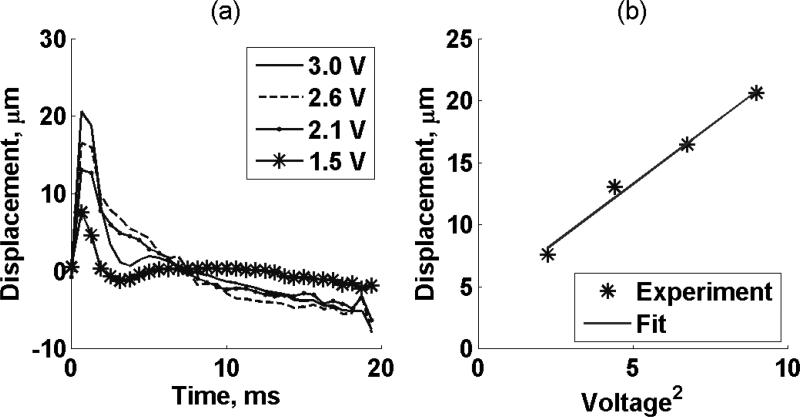
The displacement amplitude estimates over 20 ms for four different excitation voltage amplitudes (3.0 V, 2.6 V, 2.1 V and 1.5 V) in one excised kidney (Kidney #1, refer to Table I) were calculated by cross-spectrum methods [55] and are shown in Figure 4(a). Tissue peak displacement as a function of voltage squared is shown in Figure 4(b). The solid line is a linear fit to the experimental data. The coefficient of determination, R2, of the linear regression was 0.99.
Figure 4.
(a) Displacement amplitude estimates over 20 ms. Symbols represent four different excitation voltage amplitudes (3.0 V, 2.6 V, 2.1 V and 1.5 V) in one excised kidney (Kidney #1, refer to Table I). (b) Tissue peak displacement versus voltage squared. The solid line is a linear fit to the experimental data.
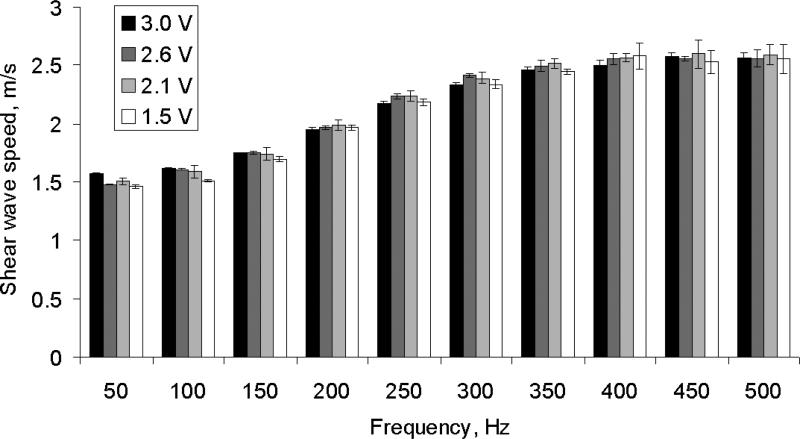
The mean shear wave propagation speed in a 5 × 5 mm2 region as a function of frequency measured at four different excitation amplitudes is shown in Figure 5. The symbols represent four different excitation voltage amplitudes (3.0 V, 2.6 V, 2.1 V and 1.5 V) on one excised kidney (Kidney #1, refer to Table I).
Figure 5.
Shear wave propagation speed (Mean ± SD) of a 5 × 5 mm region as a function of frequency. The symbols represent four different excitation voltage amplitudes (3.0 V, 2.6 V, 2.1 V and 1.5 V) on one excised kidney (Kidney #1, refer to Table I).
B. SDUV repeatability
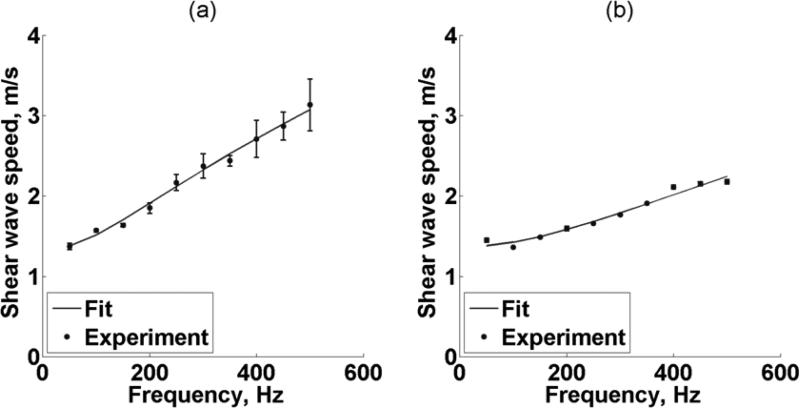
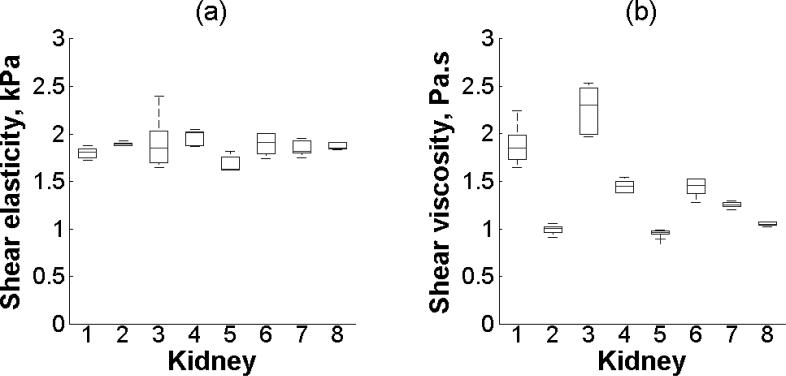
Figure 6(a) shows repeatability of SDUV with the setup using two transducers. The shear wave propagation speed as a function of frequency was measured along the x-axis within the 5 × 5 mm2 ROI1 five times (Kidney #1, refer to Table I). The wave speed values (symbols) are an average of five acquisitions. The shear wave speed is significantly different at each frequency (p < 0.001). The solid line is the fit from (2) that gives a shear elasticity μ1 = 1.7 kPa and shear viscosity μ2 = 1.8 Pa·s. The minimum SNR is 25 and 10 for the shear elasticity and shear viscosity, respectively. The shear wave speed dispersion fit had a Mean Square Error (MSE) of 0.004 m2/s2. Figure 6(b) illustrates repeatability of SDUV with the curved linear array transducer. The shear wave propagation speed as a function of frequency was measured along x-axis on 5 × 5 mm2 patch four times (Kidney #8, refer to Table I). The wave speed values (symbols) are an average of four acquisitions. The shear wave speed is significantly different at each frequency (p < 0.001). The solid line is the fit from (2) that gives a shear elasticity μ1 = 1.9 kPa and shear viscosity μ2 = 1.1 Pa·s. The minimum SNR is 52 and 53 for both shear elasticity and shear viscosity, respectively. The shear wave speed dispersion fit had a MSE of 0.005 m2/s2. Renal cortex shear elasticity and shear viscosity in a 5 × 5 mm2 patch five times of seven kidneys (Kidney #1-7, refer to Table I) and four times of one kidney (Kidney #8, refer to Table I) are shown in Figure 7. There is no statistically significant difference in shear elasticity among the 8 kidneys (p = 0.06). On the other hand, there is a statistically significant difference in shear viscosity among the 8 kidneys (p < 0.01). The minimum SNR is 6 and 8 for shear elasticity and shear viscosity, respectively.
Figure 6.
(a) Repeatability of SDUV with two transducers. (b) Repeatability of SDUV with array transducer. The symbols represent shear wave propagation speed (Mean ± SD) as a function of frequency measured along x-axis on 5 × 5 mm ROI1 five times (Kidney #1, refer to Table I) for (a) and four times (Kidney #8, refer to Table I) for (b). The solid line is the fit from (2).
Figure 7.
Box and whisker diagram for (a) shear elasticity and (b) shear viscosity of a 5 × 5 mm region in 8 kidneys. The box and whisker diagrams were made with five measurements (Kidney #1-7, refer to Table 1.) and four measurements (Kidney #8, refer to Table 1.) of one ROI. The bottom and top of each box represent the lower and upper quartiles, respectively. The horizontal line within the box is the median. The ends of the whiskers represent the minimum and maximum of each group.
C. Organ homogeneity
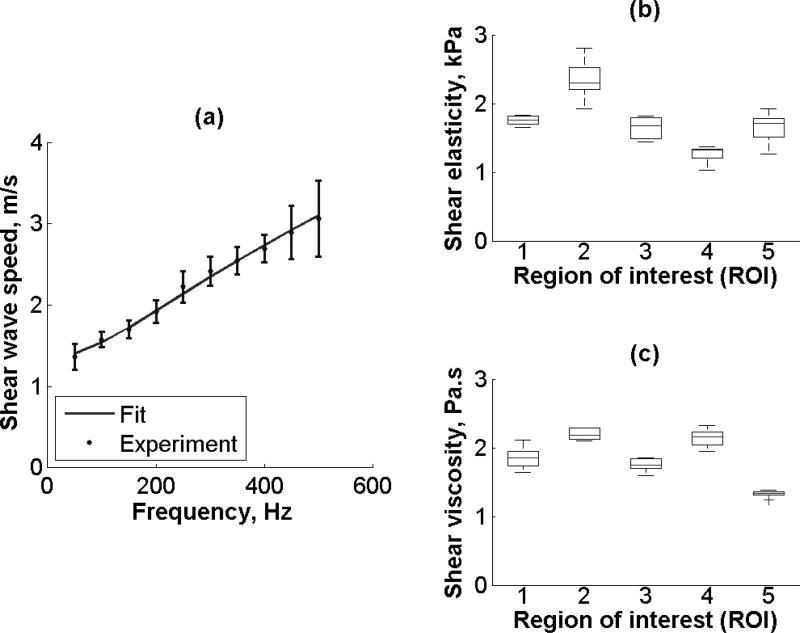
Figure 8(a) shows variability of renal cortex in one kidney (Kidney #2, refer to Table I), the average shear wave propagation speed of five ROIs as a function of frequency measured along the x-axis in a 5 × 5 mm2 area. The shear wave speed is statistically significant different at each frequency regardless of the region (p < 0.001). The solid line is the fit from (2) that gives μ1 = 1.8 kPa and μ2 = 1.9 Pa·s. The shear wave speed dispersion fit had a MSE of 0.003 m2/s2. Shear elasticity and shear viscosity estimated by (2) from five different regions and five repetitions is shown in Figure 8(b) and Figure 8(c), respectively. There is a statistically significant difference in shear elasticity and shear viscosity among the five regions (p < 0.001). The minimum SNR is 5 for shear elasticity and 6 for viscosity.
Figure 8.
(a) The symbols represent shear wave propagation speed (Mean ± SD) of five ROIs as a function of frequency measured along x-axis in a 5 × 5 mm area (Kidney #2, refer to Table I). The solid line is the fit from (2). Box and whisker diagram for (b) shear elasticity and (c) shear viscosity among five different regions of interest (ROI) in one kidney (Kidney #2, refer to Table 1.). The box and whisker diagrams were made with five measurements on each individual region. The bottom and top of each box represent the lower and upper quartiles, respectively. The horizontal line within the box is the median. The ends of the whiskers represent the minimum and maximum of each group.
Shear elasticity and shear viscosity of four kidneys (Kidney #1-4, refer to Table 1.) among four ROIs is summarized in Table II. The minimum SNR is 5 for both the shear elasticity and shear viscosity, respectively.
Table II.
Shear elasticity and shear viscosity (Mean ± SD) of four ROIs in four kidneys.
| Kidney | 1 | 2 | 3 | 4 |
|---|---|---|---|---|
| Shear elasticity, kPa | 1.80 ± 0.38 | 1.79 ± 0.14 | 2.09 ± 0.27 | 1.89 ± 0.06 |
| Shear viscosity, Pa·s | 1.87 ± 0.26 | 1.12 ± 0.22 | 2.08 ± 0.24 | 1.36 ± 0.22 |
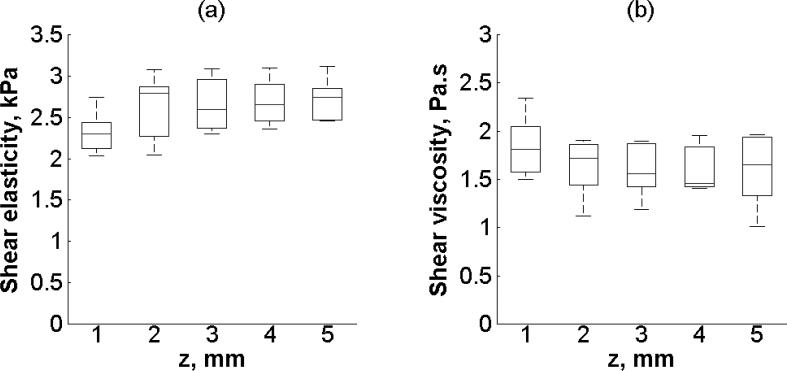
Figure 9 shows the variability of renal cortex shear elasticity and shear viscosity in a 5 × 5 mm2 ROI every 1 × 5 mm2 of one kidney (Kidney #2, refer to Table I). Shear elasticity and shear viscosity estimated by (2) from five different regions and five repetitions is shown in Figure 9(a) and Figure 9(b), respectively. There is no statistically significant difference in shear elasticity among the five regions (p = 0.3120). Similarly, there is no statistically significant difference in shear viscosity among the five regions (p = 0.7188). The minimum SNR is 6 and 4 for shear elasticity and shear viscosity, respectively.
Figure 9.
Box and whisker diagram for (a) shear elasticity and (b) shear viscosity among z-axis on ROI2 on one kidney (Kidney #2, refer to Table 1.). The box and whisker diagrams were made with five measurements on each individual region. The bottom and top of each box represent the lower and upper quartiles, respectively. The horizontal line within the box is the median. The ends of the whiskers represent the minimum and maximum of each group.
D. Anisotropy study
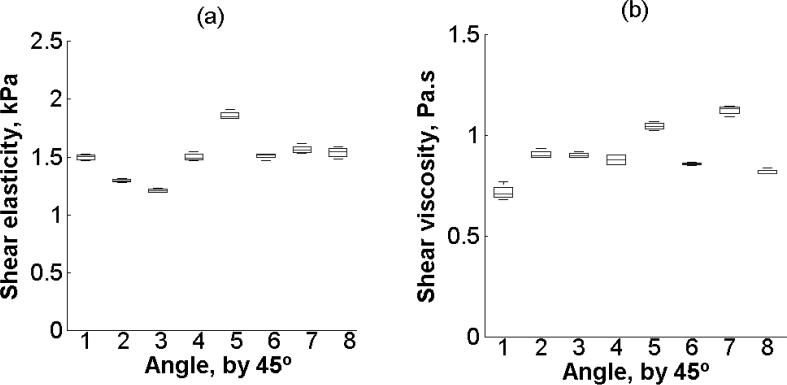
Shear elasticity and shear viscosity estimated by (2) from eight different angles (from 0° to 315° every 45°, refer to Figure 3(a)) and four repetitions is shown in Figures 10(a) and 10(b), respectively. There is a statistically significant difference in shear elasticity among the eight angles (p < 0.001). Similarly, there is statistically significant difference in viscosity among the 8 angles (p < 0.001). The minimum SNR is 34 and 19 for shear elasticity and shear viscosity, respectively.
Figure 10.
Box and whisker diagram for (a) shear elasticity and (b) shear viscosity among eight different angles on one kidney (Kidney #8, refer to Table 1.). The box and whisker diagrams were made with four measurements at each individual angle. The bottom and top of each box represent the lower and upper quartiles, respectively. The horizontal line within the box is the median. The ends of the whiskers represent the minimum and maximum of each group.
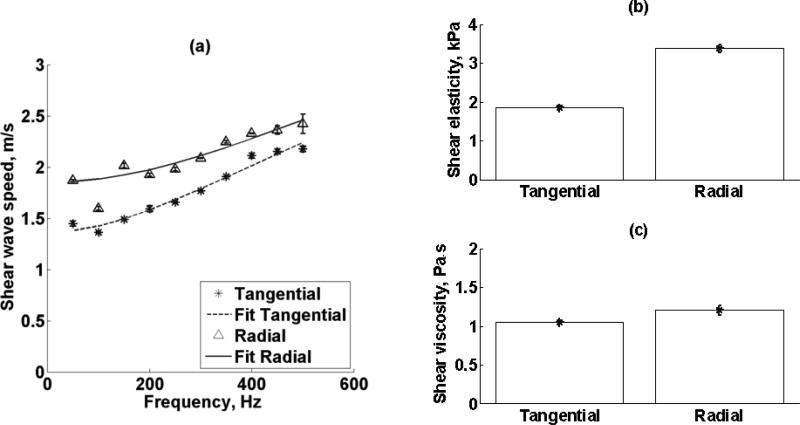
Shear wave propagation speed (mean ± standard deviation) as a function of frequency measured four times in a 5 × 5 mm2 patch for both tangential and radial excitation (Refer to Fig. 3(b)) of one kidney (Kidney #8, refer to Table I) is shown in Figure 11(a). Renal cortex shear elasticity and shear viscosity values measured in one kidney (Kidney #8, refer to Table I) with shear waves propagating along the tangential direction and radial direction (refer to Figure 3(b)) are shown in Figures 17(b) and 17(c), respectively. Both shear elasticity and shear viscosity were different when comparing tangential versus radial direction.
Figure 11.
(a) Renal cortex shear wave propagation speed (mean ± standard deviation) as a function of frequency measured four times in a 5 × 5 mm region for both tangential and radial excitation (Refer to Fig. 3(b)) of one kidney (Kidney #8, refer to Table I). Renal cortex (a) shear elasticity and (b) shear viscosity measurements made in one kidney (Kidney #8, refer to Table I) with shear waves propagating along the tangential direction and radial direction (refer to Figure 3(b)). Both shear elasticity and shear viscosity were different when comparing tangential versus radial direction.
E. Time influence
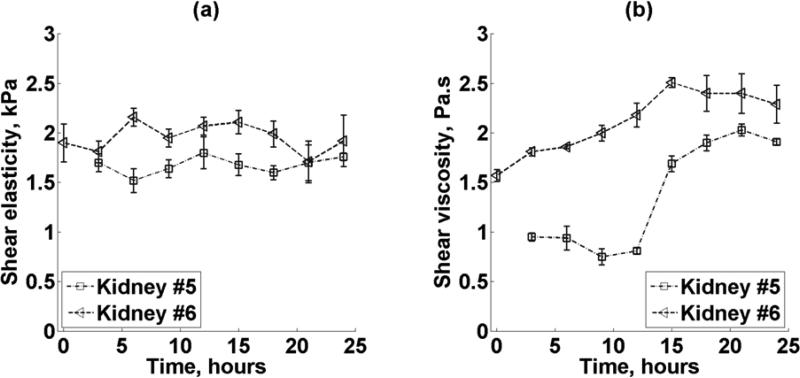
Renal cortex shear elasticity and shear viscosity versus time after sacrifice for two kidneys (Kidneys #5-6, refer to Table I) is shown in Figures 12(a) and 12(b), respectively. The different symbols represent mean ± standard deviation of four 5 × 5 mm2 regions in each of the two kidneys. Dashed lines represent the trends of kidney #5 and trend of kidney #6 over time.
Figure 12.
(a) Renal cortex shear elasticity and (b) shear viscosity versus time after sacrifice for two kidneys (Kidney #5-6, refer to Table I). The different symbols represent mean ± standard deviation of four 5 × 5 mm2 regions in each of the two kidneys. Dashed lines represent the trends of kidney #5 and #6.
There is a statistically significant difference in shear elasticity in kidney #6 among the 9 time periods (p = 0.01). On the other hand, there is no statistically significant difference in shear elasticity on kidney #5 among the 8 time periods (p = 0.072). Moreover, after 3, 21 and 24 hours of sacrifice, there is no significant difference in shear elasticity between kidneys #5, #6 (p = 0.405, p = 0.855, p = 0.243).
There is a statistically significant difference in shear viscosity in kidneys #5 and #6 among the 8 and 9 time periods, respectively (p < 0.001).
F. Formalin study
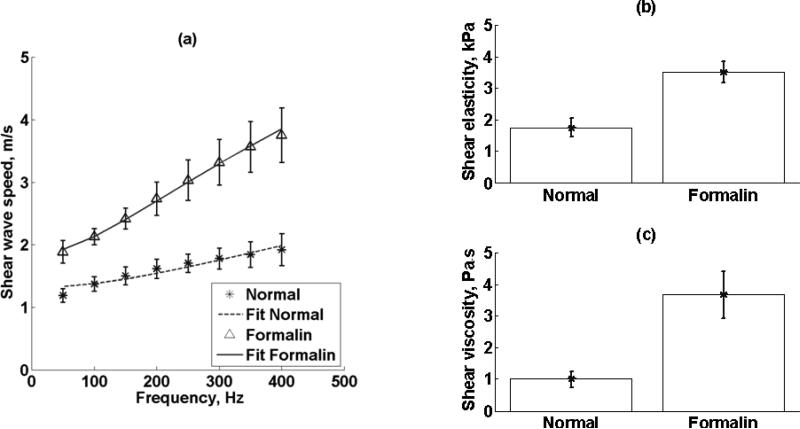
Renal cortex shear wave propagation speed (mean ± standard deviation) as a function of frequency measured in 17 different locations in 5 × 5 mm2 patches before and after formalin immersion of one kidney (Kidney #7, refer to Table I) is shown in Figure 13(a). Renal cortex shear elasticity and shear viscosity values made in one kidney (Kidney #7, refer to Table I) before and after formalin immersion are shown in Figure 13(b) and Figure 13(c), respectively. Both shear elasticity and shear viscosity were significantly different when comparing normal versus formalin (p < 0.001) using a paired t-test.
Figure 13.
(a) Renal cortex shear wave propagation speed (mean ± standard deviation) as a function of frequency measured in 17 different locations in 5 × 5 mm regions before and after formalin immersion of one kidney (Kidney #7, refer to Table I). Renal cortex (b) shear elasticity and (b) shear viscosity values made in one kidney (Kidney #7, refer to Table I) before and after formalin immersion. Both shear elasticity and shear viscosity were significantly different when comparing normal versus formalin (p < 0.001).
V. Discussion
This study reports quantitative measurements of shear elasticity and viscosity in excised swine kidneys measured by SDUV over a number of different experimental variations. Figure 5 shows a rather constant shear wave speed versus frequency despite excitation amplitude variation. Moreover, the significant linear relationship between the tissue displacement and voltage squared in Figure 4(a), agree with our assumption of proportionality between these variables.
The shear wave speeds shown in Figure 6(a) and Figure 6(b) are statistically significantly different at each frequency, which supports our assumption of viscoelasticity, which results in shear wave speed dispersion. Therefore, to estimate the viscoelastic properties of the kidney, a rheological model should be used. In this study, the dispersion data fit well with the use of the Voigt model over the studied frequency domain. Although Figure 6(a) shows higher variation of shear wave speed for high frequencies (350-500 Hz) compared to Figure 6(b), the SNR using the two transducer setup was higher than 10 for both shear elasticity and shear viscosity. However, the error of the wave speed estimates is expected to increase at high frequencies because the displacement amplitude decreases [56]. Additionally, SNR was higher than 50 for both shear elasticity and shear viscosity measurements when using the curved array transducer, however, these measurements were made without any overlying tissue, so it is expected that when applied in vivo, radiation force and thereby shear wave motion will decrease leading to smaller values of SNR.
Equation (2) assumes a homogeneous material. Given that the kidney is inhomogeneous by visual inspection, this assumption may not be accurate. However, in this study, shear elasticity and shear viscosity were estimated in fairly small regions of interest, 5 × 5 mm2 regions. Furthermore, a detailed analysis of the 5 × 5 mm2 ROIs (refer to Figure 9) showed no statistically significant difference in shear elasticity and shear viscosity within the ROI, supporting the assumption of local homogeneity. The global inhomogeneity of kidney was studied by measuring SDUV in a single kidney in different ROIs. Not surprisingly, both shear elasticity and shear viscosity (refer to Figure 8) were statistically significantly different in five different regions on one kidney (Kidney #2, refer to Table 1.), which suggests global inhomogeneity. Although the architecture of renal cortex blood vessels has been studied using microcomputed tomography (micro CT) in pig kidneys by Bentley, et al., the cortical microvasculature number and size vary among different region in the renal cortex, which suggest that the renal cortex is inhomogeneous [57]. Similarly, our results suggest local homogeneity in 5 × 5 mm2 ROIs when using SDUV.
Another assumption of Equation (2) is tissue isotropy. One of the functions of the kidneys is to transport water, and structures like blood vessels, tubules and collecting ducts are oriented in certain manner. This feature brings the advantage of characterizing kidney anisotropic properties by measuring its water diffusion properties with magnetic resonance diffusion weighted imaging (MR-DWI). Ries, et al., have studied human kidney diffusion isotropy, and there is fairly general anisotropic behavior in renal cortex [58]. Moreover, diffusion coefficients were highest in a superior-inferior direction compared to left-right direction respect to anatomical position. Tissue anisotropy has been studied with elasticity imaging mostly in skeletal and cardiac muscle [40, 44, 59], for instance, shear elasticity and shear viscosity of muscle is different across fibers and along fibers. Similarly, SDUV measurements of kidney mechanical properties by inducing shear waves with two directions indicate renal cortex anisotropy. Two values for shear elasticity and shear viscosity were found depending on shear wave propagation direction as shown in Figure 11. Interestingly, both shear elasticity and shear viscosity were similar when the shear wave propagated along the x- and y-axes (Figure 10) but different along the z-axis (Figure 11).
The renal cortex shear elasticity was relatively consistent among seven kidneys (refer to Figure 7(a)), however, shear viscosity was rather different (refer to Figure 7(b)). This variability in shear viscosity may be attributed to the different time where the experiments were done after the animal sacrifice (refer to Table 1.). To test this hypothesis, the long-term time variability experiments showed a statistically significant difference on shear viscosity over 24 hours, which supports the previous hypothesis that viscosity may be sensitive to tissue changes over time after excision. Interestingly, there was a statistically significant difference in shear elasticity over 9 periods of time for one kidney, which could be attributed to the global inhomogeneities of renal cortex previously discussed.
The reactions of formaldehyde (FA) with proteins have been extensively studied. The most important of these is probably the formation of methylene bridges which cross-link polypeptides at reactive side groups [50]. It is well known that aldehydes increase tissue stiffness. For instance, R. Van, et al., have studied how aldehydes affect the mechanical behavior of bovine pericardium [52]. Tensile tests were performed on fresh tissue, and after 0.5, 1, 2, 6, 24 h and 7 days of glutaraldehyde (GA) 0.5% treatment. The exposure to GA results in a significant increase in the stiffness of the tissue at low levels of stress. Moreover, the introduction of cross-links by GA causes resistance to the rearrangement of collagen in the direction of the applied load. A similar study by Sung, et al., in porcine pericardia, where free amino group content and tensile tests were performed after FA and GA exposure for 3 days, reported significant reductions in free amino groups content as compared to fresh ones [54]. This suggests that FA and GA were effective cross-linking agents. Tensile stresses of the FA and GA tissues were relatively grater than fresh ones, indicating that cross-linking of the amino groups within the biological tissue change the biological strength of tissues. Elasticity imaging techniques have been used to study aldehyde exposure effects in excised kidneys. Emelianov, et al., reported an increase in elasticity due to different tissue state was observed when GA was injected into an excised kidney [60]. Similarly, the level of contrast of SDUV for different tissue state was studied. Shear wave speed dispersion on kidney before and after immersion in 10% formalin clearly illustrate differences in both tissue states (Figure 13). Moreover, both shear elasticity and viscosity were statistically significantly different on kidney before and after immersion in 10% formalin, which agree with the literature.
The shear elasticity measurements presented in this study are rather similar to previous estimates in the literature. For instance, an MRE study on excised pig kidneys provided an estimate of approximately μ1 = 2 kPa [15]. In vivo MRE and SDUV studies of kidney mechanical properties consequent to perfusion report a shear elasticity and viscosity of 3-4 kPa and of 3 Pa.s, respectively [21, 61, 62]. The in vitro shear modulus is less than that at total occlusion since the renal tissue is comprised of residual perfusion at 100% occlusion, while the in vitro kidney is devoid of residual perfusion.
Finally, although this study demonstrates the feasibility of SDUV using a curved array transducer to study excised kidney, there may be some limitations when studying in vivo kidneys. For instance, endogenous motion from the kidney from pulsating blood vessels and gross patient motion may degrade results, however, in most cases these can be filtered out because it has low-frequency content (< 10 Hz) and SDUV measurements are made very quickly 0.1-0.2 seconds. Another limitation may be depth of kidney, the native kidney depth ranges from 45-75 mm [63], although shear waves using tangential excitation using a curved linear array can be excited and measured, optimization would have to be performed in terms of ultrasound frequency and signal processing techniques to obtain high quality echo data for motion tracking of the waves. Some of these aspects have been addressed in ongoing animal studies such as motion effects reported recently by Amador, et al [62].
VI. Conclusion
Shearwave Dispersion Ultrasound Vibrometry provides a fast, low cost, noninvasive tool to measure not only tissue shear elasticity but also tissue shear viscosity. This study showed the feasibility of SDUV to estimate both shear elasticity and shear viscosity of renal cortex in vitro with good precision using experimental configurations with two transducers and a curved linear array transducer. A number of experimental variables were varied to evaluate measurement linearity, and repeatability. Viscoelastic renal material properties versus tissue inhomogeneity, tissue anisotropicity, time variability after organ excision, and structural changes after immersion in a cross-linking agent were evaluated. The measurement results of these tests provided insights that will be important for extending SDUV measurements of kidney to an in vivo setting. Future work includes in vivo measurements of renal viscoelastic properties under different physiological conditions and disease states.
Acknowledgments
This work was supported in part by grant number DK082408 from the National Institutes of Health.
Footnotes
Disclosure: Mayo Clinic and Drs. Chen and Greenleaf have a financial interest associated with technology used in this research; the technology has been licensed to industry for Research and Development.
References
- 1.Liu YH. Renal fibrosis: New insights into the pathogenesis and therapeutics. Kidney International. 2006 Jan;69:213–217. doi: 10.1038/sj.ki.5000054. [DOI] [PubMed] [Google Scholar]
- 2.Sarvazyan AP, et al. Shear wave elasticity imaging: A new ultrasonic technology of medical diagnostics. Ultrasound Med. Biol. 1998;24:1419–1435. doi: 10.1016/s0301-5629(98)00110-0. [DOI] [PubMed] [Google Scholar]
- 3.Ophir J, et al. Elastography: a quantitative method for imaging the elasticity of biological tissues. Ultrasonic Imaging. 1991 Apr;13:111–34. doi: 10.1177/016173469101300201. [DOI] [PubMed] [Google Scholar]
- 4.Emelianov SY, et al. Elasticity imaging for early detection of renal pathology. Ultrasound in Medicine & Biology. 1995;21:871–883. doi: 10.1016/0301-5629(94)00146-5. [DOI] [PubMed] [Google Scholar]
- 5.Chaturvedi P, et al. Ultrasonic and elasticity imaging to model disease-induced changes in soft-tissue structure. Medical Image Analysis. 1998;2:325–338. doi: 10.1016/s1361-8415(98)80014-5. [DOI] [PubMed] [Google Scholar]
- 6.Emelianov SY, et al. Reconstructive ultrasound elasticity imaging for renal transplant diagnosis: kidney ex vivo results. Ultrasonic Imaging. 2000;22:178–194. doi: 10.1177/016173460002200303. [DOI] [PubMed] [Google Scholar]
- 7.Weitzel WF, et al. Feasibility of applying ultrasound strain imaging to detect renal transplant chronic allograft nephropathy. Kidney International. 2004;65:733–736. doi: 10.1111/j.1523-1755.2004.00435.x. [DOI] [PubMed] [Google Scholar]
- 8.Weitzel WF, et al. Renal advances in ultrasound elasticity imaging: Measuring the compliance of arteries and kidneys in end-stage renal disease. Blood Purification. 2005;23:10–17. doi: 10.1159/000082005. [DOI] [PubMed] [Google Scholar]
- 9.Nightingale KR, et al. On the feasibility of remote palpation using acoustic radiation force. Journal of the Acoustical Society of America. 2001 Jul;110:625–34. doi: 10.1121/1.1378344. [DOI] [PubMed] [Google Scholar]
- 10.Fahey BJ, et al. In vivo visualization of abdominal malignancies with acoustic radiation force elastography. Physics in Medicine and Biology. 2008 Jan;53:279–293. doi: 10.1088/0031-9155/53/1/020. [DOI] [PMC free article] [PubMed] [Google Scholar]
- 11.Sandrin L, et al. Time-resolved pulsed elastography with ultrafast ultrasonic imaging. Ultrasonic Imaging. 1999 Oct;21:259–72. doi: 10.1177/016173469902100402. [DOI] [PubMed] [Google Scholar]
- 12.Catheline S, et al. A solution to diffraction biases in sonoelasticity: the acoustic impulse technique. Journal of the Acoustical Society of America. 1999 May;105:2941–50. doi: 10.1121/1.426907. [DOI] [PubMed] [Google Scholar]
- 13.Arndt R, et al. Noninvasive evaluation of renal allograft fibrosis by transient elastography - a pilot study. Transplant International. 2010 Sep;23:871–877. doi: 10.1111/j.1432-2277.2010.01057.x. [DOI] [PubMed] [Google Scholar]
- 14.Muthupillai R, et al. Magnetic resonance elastography by direct visualization of propagating acoustic strain waves. Science. 1995 Sep 29;269:1854–7. doi: 10.1126/science.7569924. [DOI] [PubMed] [Google Scholar]
- 15.Kruse SA, et al. Tissue characterization using magnetic resonance elastography: preliminary results. Physics in Medicine and Biology. 2000 Jun;45:1579–1590. doi: 10.1088/0031-9155/45/6/313. [DOI] [PubMed] [Google Scholar]
- 16.Sinkus R, et al. High-resolution tensor MR elastography for breast tumour detection. Phys Med Biol. 2000 Jun;45:1649–64. doi: 10.1088/0031-9155/45/6/317. [DOI] [PubMed] [Google Scholar]
- 17.Shah NS, et al. Evaluation of renal parenchymal disease in a rat model with magnetic resonance elastography. Magn Reson Med. 2004 Jul;52:56–64. doi: 10.1002/mrm.20101. [DOI] [PubMed] [Google Scholar]
- 18.Yin M, et al. International Society for Magnetic Resonance in Medicine. Honolulu, HI: 2009. Assessment of kidney stiffness in a swine model of renal arterial stenosis with 7-D MR elastography. [Google Scholar]
- 19.Warner L, et al. Internation Society for Magnetic Resonance in Medicine. Honolulu, HI: 2009. Kidney stiffness measured in an animal model of unilateral renal arterial stenosis using 2D MR elastography. [Google Scholar]
- 20.Yin M, et al. Abdominal magnetic resonance elastography. Topics in Magnetic Resonance Imaging. 2009;20:79–87. doi: 10.1097/RMR.0b013e3181c4737e. [DOI] [PMC free article] [PubMed] [Google Scholar]
- 21.Warner L, et al. Noninvasive in vivo Assessment of Renal Tissue Elasticity During Graded Renal Ischemia Using MR Elastography. Investigative Radiology. 2011 doi: 10.1097/RLI.0b013e3182183a95. In press. [DOI] [PMC free article] [PubMed] [Google Scholar]
- 22.Farshad M, et al. Material characterization of the pig kidney in relation with the biomechanical analysis of renal trauma. Journal of Biomechanics. 1999 Apr;32:417–425. doi: 10.1016/s0021-9290(98)00180-8. [DOI] [PubMed] [Google Scholar]
- 23.Miller K. Constitutive modelling of abdominal organs. Journal of Biomechanics. 2000;33:367–373. doi: 10.1016/s0021-9290(99)00196-7. [DOI] [PubMed] [Google Scholar]
- 24.Nasseri S, et al. Viscoelastic properties of pig kidney in shear, experimental results and modelling. Rheologica Acta. 2002;41:180–192. [Google Scholar]
- 25.Bschleipfer T, et al. Blunt renal trauma: biomechanics and origination of renal lesions. European Urology. 2002;42:614–621. doi: 10.1016/s0302-2838(02)00437-2. [DOI] [PubMed] [Google Scholar]
- 26.Snedeker JG, et al. Strain energy density as a rupture criterion for the kidney: impact tests on porcine organs, finite element simulation, and a baseline comparison between human and porcine tissues. Journal of Biomechanics. 2005 May;38:993–1001. doi: 10.1016/j.jbiomech.2004.05.030. [DOI] [PubMed] [Google Scholar]
- 27.Chen S, et al. Quantifying elasticity and viscosity from measurement of shear wave speed dispersion. Journal of the Acoustical Society of America. 2004 Jun;115:2781–5. doi: 10.1121/1.1739480. [DOI] [PubMed] [Google Scholar]
- 28.Bercoff J, et al. Supersonic shear imaging: a new technique for soft tissue elasticity mapping. IEEE Transactions on Ultrasonics Ferroelectrics and Frequency Control. 2004;51:396–409. doi: 10.1109/tuffc.2004.1295425. [DOI] [PubMed] [Google Scholar]
- 29.Bercoff J, et al. Sonic boom in soft materials: The elastic Cerenkov effect. Applied Physics Letters. 2004 Mar;84:2202–2204. [Google Scholar]
- 30.Chen S, et al. Shearwave dispersion ultrasound vibrometry (SDUV) for measuring tissue elasticity and viscosity. IEEE Transactions on Ultrasonics Ferroelectrics and Frequency Control. 2009 Jan;56:55–62. doi: 10.1109/TUFFC.2009.1005. [DOI] [PMC free article] [PubMed] [Google Scholar]
- 31.Amador C, et al. Shear elastic modulus estimation from indentation and SDUV on gelatin phantoms. Biomedical Engineering, IEEE Transactions on. 2011;PP:1–1. doi: 10.1109/TBME.2011.2111419. [DOI] [PMC free article] [PubMed] [Google Scholar]
- 32.Snedeker JG, et al. Strain-rate dependent material properties of the porcine and human kidney capsule. Journal of Biomechanics. 2005 May;38:1011–1021. doi: 10.1016/j.jbiomech.2004.05.036. [DOI] [PubMed] [Google Scholar]
- 33.Nasseri S, et al. Viscoelastic properties of pig kidney in shear, experimental results and modelling. Rheologica Acta. 2002 Jan;41:180–192. [Google Scholar]
- 34.Hamhaber U, et al. Comparison of quantitative shear wave MR-elastography with mechanical compression tests. Magnetic Resonance in Medicine. 2003 Jan;49:71–77. doi: 10.1002/mrm.10343. [DOI] [PubMed] [Google Scholar]
- 35.Ringleb SI, et al. Quantitative shear wave magnetic resonance elastography: Comparison to a dynamic shear material test. Magnetic Resonance in Medicine. 2005 May;53:1197–1201. doi: 10.1002/mrm.20449. [DOI] [PubMed] [Google Scholar]
- 36.Zhai L, et al. An integrated indenter-ARFI imaging system for tissue stiffness quantification. Ultrasonic Imaging. 2008;30:95–111. doi: 10.1177/016173460803000203. [DOI] [PMC free article] [PubMed] [Google Scholar]
- 37.Fromageau J, et al. Estimation of polyvinyl alcohol cryogel mechanical properties with four ultrasound elastography methods and comparison with gold standard testings. IEEE Transactions on Ultrasonics Ferroelectrics and Frequency Control. 2007 Mar;54:498–509. doi: 10.1109/tuffc.2007.273. [DOI] [PubMed] [Google Scholar]
- 38.Oudry J, et al. Copolymer-in-oil phantom materials for elastography. Ultrasound in Medicine and Biology. 2009 Jul;35:1185–1197. doi: 10.1016/j.ultrasmedbio.2009.01.012. [DOI] [PubMed] [Google Scholar]
- 39.Chen S, et al. Quantifying elasticity and viscosity from measurement of shear wave speed dispersion. The Journal of the Acoustical Society of America. 2004;115:2781. doi: 10.1121/1.1739480. [DOI] [PubMed] [Google Scholar]
- 40.Chen S, et al. Shearwave dispersion ultrasound vibrometry (SDUV) for measuring tissue elasticity and viscosity. IEEE Transactions on Ultrasonics Ferroelectrics and Frequency Control. 2009;56:55–62. doi: 10.1109/TUFFC.2009.1005. [DOI] [PMC free article] [PubMed] [Google Scholar]
- 41.Urban MW, et al. Harmonic motion detection in a vibrating scattering medium. IEEE Transactions on Ultrasonics Ferroelectrics and Frequency Control. 2008;55:1956–1974. doi: 10.1109/TUFFC.887. [DOI] [PMC free article] [PubMed] [Google Scholar]
- 42.Zheng Y, et al. Detection of tissue harmonic motion induced by ultrasonic radiation force using pulse-echo ultrasound and Kalman filter. IEEE Transactions on Ultrasonics Ferroelectrics and Frequency Control. 2007;54:290–300. doi: 10.1109/tuffc.2007.243. [DOI] [PubMed] [Google Scholar]
- 43.Catheline S, et al. Measurement of viscoelastic properties of homogeneous soft solid using transient elastography: An inverse problem approach. The Journal of the Acoustical Society of America. 2004;116:3734. doi: 10.1121/1.1815075. [DOI] [PubMed] [Google Scholar]
- 44.Gennisson JL, et al. Viscoelastic and anisotropic mechanical properties of in vivo muscle tissue assessed by supersonic shear imaging. Ultrasound in Medicine and Biology. 2010 May;36:789–801. doi: 10.1016/j.ultrasmedbio.2010.02.013. [DOI] [PubMed] [Google Scholar]
- 45.Henni AH, et al. Shear wave induced resonance elastography of soft heterogeneous media. Journal of Biomechanics. 2010 May;43:1488–1493. doi: 10.1016/j.jbiomech.2010.01.045. [DOI] [PubMed] [Google Scholar]
- 46.Deffieux T, et al. Shear Wave Spectroscopy for In Vivo Quantification of Human Soft Tissues Visco-Elasticity. IEEE Transactions on Medical Imaging. 2009 Mar;28:313–322. doi: 10.1109/TMI.2008.925077. [DOI] [PubMed] [Google Scholar]
- 47.Montaldo G, et al. Coherent Plane-Wave Compounding for Very High Frame Rate Ultrasonography and Transient Elastography. Ieee Transactions on Ultrasonics Ferroelectrics and Frequency Control. 2009 Mar;56:489–506. doi: 10.1109/TUFFC.2009.1067. [DOI] [PubMed] [Google Scholar]
- 48.Kasai C, et al. Real-Time Two-Dimensional Blood Flow Imaging Using an Autocorrelation Technique. Sonics and Ultrasonics, IEEE Transactions on. 1985;32:458–464. [Google Scholar]
- 49.Torr GR. The acoustic radiation force. American Journal of Physics. 52:402–408. [Google Scholar]
- 50.Trump BF, Ericsson J. The Effect Of The Fixative Solution On The Ultrastructure Of Cells And Tissues. A Comparative Analysis With Particular Attention To The Proximal Convoluted Tubule Of The Rat Kidney. Laboratory Investigation. 1965;14:1245–323. [PubMed] [Google Scholar]
- 51.Romert P, Matthiessen ME. Fixation of foetal pig liver for electron microscopy. I. The effect of various aldehydrs and of delayed fixation. Anatomy and embryology. 1975;147:243–58. doi: 10.1007/BF00315074. [DOI] [PubMed] [Google Scholar]
- 52.van Noort R, et al. A study of the effects of glutaraldehyde and formaldehyde on the mechanical behaviour of bovine pericardium. Biomaterials. 1982;3:21–6. doi: 10.1016/0142-9612(82)90056-4. [DOI] [PubMed] [Google Scholar]
- 53.Currey JD, et al. Effect Of Formaldehyde Fixation On Some Mechanical-Properties Of Bovine Bone. Biomaterials. 1995 Nov;16:1267–1271. doi: 10.1016/0142-9612(95)98135-2. [DOI] [PubMed] [Google Scholar]
- 54.Sung HW, et al. Degradation potential of biological tissues fixed with various fixatives: An in vitro study. Journal of Biomedical Materials Research. 1997 May;35:147–155. doi: 10.1002/(sici)1097-4636(199705)35:2<147::aid-jbm2>3.0.co;2-n. [DOI] [PubMed] [Google Scholar]
- 55.Hasegawa H, Kanai H. Improving accuracy in estimation of artery-wall displacement by referring to center frequency of RF echo. IEEE Transactions on Ultrasonics Ferroelectrics and Frequency Control. 2006;53:52–63. doi: 10.1109/tuffc.2006.1588391. [DOI] [PubMed] [Google Scholar]
- 56.Urban MW, et al. Error in Estimates of Tissue Material Properties from Shear Wave Dispersion Ultrasound Vibrometry. IEEE Transactions on Ultrasonics Ferroelectrics and Frequency Control. 2009 Apr;56:748–758. doi: 10.1109/TUFFC.2009.1097. [DOI] [PMC free article] [PubMed] [Google Scholar]
- 57.Bentley MD, et al. Enhanced renal cortical vascularization in experimental hypercholesterolemia. Kidney International. 2002 Mar;61:1056–1063. doi: 10.1046/j.1523-1755.2002.00211.x. [DOI] [PubMed] [Google Scholar]
- 58.Ries M, et al. Diffusion tensor MRI of the human kidney. Journal of Magnetic Resonance Imaging. 2001 Jul;14:42–49. doi: 10.1002/jmri.1149. [DOI] [PubMed] [Google Scholar]
- 59.Couade M, et al. In Vivo Quantitative Mapping of Myocardial Stiffening and Transmural Anisotropy During the Cardiac Cycle. Ieee Transactions on Medical Imaging. 2011 Feb;30:295–305. doi: 10.1109/TMI.2010.2076829. [DOI] [PubMed] [Google Scholar]
- 60.Emelianov SY, et al. Reconstructive ultrasound elasticity imaging for renal transplant diagnosis: Kidney ex vivo results. Ultrasonic Imaging. 2000 Jul;22:178–194. doi: 10.1177/016173460002200303. [DOI] [PubMed] [Google Scholar]
- 61.Warner L, Yin M. Kidney stiffness measured in an animal model of unilateral renal arterial stenosis using 2D MR Elastography. ISMRM. 2009 [Google Scholar]
- 62.Amador C, et al. Viscoelastic measurements on perfused and non-perfused swine renal cortex in vivo. presented at the International Ultrasonics Symposium; San Diego, CA, USA. 2010. [Google Scholar]
- 63.Steinmetz AP, et al. Renal depth estimates to improve the accuracy of glomerular filtration rate. Journal of Nuclear Medicine. 1998 Oct;39:1822–1825. [PubMed] [Google Scholar]


