

Abstract
The serum free light chain (FLC) assay quantitates free immunoglobulin kappa and lambda light chains, which has prognostic value in plasma cell dyscrasias. However, there is limited data on serum FLC in lymphoid malignancies. We analyzed the association of pretreatment FLC with event-free survival (EFS) and overall survival (OS) in 100 patients with Hodgkin lymphoma (HL). Elevated polyclonal FLC were present in 30% of patients; these patients had an inferior EFS (HR = 4.84; 95% CI: 1.84–12.7) and OS (HR = 8.87; 95% CI: 2.35–33.52) compared to patients with normal FLC. Further studies of FLC in HL are warranted.
Introduction
The serum free light chain (FLC) assay measures the concentration of immunoglobulin (Ig) kappa (κ), and lambda (λ) light chains [1], which are produced by monoclonal and/ or polyclonal B-cell populations. The quantitation of serum FLC and the FLC κ/λ ratio has prognostic value in monoclonal gammopathy of undetermined significance, multiple myeloma, solitary plasmacytoma, and AL-amyloidosis [2–7].
Non-Hodgkin lymphoma (NHL) and Hodgkin Lymphoma (HL) are malignancies of B-cells that can be associated with a monoclonal serum Ig protein. In addition, these lymphoid malignancies often have a polyclonal B-cell infiltrate that can secrete Ig. To date, there have been limited studies that have examined the incidence and prognostic value of serum FLC in lymphoma. In 2005, in a study of 226 patients from our Lymphoma SPORE Serum Bank with NHL and chronic lymphocytic leukemia, we demonstrated that abnormal FLC ratios could be detected more frequently than immunofixation abnormalities; HL patients were not studied [8]. More recently, we showed that over 30% of diffuse large B-cell lymphoma (DLBCL) patients present with elevated FLC, and these patients are at increased risk of an event or death [9]. Others have reported that elevated FLC were associated with event free survival (EFS) in patients with early stage HL [10]. Here we report the association of elevated polyclonal FLC concentrations with EFS and overall survival (OS) in a prospectively enrolled cohort of patients with HL.
Methods
This study was reviewed and approved by the Human Subjects Institutional Review Board at the Mayo Clinic and University of Iowa, and written informed consent was obtained from all participants. Details on the patient cohort and FLC quantitation have been previously reported [9]. Briefly, lymphoma patients evaluated at the Mayo Clinic or University of Iowa within 9 months of diagnosis were prospectively enrolled in the University of Iowa/Mayo Clinic SPORE Molecular Epidemiology Resource from September 2002 to February 2008. Of the 219 HL patients enrolled, analyses were limited to the 100 patients with pretreatment research serum samples due to reduction in serum FLC observed in DLBCL patients during treatment [9]. Results for DLBCL are reported elsewhere [11]; here we report the results from HL.
The Freelite assay (The Binding Site, Birmingham, UK) was used to determine serum kappa and lambda FLC concentrations and the κ:λ FLC ratio from the onstudy research serum samples [1,12]. All assays were performed at the Mayo Clinic Clinical Immunology Lab using kits provided courtesy of The Binding Site. Mayo Clinic reference ranges were used to define the normal range for kappa, lambda, and FLC ratio (0.26–1.65) [12]. Elevated FLC was defined as a kappa or lambda above the published reference range (κ >1.94 mg/dL, λ >2.63 mg/dL).
EFS was defined as the time from diagnosis to the first disease progression, retreatment, or death due to any cause. OS was defined as the time from diagnosis to death due to any cause. Patients without an event or death were censored at time of last known follow-up. Chi-squared tests and Wilcoxon rank-sum tests were used to examine the association of FLC with clinical, prognostic, and demographic variables. Cox proportional hazards models and Kaplan-Meier curves were used to assess associations of FLC abnormalities with time-to-event outcomes. Cox models were performed unadjusted as well as adjusted for the International Prognostic Score (IPS) (Figure 1) [13].
Figure 1.
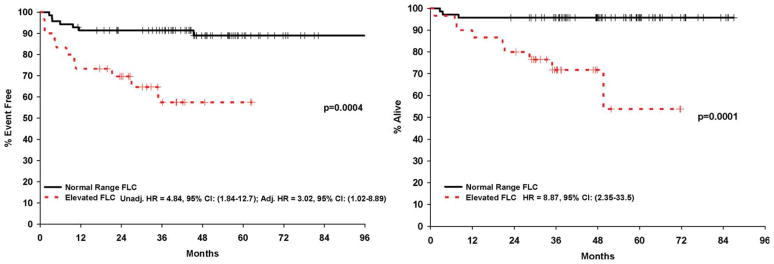
Kaplan Meier curves for event-free (A) and overall survival (B). Hazard ratios are unadjusted Cox models and Cox model adjusted for International Prognostic Score. [Color figure can be viewed in the online issue, which is available at wileyonlinelibrary.com.]
Results
100 HL cases with pretreatment research serum were analyzed. Patient characteristics are summarized in Table I. Thirty patients (30%) had an elevated serum FLC and in all 30 cases the elevation was polyclonal since the κ:λ FLC ratios were within normal limits. The percentage of patients with elevated FLC was lower in early stage disease compared to advanced stage disease (17 vs. 45%, respectively, P = 0.003). GFR was slightly lower in patients with elevated FLC (median 105, range 78–200) compared to patients with normal FLC (median 125, range 46–322), though not statistically (P = 0.08) or clinically significant. Five additional patients had an abnormal FLC ratio without elevation of kappa or lambda.
TABLE I.
Clinical Characteristics by FLC
| All Patients N = 100 |
Normal FLC N = 70 |
Elevated FLC N = 30 |
P-value | ||||
|---|---|---|---|---|---|---|---|
| N | % | N | % | N | % | ||
| Age, median (range) | 40 (18–81) | 36 (18–81) | 54 (24–80) | ||||
| Male | 54 | 54% | 37 | 53% | 17 | 57% | 0.73 |
| Age >45 | 39 | 39% | 21 | 30% | 18 | 60% | 0.005 |
| Stage | |||||||
| I | 10 | 10% | 9 | 13% | 1 | 3% | 0.007 |
| II | 43 | 43% | 35 | 50% | 8 | 27% | |
| III | 26 | 26% | 17 | 24% | 9 | 30% | |
| IV | 21 | 21% | 9 | 13% | 12 | 40% | |
| Albumin <4.0 g/dL | 44 | 46% | 22 | 33% | 22 | 76% | 0.001 |
| Hemoglobin <10.5 g/dL | 10 | 10% | 4 | 6% | 6 | 21% | 0.02 |
| ALC <600 | 52 | 53% | 37 | 53% | 15 | 54% | 0.95 |
| WBC >15,000 | 8 | 8% | 3 | 4% | 5 | 17% | 0.03 |
| B symptoms | 40 | 40% | 20 | 29% | 20 | 67% | 0.0004 |
| Bulky disease | 15 | 15% | 11 | 16% | 4 | 14% | 0.79 |
| ECOG PS >1 | 14 | 14% | 6 | 9% | 8 | 27% | 0.02 |
| ESR >ULN | 36 | 51% | 21 | 40% | 15 | 83% | 0.002 |
| Creatinine >ULN | 3 | 3% | 1 | 1% | 2 | 7% | 0.15 |
| IPS | |||||||
| 0–1 | 32 | 32% | 27 | 39% | 5 | 17% | 0.0001 |
| 2 | 30 | 30% | 27 | 39% | 3 | 10% | |
| 3 | 18 | 18% | 10 | 14% | 8 | 27% | |
| 4–7 | 20 | 20% | 6 | 8% | 14 | 47% | |
| Subtype | |||||||
| Classical | 93 | 93% | 63 | 90% | 30 | 100% | 0.07 |
| Lymphocyte predominant | 7 | 7% | 7 | 10% | 0 | 0% | |
| Initial treatment | |||||||
| ABVD | 85 | 85% | 63 | 85% | 22 | 85% | 0.10 |
| MOPP | 2 | 2% | 1 | 2% | 1 | 2% | |
| Stanford V | 5 | 5% | 3 | 5% | 2 | 5% | |
| Other/missing | 8 | 8% | 3 | 8% | 5 | 8% | |
| GHSG | |||||||
| Advanced | 52 | 52% | 28 | 54% | 24 | 46% | 0.007 |
| Early favorable | 30 | 30% | 26 | 87% | 4 | 11% | |
| Early unfavorable | 18 | 18% | 16 | 89% | 2 | 13% | |
| FLC mg/dL, median (range) | |||||||
| Kappa | 1.44 (0.06– 9.0) | 1.14 (0.06– 1.94) | 2.55 (1.50– 9.0) | ||||
| Lambda | 1.50 (0.20– 9.1) | 1.26 (0.20– 2.62) | 2.58 (1.63– 9.1) | ||||
| Total FLC | 2.90 (0.42– 15.8) | 2.56 (0.42– 4.56) | 5.29 (3.74– 15.8) | ||||
Abbreviations: ABVD, adriamycin, bleomycin, vinblastine, doxorubicin; ALC, absolute lymphocyte count; ECOG, Eastern Cooperative Oncology Group; ESR, erythrocyte sedimentation rate; FLC, free light chain; GHGC, German Hodgkin group classification; IPS, International prognostic stage; MOPP, nitrogen mustard, vincristine, procarbazine, prednisone; PS, performance status; WBC, white blood cell count.
At a median follow-up of 48 months (range, 27–87), 18 patients (18%) had an event and 12 patients (12%) had died. The cause of death was due to HL in 9 patients; pulmonary embolism, pneumonia, and aortic stenosis accounted for the other deaths. FLC elevation was significantly associated with age >45, advanced stage, poor ECOG PS, albumin <4.0 g/dl, hemoglobin <10.5 g/dl, leukocytosis (WBC > 15,000), B symptoms, elevated sedimentation rate, and unfavorable IPS. There was no association of FLC elevation with lymphopenia (WBC <600 g/dl), bulky disease, elevated creatinine, or histological subtype (lymphocyte-predominant HL (LPHL) vs. classical HL). Elevated FLCs were associated with poor EFS (HR = 4.58, 95% CI (1.80–11.69, P = 0.001) and OS (HR = 8.99, 95% CI (2.38–33.94, P = 0.001). The association remained significant for EFS after adjusting for the IPS (HR = 3.02, 1.02–8.89, P = 0.05); there were insufficient deaths to build a multivariable model for OS. After adjusting for GFR, elevated FLC remained associated with EFS: HR = 4.20, (95% CI: 1.57–11.23), P = 0.004. Elevated FLC were associated with poor EFS in both early (HR = 6.94, 1.32–36.4, P = 0.02) and advanced stage patients (HR = 3.07, 0.92–10.27, P = 0.07); FLC hazard ratio estimates were also similar across GHSG categories (data not shown). An abnormal FLC ratio without elevated FLC was not associated with outcome (data not shown).
Discussion
Classical HL is a unique tumor in that the majority of cells in the microenvironment are nonmalignant, consisting of reactive T- and B-cells, eosinophils, neutrophils, macrophages, and plasma cells [14]. The malignant cells—the Reed-Sternberg cells—have been demonstrated to be incapable of secreting functional Ig molecules and therefore would not be expected to produce FLC [15,16]. In our study, the FLC elevation is polyclonal in nature (elevated kappa and lambda light chains with a normal ratio) which supports the hypothesis that the FLC is being secreted by polyclonal B-cells, presumably in the HL microenvironment, although this needs to be established. It is known that polyclonal increase in FLC can be due to a number of host factors, such as increased age, impaired renal function, and general inflammation or immune stimulation [17]. In our study, we observed an association of polyclonal elevated FLC with more general host attributes (older age, B symptoms, and poor PS) and with sedimentation rate, an inflammatory marker. It is hypothesized that patients with elevated FLC will have elevations in inflammatory cytokines and chemokines. This should be evaluated in future studies to better understand the pathogenesis.
Serum FLC has the potential to be a useful clinical tool in the care of patients with HL. FLC quantitative analysis could be incorporated into a prognostic index used at diagnosis, which may be useful in predicting those patients who would benefit from a more aggressive first line of treatment. Future studies in HL should evaluate FLC at diagnosis and at response assessment time points to determine the impact on treatment on FLC values and if FLC correlates with clinical response. In summary, serum FLC is an intriguing biomarker in HL, and longitudinal studies are needed to describe the impact of treatment on FLC value, to understand the mechanisms of elevated FLC in HL, and validate these findings.
Acknowledgments
Contract grant sponsor: University of Iowa/Mayo Clinic Lymphoma SPORE; Contract grant number: CA97274; Contract grant sponsor: Paul Calabresi Award for Clinical Oncology; Contract grant number: K12 CA90628; Contract grant sponsor: Henry J. Predolin Foundation.
Footnotes
Conflict of interest: Nothing to report
References
- 1.Bradwell AR, Carr-Smith HD, Mead GP, et al. Highly sensitive, automated immunoassay for immunoglobulin free light chains in serum and urine. Clin Chem. 2001;47:673–680. [PubMed] [Google Scholar]
- 2.Katzmann JA, Abraham RS, Dispenzieri A, et al. Diagnostic performance of quantitative kappa and lambda free light chain assays in clinical practice. Clin Chem. 2005;51:878–881. doi: 10.1373/clinchem.2004.046870. [DOI] [PubMed] [Google Scholar]
- 3.Rajkumar SV, Kyle RA, Therneau TM, et al. Serum free light chain ratio is an independent risk factor for progression in monoclonal gammopathy of undetermined significance. Blood. 2005;106:812–817. doi: 10.1182/blood-2005-03-1038. [DOI] [PMC free article] [PubMed] [Google Scholar]
- 4.Dingli D, Kyle RA, Rajkumar SV, et al. Immunoglobulin free light chains and solitary plasmacytoma of bone. Blood. 2006;108:1979–1983. doi: 10.1182/blood-2006-04-015784. [DOI] [PMC free article] [PubMed] [Google Scholar]
- 5.Abraham RS, Katzmann JA, Clark RJ, et al. Quantitative analysis of serum free light chains. A new marker for the diagnostic evaluation of primary systemic amyloidosis. Am J Clin Pathol. 2003;119:274–278. doi: 10.1309/LYWM-47K2-L8XY-FFB3. [DOI] [PubMed] [Google Scholar]
- 6.Dispenzieri A, Kyle R, Merlini G, et al. International Myeloma Working Group guidelines for serum-free light chain analysis in multiple myeloma and related disorders. Leukemia. 2009;23:215–224. doi: 10.1038/leu.2008.307. [DOI] [PubMed] [Google Scholar]
- 7.Dispenzieri A, Lacy MQ, Katzmann JA, et al. Absolute values of immunoglobulin free light chains are prognostic in patients with primary systemic amyloidosis undergoing peripheral blood stem cell transplantation. Blood. 2006;107:3378–3383. doi: 10.1182/blood-2005-07-2922. [DOI] [PMC free article] [PubMed] [Google Scholar]
- 8.Martin W, Abraham R, Shanafelt T, et al. Serum-free light chain—A new biomarker for patients with B-cell non-Hodgkin lymphoma and chronic lymphocytic leukemia. Translat Res. 2007;149:231–235. doi: 10.1016/j.trsl.2006.11.001. [DOI] [PubMed] [Google Scholar]
- 9.Maurer M, Micallef I, Cerhan J, et al. Elevated serum free light chains are associated with event free and overall survival in two independent cohorts of patients with diffuse large B-cell lymphoma. J Clin Oncol. 2011;29:1620–1626. doi: 10.1200/JCO.2010.29.4413. [DOI] [PMC free article] [PubMed] [Google Scholar]
- 10.Pinto A, Iaccarino G, Russo F, et al. Clinical and biological relevance of serum free light chains (sFLC) assessment in patients with Hodgkin lymphoma. Hematol Rep. 2010;2:15–16. [Google Scholar]
- 11.Maurer MJ, Micallef IN, Cerhan JR, et al. Elevated serum free light chains are associated with event-free and overall survival in two independent cohorts of patients with diffuse large B-cell lymphoma. J Clin Oncol Official J Am Soc Clin Oncol. 2011;29:1620–1626. doi: 10.1200/JCO.2010.29.4413. [DOI] [PMC free article] [PubMed] [Google Scholar]
- 12.Katzmann JA, Clark RJ, Abraham RS, et al. Serum reference intervals and diagnostic ranges for free kappa and free lambda immunoglobulin light chains: Relative sensitivity for detection of monoclonal light chains. Clin Chem. 2002;48:1437–1444. [PubMed] [Google Scholar]
- 13.Hasenclever D, Diehl V. A prognostic score for advanced Hodgkin’s disease. International prognostic factors project on advanced Hodgkin’s disease. N Engl J Med. 1998;339:1506–1514. doi: 10.1056/NEJM199811193392104. [DOI] [PubMed] [Google Scholar]
- 14.Jaffe E, Harris N, Stein N, et al. Pathology and Genetics of Tumors of Hematopoietic and Lymphoid Tissues. Lyon: IARC Press; 2001. Hodgkin Lymphoma; pp. 237–254. [Google Scholar]
- 15.Gladkowska-Dura MJ, Dura WT, Johnson WW. Light and immunoelectronmicroscopic study of Hodgkin’s disease: Evidence of immunoglobulin synthesis by tumor cells. Virchows Arch B Cell Pathol Incl Mol Pathol. 1981;37:109–124. doi: 10.1007/BF02892561. [DOI] [PubMed] [Google Scholar]
- 16.Marafioti T, Hummel M, Foss HD, et al. Hodgkin and reed-sternberg cells represent an expansion of a single clone originating from a germinal center B-cell with functional immunoglobulin gene rearrangements but defective immunoglobulin transcription. Blood. 2000;95:1443–1450. [PubMed] [Google Scholar]
- 17.Dispenzieri A, Katzmann J, Kyle R, et al. Non-clonal serum immunoglobulin free light chains (FLC) as markers of overall survival. Hematol Rep. 2010;2:12. [Google Scholar]