Abstract
Reduced activity of two genes in combination often has a more detrimental effect than expected. Such epistatic interactions not only occur when genes are mutated but also due to variation in gene expression, including among isogenic individuals in a controlled environment. We hypothesized that these ‘epigenetic’ epistatic interactions could place important constraints on the evolution of gene expression. Consistent with this, we show here that yeast genes with many epistatic interaction partners typically show low expression variation among isogenic individuals and low variation across different conditions. In addition, their expression tends to remain stable in response to the accumulation of mutations and only diverges slowly between strains and species. Yeast promoter architectures, the retention of gene duplicates, and the divergence of expression between humans and chimps are also consistent with selective pressure to reduce the likelihood of harmful epigenetic epistatic interactions. Based on these and previous analyses, we propose that the tight regulation of epistatic interaction network hubs makes an important contribution to the maintenance of a robust, ‘canalized’ phenotype. Moreover, that epigenetic epistatic interactions may contribute substantially to fitness defects when single genes are deleted.
Keywords: epigenetics, epistasis, evolution, gene expression, genetic interaction
Introduction
Mutations do not have the same effects in all individuals. One reason for this is that the outcome of a mutation can depend on other genetic variation in a genome. Such genetic—or epistatic—interactions between mutations have been extensively mapped in model organisms, and contribute to disease phenotypes in humans (Lehner, 2007, 2011; Costanzo et al, 2011). Indeed in model organisms the effects of loss-of-function mutations in most genes can be enhanced by deletions in other loci (Costanzo et al, 2010). However, systematic genetic interaction mapping projects have also revealed that genes differ widely in the number of genetic interaction partners that they have (Pan et al, 2004; Tong et al, 2004; Schuldiner et al, 2005; Lehner et al, 2006; Costanzo et al, 2010). Although the inactivation of a typical gene only enhances the effects of mutations in a relatively small number of other loci, reduced activity of genes referred to as genetic interaction hubs (or buffers or capacitors) can enhance the phenotypic consequences of mutations in many different loci encoding genes with diverse functions (Costanzo et al, 2010, 2011).
Mutations are, however, just one cause of variation in gene activity. Two individuals may also differ in the activity of a particular gene simply because of differences in gene expression. For example, genes change in expression in response to the environment and during development. Moreover, gene expression also varies—often substantially—among isogenic individuals or cells in a common environment (Newman et al, 2006; Lopez-Maury et al, 2008). Both these environmentally triggered (Casanueva et al, 2012) and stochastic (Burga et al, 2011) changes in gene expression can also cause epistatic interactions with mutations: one protein’s activity is reduced because of mutation and the other because of insufficient gene expression, so triggering an epistatic interaction. We refer to these interactions as ‘epigenetic interactions’ or ‘epigenetic epistasis’ (Figure 1A).
Figure 1.
Epistatic interactions and gene expression variation. (A) Schematic representation of three classes of epistatic interactions. Epistatic interactions can occur when two genes are mutated (genetic–genetic interaction), when one gene is mutated and the other gene varies in expression (genetic–epigenetic interaction), or when two genes simultaneously vary in expression (epigenetic–epigenetic interaction). (B) The more potential epistatic interaction partners a gene has, the more its expression variation should be constrained during evolution.
We hypothesized that epigenetic epistasis could place an important constraint on gene expression and evolution. In particular, we hypothesized that the more genetic interaction partners a gene has, the stronger the selective constraint will be to maintain stable expression of that gene (Figure 1B). This is because, as a first approximation, the more genetic interaction partners a gene has, the higher the likelihood that at least one of them carries a detrimental mutation. Moreover, with more interaction partners there is also an increased likelihood that at least one interaction partner will have low expression in a particular individual. In short, the more genetic interaction partners a gene has, the greater the chance of an epigenetic interaction when the expression of that gene varies (Figure 1B).
In budding yeast, genome-wide measurements of gene expression can be used to quantify expression variation at many different scales, ranging from variation in expression levels among isogenic individuals in a common environment (‘noise’), through the responsiveness of expression to changes in conditions (‘plasticity’), to the divergence in expression between species (‘evolution’). This large resource of expression measurements allows us to test whether genes with more genetic interaction partners do indeed have less variable gene expression. We show here that at each of these scales this is the case and that genetic interaction network hubs have particularly tightly controlled and slowly evolving expression. We discuss the implications of this for the evolution of robust (or ‘canalized’ (Waddington, 1942)) phenotypes, and how the tight regulation of genetic network interaction hubs may both constrain short-term phenotypic evolution and facilitate it over a longer timescale.
Results
Epistatic interaction network hubs have low expression noise and stable expression across environmental conditions
We hypothesized that, in order to maintain phenotypic stability, the expression of genes with many potential epistatic interaction—hub genes in genetic interaction networks—should be tightly regulated. If a gene has many genetic interaction partners, then variation in the expression of that gene is more likely to cause an ‘epigenetic’ epistatic interaction (Figure 1). During evolution, therefore, the selective pressure to reduce gene expression variation may be stronger for genes with more genetic interaction partners.
Genetic interactions have been systematically mapped in budding yeast, identifying over 100 000 high-confidence negative genetic interactions between more than 4000 genes (Costanzo et al, 2010). In this data set, the number of genetic interactions for each gene ranges between 1 and 511, with a median of 22 interactions per gene (Costanzo et al, 2010). To relate the number of genetic interaction partners per gene to the variability of gene expression, we compiled data from multiple studies that analyzed genome-wide variation in gene expression at different scales (Figure 1B and Supplementary File 1).
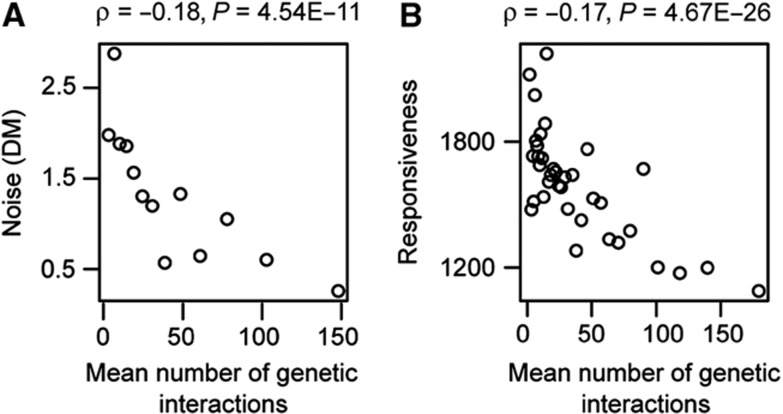
We first considered how genes with different number of genetic interactions vary in expression among isogenic cells in a common environment—that is, their expression ‘noise’, as quantified using a library of GFP-tagged fusion proteins (Newman et al, 2006). As shown in Figure 2A, considering measurements across more than 1300 genes, expression noise is anticorrelated with genetic interaction degree (ρ=−0.18, P=4.54E−11). Thus, genes with many potential genetic interaction partners have expression that is generally less variable from cell to cell in a single environment.
Figure 2.
Genetic interaction hubs have low gene expression variation across individuals (‘noise’, A) and reduced expression variation across different environmental conditions (‘responsiveness’, B). All plots for quantitative variables are shown for equally sized group of genes (n=100), ranked according to the variable under consideration. Spearman’s rank correlation coefficients and P-values are shown inset. As for the other measures of expression variation considered here, there is no significant relationship between positive genetic interaction degree and expression variation (Supplementary Figure 2).
Next, we considered how genes vary in expression in response to changes in conditions. Ihmels et al (2002) quantified how much each gene’s expression changes in a curated data set consisting over 1500 expression profiles across different experimental conditions, that is, the expression ‘responsiveness’ or ‘plasticity’ following external perturbations (Tirosh et al, 2006). As for expression noise, when considering more than 3600 yeast genes, the responsiveness of a gene’s expression is inversely related to the number of genetic interaction partners (ρ=−0.17, P=4.67E−26; Figure 2B). That is, genes with many genetic interaction partners typically have expression that changes very little across different environmental conditions. This result is also upheld when using alternative measures of expression plasticity (Supplementary Figure 1). Thus, the more genetic interactions a gene has, the more tightly controlled its expression is both within a condition and across different conditions. As for all of the other expression properties considered below, these relationships remain significant when controlling for the individual fitness effects of each gene deletion, gene expression levels, phenotypic capacity or multifunctionality (Supplementary Figures 3 and 6).
Genes with many genetic interactions have expression that is less responsive to genetic change
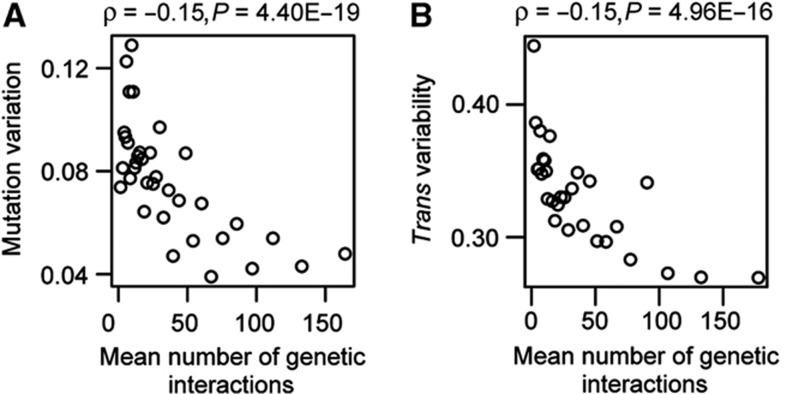
The above results imply that the expression of genetic interaction hubs responds less to stochastic and environmental stimuli. We next asked whether they also respond less to genetic perturbations, that is, whether their expression is less sensitive to mutation. We used two data sets: first, the variance of expression across yeast cell lines that had been allowed to accumulate random mutations during 4000 generations of growth under conditions of minimal selection due to population bottlenecks (mutational variance, Vm; Landry et al, 2007), and second, a measure of the variance of each gene’s expression caused by different trans-acting genetic loci in recombinant inbred lines generated in a cross between two strains (trans variability; Brem et al, 2002; Choi and Kim, 2008). In both cases we observe that genes with more genetic interactions have expression that varies less across genotypes (ρ=−0.15, P=4.40E−19 for mutation variation, ρ=−0.15, P=4.96E−16 for trans variability; Figure 3A and B). Thus, genetic interaction hubs also have expression that is intrinsically less ‘evolvable’ when either random mutations accumulate in a genome or in response to combinations of natural variants.
Figure 3.
Genetic interaction hubs have expression with low sensitivity to genetic change (‘evolvability’), as quantified in mutation accumulation lines (‘mutation variation’, A) and across yeast strains in which single genes have been deleted (‘trans variability’, B). All plots for quantitative variables are shown for equally sized group of genes (n=100), ranked according to the variable under consideration. Spearman’s rank correlation coefficients and P-values are shown inset.
The expression of genetic interaction hubs diverges slowly within and between species
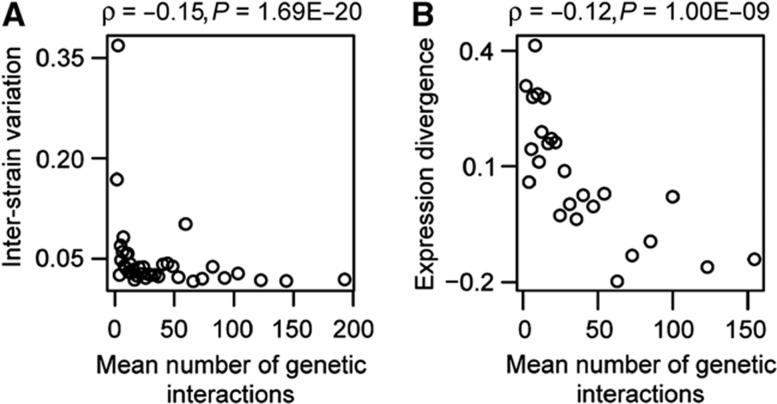
The reduced evolvability of the expression of genetic interaction hubs predicts that their expression might also diverge more slowly during evolution. We tested this in two ways—by considering expression divergence (ED) among strains of one species, and by considering ED among different yeast species. In both cases, the levels of divergence inversely correlate with the number of genetic interactions (ρ=−0.15, P=1.69E−20 for inter-strain variation, ρ=−0.12, P=1.00E−09 for ED between species; Figure 4A and B). Genes with many genetic interaction partners, therefore, tend to have expression that evolves slower than other genes.
Figure 4.
The gene expression of genetic hubs diverges slowly during evolution, as measured across yeast strains (‘inter-strain variation’, A) and between different yeast species (‘expression divergence’, B). All plots for quantitative variables are shown for equally sized group of genes (n=100), ranked according to the variable under consideration. Spearman’s rank correlation coefficients and P-values are shown inset.
Genetic interaction hubs have biased promoter architectures
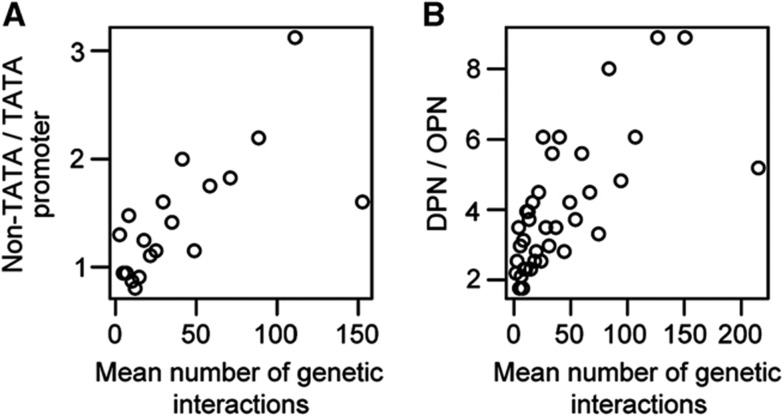
Taken together, these analyses show that genetic hubs have more stable expression levels at many different scales: among individuals, in response to environmental change, in response to mutations and during evolution. These different timescales of expression variability are correlated across genes (Supplementary Figure 9; Tirosh et al, 2006; Landry et al, 2007; Choi and Kim, 2009; Lehner, 2010a). What are the molecular mechanisms that underlie this constrained gene expression? Previous studies have linked the presence of a TATA box and high promoter nucleosome occupancy to increased variability of expression (Tirosh et al, 2006; Landry et al, 2007; Choi and Kim, 2009; Lehner, 2010a). Consistent with this, we find that the more genetic interaction partners a gene has, the less likely it is to have a TATA box element in its promoter (Kolomogorov–Smirnov (KS) statistic, P=2.52E−09; Figure 5A). Similarly, genes with many genetic interaction partners are more likely to have nucleosome-free upstream regions, whereas genes with few genetic interaction partners tend to have high nucleosome occupancy upstream of the transcription start site (KS statistic, P=1.53E−09; Figure 5B). Consistent with previous work (Tirosh et al, 2006; Landry et al, 2007; Choi and Kim, 2009; Lehner, 2010a), this suggests that promoter architecture is an important cause of the reduced expression variability of genetic interaction network hubs.
Figure 5.
Tight regulation of gene expression variation is coupled to promoter architecture. Genetic interaction hubs in yeast tend not to have TATA box (A) and nucleosome-occupied (B) promoters. All plots for quantitative variables are shown for equally sized group of genes (n=100), ranked according to the variable under consideration. OPN, occupied proximal nucleosome, DPN, depleted proximal nucleosome.
Highly connected genes with variable expression are enriched for gene duplicates
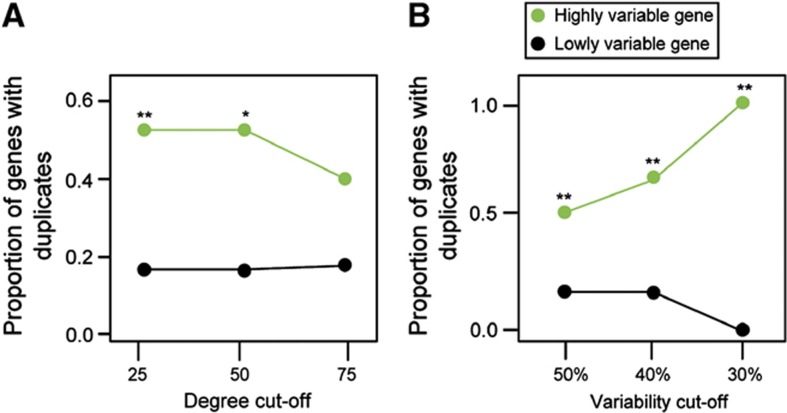
Despite the overall anticorrelation between genetic interaction degree and variation in gene expression, some more highly connected genes still show substantial variation in gene expression. We were interested in whether these genes have an alternative mechanism to reduce the detrimental effects of variation in expression. One general mechanism to escape from adaptive conflict is gene duplication (Hughes, 1994; Des Marais and Rausher, 2008). Based on previous work (Lehner, 2010a), we hypothesized that the variable gene expression of some highly connected genes might be compensated for by the expression of partially redundant gene duplicates. Indeed we find that highly connected genes with variable expression are likely to have more gene duplicates than highly connected genes with less variable expression (Figure 6). This suggests that the highly variable expression of a subset of genetic hubs may be tolerated because of the presence of duplicates.
Figure 6.
Highly connected genes with high expression variation are more likely to have gene duplicates than highly connected genes with low expression variation. Ratios are shown for different genetic interaction degree cut-offs, at which a gene is considered as a highly connected genes (A) and for different expression variability cut-offs (B). P-values are calculated using the Mann–Whitney U-test (**P<5.0E−3, *P<5.0E−2), see also Supplementary Figure 4.
Epistatic interactions may constrain gene expression in other species
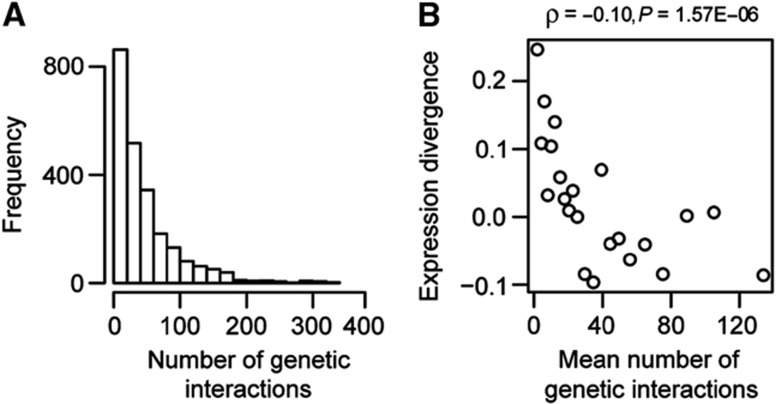
In yeast we observed that genes with more genetic interaction partners have more constrained expression than other genes. We were interested in whether this result also applies to other species. Genetic interaction hubs appear to be well conserved across species, as does the genetic interaction degree of individual genes (Roguev et al, 2007; Dixon et al, 2008; Frost et al, 2012; Koch et al, 2012; Ryan et al, 2012). Therefore, we assigned the interaction degree of more than 2500 yeast genes to their human orthologs (Figure 7A). This revealed that, just as in yeast, these predicted genetic hubs in human also have expression that is constrained during evolution, showing reduced ED between human and chimpanzee (ρ=−0.10, P=1.57E−06; Figure 7B). This relationship remains significant when controlling for the individual fitness effects of each gene deletion (ρ=−0.05, P=1.47E−02) or gene expression levels (ρ=−0.09, P=2.17E−05) (Supplementary Figure 5). We concluded that the principle that epistatic interactions constrain expression variation is likely to be conserved across species.
Figure 7.
Low expression divergence between human and chimpanzee of the orthologs of yeast genetic hubs. (A) Distribution of human genes with respect to the predicted number of genetic interactions. Human genes were assigned the number of yeast genetic interactions by ortholog mapping. (B) Correlation between the number of genetic interactions and the expression divergence of human genes. Expression divergence is calculated between human and chimpanzee. All plots for quantitative variables are shown for equally sized group of genes (n=100), ranked according to the variable under consideration. Spearman’s rank correlation coefficients and P-values are shown inset.
Discussion
Evidence that epigenetic epistatic interactions constrain the evolution of gene expression
We have shown here that genes with many genetic interaction partners have less variable gene expression across multiple different timescales. Genetic interaction hubs have expression that is less noisy, less responsive to changes in conditions, less evolvable, and diverging more slowly during evolution. This reduced expression variation is linked to differences in promoter architecture, with interaction hubs having transcription that is most likely intrinsically less ‘bursty’ (Hornung et al, 2012) and so less sensitive to perturbations.
The tight regulation of genetic hubs may contribute to phenotypic robustness
An important concept in biology is phenotypic robustness or canalization (Waddington, 1942; Wagner, 2000; Stelling et al, 2004). Based on our results, we propose that the stable expression of genetic interaction hubs makes an important contribution to this robustness. Of course, the relationship between genetic interaction degree and expression variation may also be indirect. However, other observations are also consistent with our hypothesis, such as the tendency for two genetic partners not to simultaneously have low expression (Supplementary Figure 8). In addition, yeast strains in which genetic interaction hubs have been deleted have highly variable morphological phenotypes (Ohya et al, 2005; Levy and Siegal, 2008; Lehner, 2010b), and strains in which genetic hubs have been deleted are also more sensitive to environmental perturbations (Lehner, 2010b). Both results are consistent with a loss of robustness or a ‘de-canalization’—in the absence of a hub, otherwise harmless fluctuations in gene expression start to have phenotypic effects (Burga et al, 2011; Casanueva et al, 2012). Thus, the stable expression of genetic interaction hubs may serve to buffer genetic, environmental, and stochastic perturbations.
Epigenetic epistatic interactions may contribute to single gene deletion phenotypes
It has been previously noted that there is a strong correlation between the magnitude of the growth defect when a gene is deleted and the number of genetic interaction partners that gene has (Baryshnikova et al, 2010; Costanzo et al, 2010). Based on this relationship and the arguments presented above, we suggest that one important contribution to single gene deletion phenotypes is likely to be epigenetic epistatic interactions. If a gene with many genetic interaction partners is deleted, then variation in the activity of many genes will now have more severe effects on fitness. Consistent with this, genes with more genetic interaction partners are more likely to be haploinsufficient, i.e., to cause a growth defect when their dose is reduced by 50% (Supplementary Figure 7). Thus, although many cells in a population carrying a particular gene deletion may show a growth defect, the actual causes of these defects may vary among cells due to variation in gene expression. In yeast, growth phenotypes are typically quantified at the population level, but such a model for the causes of fitness defects in yeast is supported by experiments in C. elegans, demonstrating that part of the individual-to-individual variability in the outcome of mutations depends on variation in the expression of genetic interaction partners (Burga et al, 2011; Casanueva et al, 2012).
Epigenetic epistasis and evolvability
In summary, the analyses presented here support a model in which there has been a selective pressure to reduce the variability of expression of genes with many genetic interaction partners. Together with previous work showing that expression variation can cause harmful epigenetic epistatic interactions (Burga et al, 2011; Casanueva et al, 2012), and that genetic hubs promote phenotypic stability (Levy and Siegal, 2008; Lehner, 2010b), this suggests that the tight regulation of genetic interaction hubs is an important aspect of phenotypic robustness or canalization. Thus, in the short term the tight regulation of genetic hubs may therefore constrain evolution by reducing phenotypic variation. However, it has also been proposed that over long evolutionary periods increased phenotypic robustness promotes evolution by facilitating a wider exploration of viable genotypes (Wagner, 2005), and so the tight regulation of epistatic interaction hub may facilitate the evolution of complexity. Using laboratory evolution experiments it might be possible to directly test some of these ideas.
Materials and methods
Genetic interactions
Genetic interactions were systematically identified by (Costanzo et al (2010) for 3458 array genes. Only high-confidence negative interactions with |ε|<0.08 and P-value <0.05 were considered, as suggested by the authors (Costanzo et al, 2010). The fitness defects of the same strains were determined by the same authors (Baryshnikova et al, 2010; Costanzo et al, 2010). For an independent test (Supplementary Figure 10), all genetic interaction data sets, except Costanzo et al (2010) and Tong et al (2004) were downloaded from the BioGRID ( www.thebiogrid.org, version 3.1) (Stark et al, 2011).
Gene expression data sets
Stochastic noise in protein expression was measured from single-cell profiling of fluorescently tagged proteins by Newman et al (2006). To exclude the influence of protein abundance, the coefficient of variation was converted to the distance-to-median metric (DM) for each gene (Newman et al, 2006). Responsiveness of mRNA expression to environmental perturbations was derived from more than 1500 gene expression profiles (Ihmels et al, 2002), and calculated as the sum of squares of the log2-ratios over the conditions (Tirosh et al, 2006). A second measure of expression variation across environmental conditions was obtained from Edgar et al (2002) and Koch et al (2012). Each gene’s percentile of variation was calculated and then assigned to the average percentile across all microarray data sets. Responsiveness across stress conditions was calculated as the variance in gene expression (Gasch et al, 2000; Choi and Kim, 2009). Trans viability was defined as the responsiveness to trans-acting genetic loci in recombinant inbred lines (Brem et al, 2002) and was obtained from Brem et al (2002) and Choi and Kim (2008). Mutational variance (Vm) is a measure of expression variance among four mutation accumulation lines by Landry et al (2007). Inter-strain variation was measured across four natural isolates of S. cerevisiae (Townsend et al, 2003). ED between closely related yeast species under controlled environmental conditions was taken from Tirosh et al (2006). Gene expression levels of yeast genes were obtained from Holstege et al (1998).
Promoter features
The presence and absence of TATA boxes was obtained from Basehoar et al (2004), with TATA boxes identified in promoter regions by scanning each gene’s promoter region (−70 to −310) for the commonly found site TATA(A/T)A(A/T)(A/G). A total of 1090 genes initiating from TATA-box promoters and 4581 genes from non-TATA box promoters are considered. Nucleosome occupancy in promoter regions was taken from in vivo nucleosome occupancy data (Lee et al, 2007) in the 100 base pairs upstream of each gene, as defined in Tirosh and Barkai (2008). According to this criterion, a total of 1082 ‘occupied proximal nucleosome’ (OPN) promoters and 1940 ‘depleted proximal nucleosome’ (DPN) proximal promoters are analyzed.
Yeast gene duplicates
Gene duplicates were defined using the SYNERGY algorithm (Wapinski et al, 2007), which uses gene trees based on sequence similarity.
Expression divergence of human genes
Human orthologs of yeast genes were obtained from Ensembl Compara through BioMart (Haider et al, 2009; Vilella et al, 2009). ED of human genes was calculated as expression variation between human and chimpanzee across five tissues, as reported in Tirosh et al (2006) using gene expression from Khaitovich et al (2005).
Multifunctionality
Multifunctionality was defined as the number of ‘biological process’ terms of Gene Ontology (GO) as reported in Costanzo et al (2010), which uses a multifunctionality index (Myers et al, 2006).
Phenotypic capacitance
The phenotypic capacitance was quantified morphological variability (Ohya et al, 2005) upon deletion of nonessential genes and was used directly from Levy and Siegal (2008).
Haploinsufficient genes
Overall, 184 haploinsufficient genes were identified by a heterozygous deletion screen (Deutschbauer et al, 2005).
Supplementary Material
Supplementary Figures S1–10
Acknowledgments
We thank JS Yang, J Semple and A Burga for helpful discussions, Itay Tirosh for sharing ED data of human genes. This work was funded by the European Research Council (ERC), MINECO Plan Nacional grants BFU2008-00365 and BFU2011-26206, ERASysBio+ ERANET project EUI2009-04059 GRAPPLE, the European Molecular Biology Organization (EMBO) Young Investigator Program, EU Framework 7 project 277899 4DCellFate, and the EMBL/CRG Systems Biology Program.
Author contributions: SP performed all analyses. BL conceived the project. SP and BL designed experiments and wrote the paper.
Footnotes
The authors declare that they have no conflict of interest.
References
- Baryshnikova A, Costanzo M, Kim Y, Ding H, Koh J, Toufighi K, Youn JY, Ou J, San Luis BJ, Bandyopadhyay S, Hibbs M, Hess D, Gingras AC, Bader GD, Troyanskaya OG, Brown GW, Andrews B, Boone C, Myers CL (2010) Quantitative analysis of fitness and genetic interactions in yeast on a genome scale. Nat Methods 7: 1017–1024 [DOI] [PMC free article] [PubMed] [Google Scholar]
- Basehoar AD, Zanton SJ, Pugh BF (2004) Identification and distinct regulation of yeast TATA box-containing genes. Cell 116: 699–709 [DOI] [PubMed] [Google Scholar]
- Brem RB, Yvert G, Clinton R, Kruglyak L (2002) Genetic dissection of transcriptional regulation in budding yeast. Science 296: 752–755 [DOI] [PubMed] [Google Scholar]
- Burga A, Casanueva MO, Lehner B (2011) Predicting mutation outcome from early stochastic variation in genetic interaction partners. Nature 480: 250–253 [DOI] [PubMed] [Google Scholar]
- Casanueva MO, Burga A, Lehner B (2012) Fitness trade-offs and environmentally induced mutation buffering in isogenic C. elegans. Science 335: 82–85 [DOI] [PubMed] [Google Scholar]
- Choi JK, Kim YJ (2008) Epigenetic regulation and the variability of gene expression. Nat Genetics 40: 141–147 [DOI] [PubMed] [Google Scholar]
- Choi JK, Kim YJ (2009) Intrinsic variability of gene expression encoded in nucleosome positioning sequences. Nat Genetics 41: 498–503 [DOI] [PubMed] [Google Scholar]
- Costanzo M, Baryshnikova A, Bellay J, Kim Y, Spear ED, Sevier CS, Ding H, Koh JL, Toufighi K, Mostafavi S, Prinz J, St Onge RP, VanderSluis B, Makhnevych T, Vizeacoumar FJ, Alizadeh S, Bahr S, Brost RL, Chen Y, Cokol M et al. (2010) The genetic landscape of a cell. Science 327: 425–431 [DOI] [PMC free article] [PubMed] [Google Scholar]
- Costanzo M, Baryshnikova A, Myers CL, Andrews B, Boone C (2011) Charting the genetic interaction map of a cell. Curr Opin Biotechnol 22: 66–74 [DOI] [PubMed] [Google Scholar]
- Des Marais DL, Rausher MD (2008) Escape from adaptive conflict after duplication in an anthocyanin pathway gene. Nature 454: 762–765 [DOI] [PubMed] [Google Scholar]
- Deutschbauer AM, Jaramillo DF, Proctor M, Kumm J, Hillenmeyer ME, Davis RW, Nislow C, Giaever G (2005) Mechanisms of haploinsufficiency revealed by genome-wide profiling in yeast. Genetics 169: 1915–1925 [DOI] [PMC free article] [PubMed] [Google Scholar]
- Dixon SJ, Fedyshyn Y, Koh JL, Prasad TS, Chahwan C, Chua G, Toufighi K, Baryshnikova A, Hayles J, Hoe KL, Kim DU, Park HO, Myers CL, Pandey A, Durocher D, Andrews BJ, Boone C (2008) Significant conservation of synthetic lethal genetic interaction networks between distantly related eukaryotes. Proc Natl Acad Sci USA 105: 16653–16658 [DOI] [PMC free article] [PubMed] [Google Scholar]
- Edgar R, Domrachev M, Lash AE (2002) Gene Expression Omnibus: NCBI gene expression and hybridization array data repository. Nucleic Acids Res 30: 207–210 [DOI] [PMC free article] [PubMed] [Google Scholar]
- Frost A, Elgort MG, Brandman O, Ives C, Collins SR, Miller-Vedam L, Weibezahn J, Hein MY, Poser I, Mann M, Hyman AA, Weissman JS (2012) Functional repurposing revealed by comparing S. pombe and S. cerevisiae genetic interactions. Cell 149: 1339–1352 [DOI] [PMC free article] [PubMed] [Google Scholar]
- Gasch AP, Spellman PT, Kao CM, Carmel-Harel O, Eisen MB, Storz G, Botstein D, Brown PO (2000) Genomic expression programs in the response of yeast cells to environmental changes. Mol Biol Cell 11: 4241–4257 [DOI] [PMC free article] [PubMed] [Google Scholar]
- Haider S, Ballester B, Smedley D, Zhang J, Rice P, Kasprzyk A (2009) BioMart Central Portal—unified access to biological data. Nucleic Acids Res 37: W23–W27 [DOI] [PMC free article] [PubMed] [Google Scholar]
- Holstege FC, Jennings EG, Wyrick JJ, Lee TI, Hengartner CJ, Green MR, Golub TR, Lander ES, Young RA (1998) Dissecting the regulatory circuitry of a eukaryotic genome. Cell 95: 717–728 [DOI] [PubMed] [Google Scholar]
- Hornung G, Bar-Ziv R, Rosin D, Tokuriki N, Tawfik DS, Oren M, Barkai N (2012) Noise-mean relationship in mutated promoters. Genome Res 22: 2409–2417 [DOI] [PMC free article] [PubMed] [Google Scholar]
- Hughes AL (1994) The evolution of functionally novel proteins after gene duplication. Proc Biol Sci 256: 119–124 [DOI] [PubMed] [Google Scholar]
- Ihmels J, Friedlander G, Bergmann S, Sarig O, Ziv Y, Barkai N (2002) Revealing modular organization in the yeast transcriptional network. Nat Genet 31: 370–377 [DOI] [PubMed] [Google Scholar]
- Khaitovich P, Hellmann I, Enard W, Nowick K, Leinweber M, Franz H, Weiss G, Lachmann M, Paabo S (2005) Parallel patterns of evolution in the genomes and transcriptomes of humans and chimpanzees. Science 309: 1850–1854 [DOI] [PubMed] [Google Scholar]
- Koch EN, Costanzo M, Bellay J, Deshpande R, Chatfield-Reed K, Chua G, D’Urso G, Andrews B, Boone C, Myers CL (2012) Conserved rules govern genetic interaction degree across species. Genome Biol 13: R57. [DOI] [PMC free article] [PubMed] [Google Scholar]
- Landry CR, Lemos B, Rifkin SA, Dickinson WJ, Hartl DL (2007) Genetic properties influencing the evolvability of gene expression. Science 317: 118–121 [DOI] [PubMed] [Google Scholar]
- Lee W, Tillo D, Bray N, Morse RH, Davis RW, Hughes TR, Nislow C (2007) A high-resolution atlas of nucleosome occupancy in yeast. Nat Genet 39: 1235–1244 [DOI] [PubMed] [Google Scholar]
- Lehner B (2007) Modelling genotype-phenotype relationships and human disease with genetic interaction networks. J Exp Biol 210: 1559–1566 [DOI] [PubMed] [Google Scholar]
- Lehner B (2010a) Conflict between noise and plasticity in yeast. PLoS Genet 6: e1001185. [DOI] [PMC free article] [PubMed] [Google Scholar]
- Lehner B (2010b) Genes confer similar robustness to environmental, stochastic, and genetic perturbations in yeast. PloS ONE 5: e9035. [DOI] [PMC free article] [PubMed] [Google Scholar]
- Lehner B (2011) Molecular mechanisms of epistasis within and between genes. Trends Genet 27: 323–331 [DOI] [PubMed] [Google Scholar]
- Lehner B, Crombie C, Tischler J, Fortunato A, Fraser AG (2006) Systematic mapping of genetic interactions in Caenorhabditis elegans identifies common modifiers of diverse signaling pathways. Nat Genet 38: 896–903 [DOI] [PubMed] [Google Scholar]
- Levy SF, Siegal ML (2008) Network hubs buffer environmental variation in Saccharomyces cerevisiae. PLoS Biol 6: e264. [DOI] [PMC free article] [PubMed] [Google Scholar]
- Lopez-Maury L, Marguerat S, Bahler J (2008) Tuning gene expression to changing environments: from rapid responses to evolutionary adaptation. Nat Rev Genet 9: 583–593 [DOI] [PubMed] [Google Scholar]
- Myers CL, Barrett DR, Hibbs MA, Huttenhower C, Troyanskaya OG (2006) Finding function: evaluation methods for functional genomic data. BMC Genomics 7: 187. [DOI] [PMC free article] [PubMed] [Google Scholar]
- Newman JR, Ghaemmaghami S, Ihmels J, Breslow DK, Noble M, DeRisi JL, Weissman JS (2006) Single-cell proteomic analysis of S. cerevisiae reveals the architecture of biological noise. Nature 441: 840–846 [DOI] [PubMed] [Google Scholar]
- Ohya Y, Sese J, Yukawa M, Sano F, Nakatani Y, Saito TL, Saka A, Fukuda T, Ishihara S, Oka S, Suzuki G, Watanabe M, Hirata A, Ohtani M, Sawai H, Fraysse N, Latge JP, Francois JM, Aebi M, Tanaka S et al. (2005) High-dimensional and large-scale phenotyping of yeast mutants. Proc Natl Acad Sci USA 102: 19015–19020 [DOI] [PMC free article] [PubMed] [Google Scholar]
- Pan X, Yuan DS, Xiang D, Wang X, Sookhai-Mahadeo S, Bader JS, Hieter P, Spencer F, Boeke JD (2004) A robust toolkit for functional profiling of the yeast genome. Mol Cell 16: 487–496 [DOI] [PubMed] [Google Scholar]
- Roguev A, Wiren M, Weissman JS, Krogan NJ (2007) High-throughput genetic interaction mapping in the fission yeast Schizosaccharomyces pombe. Nat Methods 4: 861–866 [DOI] [PubMed] [Google Scholar]
- Ryan CJ, Roguev A, Patrick K, Xu J, Jahari H, Tong Z, Beltrao P, Shales M, Qu H, Collins SR, Kliegman JI, Jiang L, Kuo D, Tosti E, Kim HS, Edelmann W, Keogh MC, Greene D, Tang C, Cunningham P et al. (2012) Hierarchical modularity and the evolution of genetic interactomes across species. Mol Cell 46: 691–704 [DOI] [PMC free article] [PubMed] [Google Scholar]
- Schuldiner M, Collins SR, Thompson NJ, Denic V, Bhamidipati A, Punna T, Ihmels J, Andrews B, Boone C, Greenblatt JF, Weissman JS, Krogan NJ (2005) Exploration of the function and organization of the yeast early secretory pathway through an epistatic miniarray profile. Cell 123: 507–519 [DOI] [PubMed] [Google Scholar]
- Stark C, Breitkreutz BJ, Chatr-Aryamontri A, Boucher L, Oughtred R, Livstone MS, Nixon J, Van Auken K, Wang X, Shi X, Reguly T, Rust JM, Winter A, Dolinski K, Tyers M (2011) The BioGRID Interaction Database: 2011 update. Nucleic Acids Res 39: D698–D704 [DOI] [PMC free article] [PubMed] [Google Scholar]
- Stelling J, Sauer U, Szallasi Z, Doyle FJ 3rd, Doyle J (2004) Robustness of cellular functions. Cell 118: 675–685 [DOI] [PubMed] [Google Scholar]
- Tirosh I, Barkai N (2008) Two strategies for gene regulation by promoter nucleosomes. Genome Res 18: 1084–1091 [DOI] [PMC free article] [PubMed] [Google Scholar]
- Tirosh I, Weinberger A, Carmi M, Barkai N (2006) A genetic signature of interspecies variations in gene expression. Nat Genet 38: 830–834 [DOI] [PubMed] [Google Scholar]
- Tong AH, Lesage G, Bader GD, Ding H, Xu H, Xin X, Young J, Berriz GF, Brost RL, Chang M, Chen Y, Cheng X, Chua G, Friesen H, Goldberg DS, Haynes J, Humphries C, He G, Hussein S, Ke L et al. (2004) Global mapping of the yeast genetic interaction network. Science 303: 808–813 [DOI] [PubMed] [Google Scholar]
- Townsend JP, Cavalieri D, Hartl DL (2003) Population genetic variation in genome-wide gene expression. Mol Biol Evol 20: 955–963 [DOI] [PubMed] [Google Scholar]
- Vilella AJ, Severin J, Ureta-Vidal A, Heng L, Durbin R, Birney E (2009) EnsemblCompara GeneTrees: complete, duplication-aware phylogenetic trees in vertebrates. Genome Res 19: 327–335 [DOI] [PMC free article] [PubMed] [Google Scholar]
- Waddington CH (1942) Canalization of development and the inheritance of acquired characters. Nature 150: 563–565 [DOI] [PubMed] [Google Scholar]
- Wagner A (2000) Robustness against mutations in genetic networks of yeast. Nat Genet 24: 355–361 [DOI] [PubMed] [Google Scholar]
- Wagner A (2005) Robustness, evolvability, and neutrality. FEBS Letts 579: 1772–1778 [DOI] [PubMed] [Google Scholar]
- Wapinski I, Pfeffer A, Friedman N, Regev A (2007) Automatic genome-wide reconstruction of phylogenetic gene trees. Bioinformatics 23: i549–i558 [DOI] [PubMed] [Google Scholar]
Associated Data
This section collects any data citations, data availability statements, or supplementary materials included in this article.
Supplementary Materials
Supplementary Figures S1–10


