Abstract
Objectives:
The aims of this study were to develop a new method for analysis and presentation of esophageal distensibility data using high-resolution impedance planimetry recordings during a volume-controlled distention.
Methods:
Two control subjects and six patients with eosinophilic esophagitis (EoE) with stricture, narrow caliber or normal endoscopy according to EndoFLIP studies were included for analysis. Median filtering and pulse detection techniques were applied to the pressure signal and a wavelet decomposition technique was applied to the 16 channels of raw esophageal diameter data to reduce vascular artifact, respiratory effect and remove esophageal contraction interference. These data were used to generate a functional luminal imaging probe (FLIP) topography plot that describes regional variation of cross-sectional area (CSA). A previously developed computer program was used to calculate and model the CSA-pressure data to derive the slope of line fitting and distension plateau for each individual subject. The results were compared among the four endoscopic phenotypes.
Results:
Patients with EoE and normal endoscopy had similar esophageal distensibility parameters to those of normal controls whereas patients with EoE and stricture or narrow caliber had much lower distensibility than patients with EoE and normal endoscopy. The FLIP topography plots provided a global assessment of the esophageal distensibility along the axial plane of measurement that differentiated patients with varying degrees of endoscopic abnormality.
Conclusions:
New techniques can be leveraged to improve data analysis and presentation using EndoFLIP assessment of the esophageal body in EoE. These techniques may be helpful in defining clinically relevant phenotypes and guiding treatment strategies and should be helpful in structuring future outcome trials.
Keywords: cross-sectional area, esophageal distensibility index, eosinophilic esophagitis, functional imaging, wavelet transform
Introduction
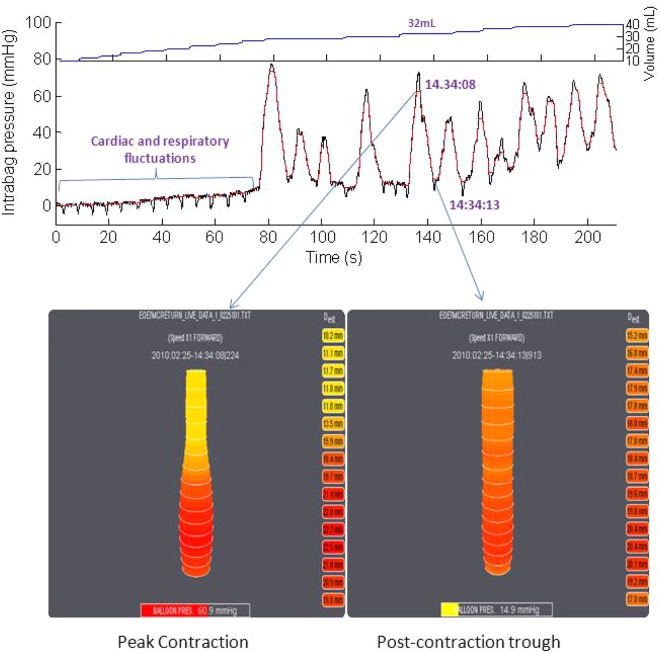
The EndoFLIP system (Crospon Medical Devices, Galway, Ireland) uses impedance planimetry to calculate multiple adjacent cross-sectional areas (CSAs) within a cylindrical bag while simultaneously measuring intraluminal pressure during controlled volumetric distension [McMahon et al. 2007; Kwiatek et al. 2011] (Figure 1). Recent analyses of esophageal EndoFLIP data have mainly focused on the calculation of esophageal distensibility. This metric was defined from data obtained at the narrowest CSA within the distal esophagus, designed to be sensitive to both the slope of the CSA versus pressure relationship during the initial phase of distension as well as to the CSA at the distension plateau beyond which pressure increases no longer increased the CSA [Kwiatek et al. 2011]. However, by definition, this approach characterizes only the least distensible locus in the segment under study and ignores regional variation along the esophagus that can be an important disease manifestation.
Figure 1.
Examples of an EndoFLIP study in real time during volumetric distension. The top volume shows the volumetric distension increments, the middle panel the corresponding raw data signal of intrabag pressure and the lower panel representative esophageal diameter data at the peak of an esophageal contraction (left) and between contractions (right). Note the superimposed effects of vascular pulsations, respiration and especially esophageal contractions on the pressure signal. These extraneous signals affect the esophageal diameter data, evident by the fact that functional luminal imaging probe display images were both taken during the 32 ml distension. Esophageal contractions have an even more profound effect on calculations of distensibility, as the measurement units are mm2/mmHg and the intrabag pressure on the left panel is 60.9 mmHg while that on the right panel is 14.9 mmHg.
Alterations of the biomechanical properties of the esophageal wall (e.g. stricture, narrow caliber or dilatation) are common features of esophageal diseases [Vinter-Jensen et al. 1994; Khan et al. 2003]. Previous studies on esophageal body distensibility in patients with eosinophilic esophagitis (EoE) using the EndoFLIP system have shown that esophageal distensibility was significantly reduced in patients with EoE compared with controls [Kwiatek et al. 2011]. Both focal esophageal strictures and a narrow caliber esophagus are common features in patients with EoE and the distensibility measurements currently used would not distinguish these entities because of the focus on the single narrow- est CSA [Vinter-Jensen et al. 1994; Kwiatek et al. 2011]. We hypothesized that esophageal biomechanical properties in patients with EoE with stricture, narrow caliber esophagus and a normal appearing esophagus may be quite different and a more detailed analytic approach may be required to tease out these nuances.
Given these issues, we conceptualized an improved methodology for analyzing esophageal functional luminal imaging probe (FLIP) data that could preserve region-specific variation along the luminal axis among 16 (or more) measurement sites and simultaneously filter the pressure and the impedance planimetry data to eliminate components of the signal attributable to vascular pulsations, respiration, and most importantly, esophageal contractions that are induced by esophageal distension. This methodology leverages digital filtering techniques recently applied to manometric data and, in general, borrows heavily from techniques developed for the analysis of high-resolution manometry pressure as esophageal topography plots [Clouse and Staiano, 1991; Ghosh et al. 2006]. Hence, we have termed this approach FLIP topography. Thus, the aims of this study were to refine the methodology for analyzing FLIP data evaluating esophageal distensibility in patients with EoE.
Methods
Subjects
Two control subjects and six patients with EoE (three men, age range 35–44 years) were used in this analysis. The control subjects were asymptomatic volunteers with no gastrointestinal (GI) symptoms, previous GI surgery or current use of medications known to affect GI function. The patients with EoE were recruited from the Gastroenterology Clinic at Northwestern Medical Faculty Foundation based on clinical documentation of diagnostic criteria for EoE: dysphagia with a history of food impaction and esophageal mucosal biopsies with a minimum of 15 eosinophils per high-powered field. Patients were further subgrouped by endoscopic findings: normal appearing esophagus; focal stricture (area of narrowing less than 6 cm in length); and narrow caliber esophagus (area of narrowing longer than 6 cm). None of the subjects had a history of GI surgery. The study protocol was approved by the Northwestern University Institutional Review Board and informed consent was obtained from each subject.
EndoFLIP system and study protocol
The EndoFLIP assembly used in this study was 240 cm long with a 3 mm outer diameter. An infinitely compliant bag (up to a volume limit of 50 ml) mounted on the distal 14 cm of the probe was fabricated to assume a 10 cm long cylindrical shape between tapering ends sealed to the assembly. The minimal to maximal range of CSA measurable by the device was 10–491 mm2. The 8 cm segment within the bag designed for impedance planimetry measurement was composed of 17 ring electrodes spaced 5 mm apart. The assembly also contained a solid-state pressure transducer for determining intrabag pressure. Measurements from the 16 impedance planimetry electrode pairs and the pressure transducer were sampled at 10 Hz with the data acquisition system and transmitted to the recording unit. A detailed description of the concepts and components of the EndoFLIP system has been previously published [McMahon et al. 2007; Kwiatek et al. 2011].
The EndoFLIP probe was placed transorally during endoscopy and positioned with the most distal recording site 3 cm above the esophagogastric junction [Kwiatek et al. 2011]. CSAs within the esophagus were measured during 2 ml stepwise distensions beginning with 2 ml and increasing to a maximum of 40 ml (each step lasted for 5–20 s). When measurements were interrupted by peristalsis, they were prolonged or repeated. To prevent unintended dilation of a stiff or poorly compliant esophagus, the recording unit was set to stop infusing and display an alarm message if the intrabag pressure exceeded 60 mmHg.
Data analysis
Distension volume, intrabag pressure and 16 channels of impedance planimetry data from each subject were exported to MATLAB (The Math Works, Natick, MA, USA) for further analysis using a customized MATLAB program. This program processed the data in four ways: intrabag pressure was processed with a median filter to minimize vascular and respiratory artifacts; a nonlinear pulse detection technique was applied to the pressure signal to identify esophageal contractions, isolate the minimal pressure segment between contractions, and derive the median values for the corresponding intrabag pressure and CSAs during each distension; the distensibility of esophagus was modeled from the pressure–CSA relationship with a polynomial regression method to extract the slope of the best-fit line for the initial phase of distention and curve fitting to identify the plateau phase (maximal distensibility index) for each subject [Stanley, 2005]; and a novel paradigm of wavelet decomposition was applied to impedance planimetry data to first filter out signals related to respiration, vascular pulsation and esophageal contractions, and then to generate FLIP topography plots of location-specific esophageal diameter.
Wavelet decomposition of esophageal diameter data
Exemplified in Figure 1, esophageal pressure and diameter data are composite signals with respiratory fluctuations, vascular pulsations, and most significantly, esophageal contractions, superimposed on the passive component of distensibility, defined by the wall properties of the esophagus itself. Ideally, one wants to extract data pertinent to the wall properties of the esophagus from this composite signal to define its distensibility. This was attempted with a wavelet transform filtering technique. Wavelet transform filtering has recently been applied to esophageal manometric data to eliminate vascular pulsation artifacts [Najmabadi et al. 2009]. In this study, we applied a wavelet transform filtering technique to esophageal diameter data to eliminate components of the composite signal related to respiration, heartbeat and esophageal contraction.
Wavelet transform filtering is analogous to Fourier analysis. The key distinctions are that, first, whereas Fourier analysis decomposes composite signals into sine waves of varied frequency and strength, wavelet transformation uses a user-defined ‘mother wavelet’ as the waveform upon which signal decomposition is based. Second, whereas Fourier analysis is applied uniformly to the entire signal from start to finish, wavelet decomposition allows for ‘compact support’ to isolate the analysis to specified segments of the signal. Thus, the wavelet decomposition can accommodate local changes to the signal as might be anticipated in a protocol such as ours using stepwise volumetric distensions [Daubechies, 1988]. The ‘mother wavelet’ applied is user defined and its selection depends on the waveform of the signal to be filtered. Several examples of mother wavelets available in MATLAB are illustrated in Figure 2 [Daubechies, 1988]. Note how each is characterized by a distinct waveform.
Figure 2.

Five examples of ‘mother wavelets’ available in MATLAB for wavelet decomposition analysis. The ‘sym3’ wavelet in the first panel was used in this analysis because it best emulated the waveform of the phasic esophageal contractions that we needed to extract from the esophageal diameter and pressure raw data signals.
The filtering process using wavelet decomposition is to first fit the mother wavelet to the signal to be filtered at the highest possible frequency and derive an approximation representing the original signal minus the detail coefficient representative of the portion of the original signal filtered out. In our case, the highest possible frequency was 5 Hz, a half of the data-sampling rate of the EndoFLIP system. This process is then iteratively repeated, progressively halving the frequency of the mother wavelet (a process called dilation) until the mother wavelet has been dilated to such an extent that it covers the entire range of the signal. The final result is an approximation and a set of details, corresponding to the portions of the signal filtered out at each iteration [Mallat, 1989]. In practice, the number of iterations required is determined by the frequency content of the original signal.
Results
Construction of functional luminal imaging probe topography plots
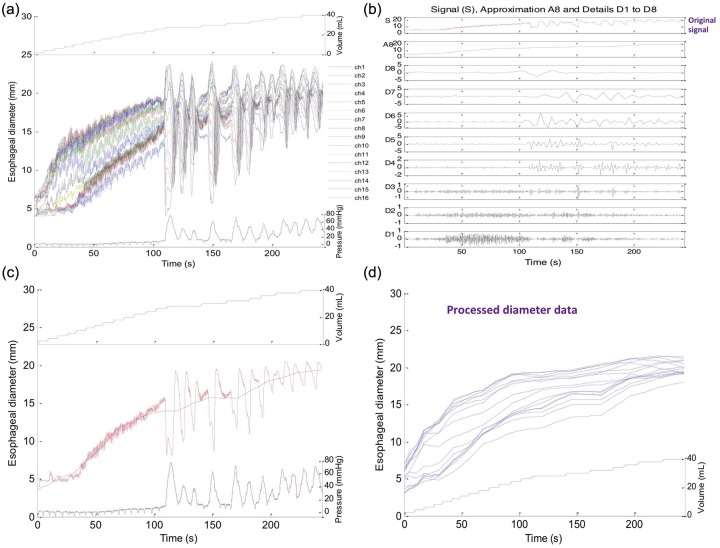
After some experimenting with the parameters of wavelet decomposition, we selected the mother wavelet ‘sym3’ (Figure 2) as best approximating the morphology of the signals to be filtered and used eight wavelet decompositions because further iterations beyond that provided no further information. Since the data sampling frequency was 10 Hz in our study, eight wavelet decompositions corresponded to a minimum filtering frequency of less than 0.0195 Hz. Figure 3 illustrates an example of a progressively denoised esophageal diameter data tracing resultant from this process, with the final approximation depicted by the blue line superimposed on the original signal in Figure 3(c).
Figure 3.
Progressive iterations of ‘denoising’ a single esophageal diameter tracing. Panel (a) shows the unprocessed tracing while panel (b) illustrates the signal approximations and details during iterations of wavelet decomposition. In panel (c), the final approximation (blue line) is superimposed on the unfiltered signal (red line) to facilitate comparison in a single recording site. Each iteration halved the frequency of the mother wavelet such that in iteration 1 it was 5 Hz and in iteration 8 it was 0.0195 Hz. Note that with the final approximation the superimposed esophageal contraction has been essentially eliminated from the signal, as have been the fluctuations associated with vascular pulsations and respiration. Panel (d) represents the final approximation for all 16 channel measurements of diameter after processing.
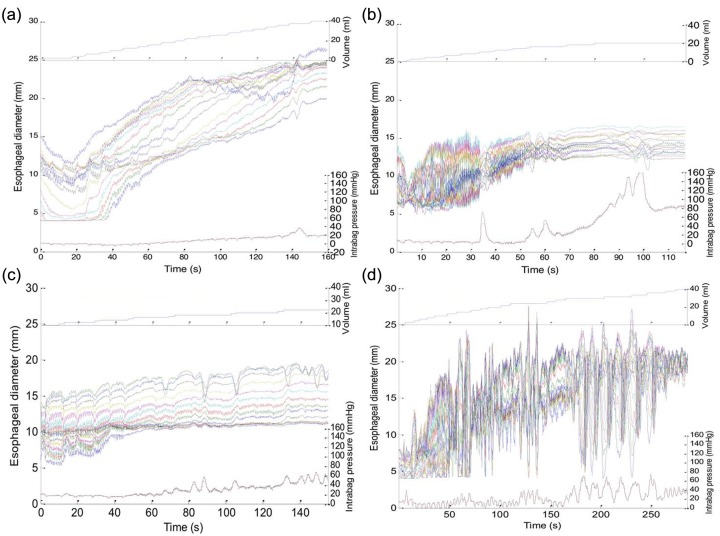
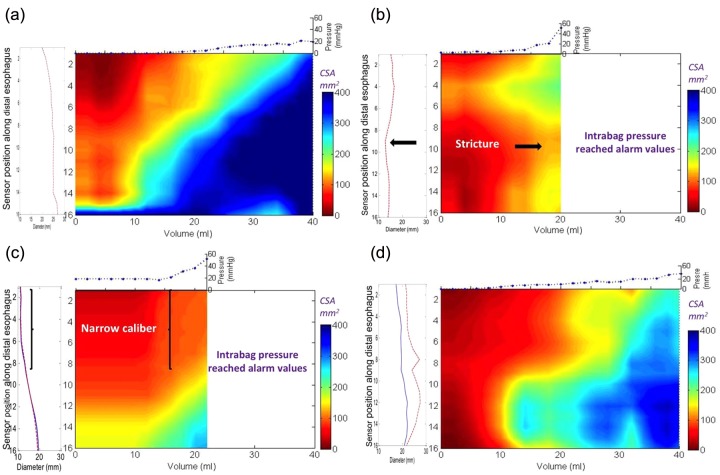
Figure 3(c) represents filtered data on 2–40 ml distensions from 1 of 16 impedance planimetry channels. Although the x axis in Figure 3 is time, the variable of interest is actually distension volume. Hence, to improve the graphical representation, median esophageal diameters were derived for each distension volume and these were plotted using distension volume as the x axis. Then, to seamlessly display the entire 16-channel dataset, esophageal diameter versus distention volume was plotted in topographic format, interpolating values between esophageal loci and between distension volumes, much the same as has been done with high-resolution manometry and impedance data. Figure 4 exemplifies this process with panel (a) showing the 16 channels of raw unfiltered esophageal diameter data along with corresponding intrabag pressure data using topography to plot the diameter change over the space–time domain. Figure 4(b) shows the alternative presentation after filtering and wavelet decomposition as a FLIP topography plot with color now indicative of esophageal CSA at each coordinate of esophageal location and distension volume. Projected to the left is a plot of the maximal diameter achieved at each axial location and projected above are the filtered pressure values associated with each step of volumetric distension. Examples of each subject type are illustrated in Figures 5 and 6. Figure 5 shows the raw data acquired for each specific patient while Figure 6 represents the processed FLIP topography description corresponding to the same patients in Figure 5.
Figure 4.
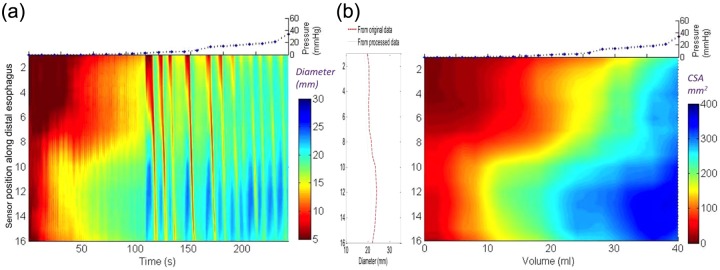
The development of functional luminal imaging probe (FLIP) topography plots from distension data of a patient with eosinophilic esophagitis and a normal endoscopy. Panel (a) shows the raw unprocessed data converted to a color diameter topography plot with time on the x axis and diameter displayed using a color scale and interpolation for the 16 channels. Note that the contractions can be visualized in the diameter topography plot before processing. Panel (b) illustrates the final transformation of the raw data from (a) into a FLIP topography plot of esophageal cross-sectional area (CSA) as a function of intrabag volume. Median CSA at each volume are plotted and interpolated between, similar to the way that values between adjacent esophageal locations are approximated by interpolation. The maximal diameters at each location are projected to the left as a spatial diameter variation plot and the median intrabag pressure at each distensile volume are projected above.
Figure 5.
Raw unprocessed data collected during the volumetric controlled distention protocol for four subjects: (a) a control subject, (b) a patient with eosinophilic esophagitis (EoE) and a focal stricture, (c) a patient with EoE and a narrow caliber esophagus, and (d) a patient with EoE and a normal endoscopy. Volume is noted on the top panel, diameters for the 16 recording channels are displayed in the middle panel along the time domain and intrabag pressure is displayed on the bottom panel.
Figure 6.
Functional luminal imaging probe (FLIP) topography plots of the same three patients with eosinophilic esophagitis (EoE) and control as illustrated in Figure 5. Note that the detail of the regional changes can distinguish between the patients with EoE. The bag distends first in the distal esophagus due to dependent filling and increased distensibility in the distal esophagus in both the control (a) and the patients with EoE and a normal endoscopy (d). However, the intrabag pressures are higher in the patient with EoE at maximal volumetric distention. The regional changes in the patient with EoE and a narrow caliber (c) are illustrated by the long segment in the proximal measurement area where the cross-sectional area (CSA) does not rise above 150 mm2 despite much higher pressure values compared with the control subject. Similarly, the patient with a focal stricture (b) also maintains a persistent zone of reduced CSA in the middle measurement area despite the higher pressure values recorded in the bag. Both patients with EoE and a focal stricture and a narrow caliber reached intrabag pressures greater than 40 mmHg with smaller distention volumes compared with the control subject and the patient with EoE and normal endoscopy.
Assessing esophageal distensibility among patients
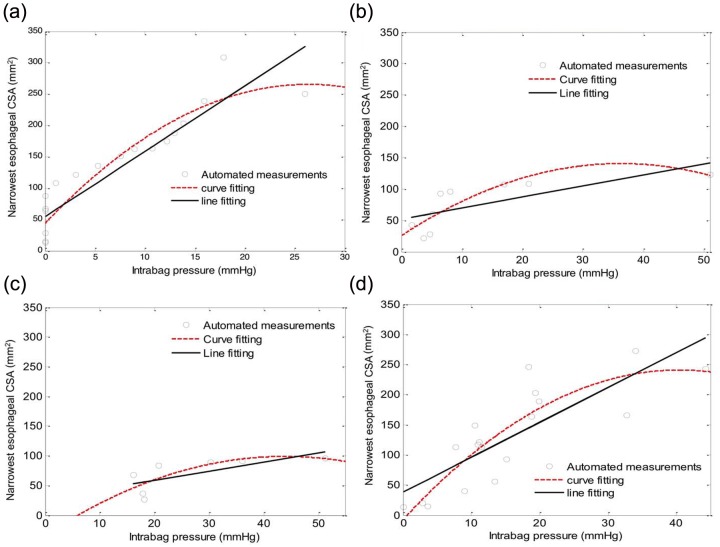
Esophageal distensibility was first analyzed among patients with EoE using the paradigm previously described that focused on the minimal CSA [Kwiatek et al. 2011], albeit now using the digitally filtered esophageal diameter and pressure data. Examples of the line fitting and curve fitting plots for each subtype are illustrated in Figure 7. Note that, as in our previous analysis, patients with EoE and a focal stricture and with diffuse narrowing exhibited substantially reduced distensibility both in terms of the slope of the best-fit line and the distention plateau evident by the best-fit curve. Table 1 shows these data for all eight subjects analyzed. One of the control subjects had no discernible distensibility plateau as there was a linear relationship between the CSA and pressure change during volume distension over the range 0–40 ml. Note that one of the patients with EoE (patient 2) with a normal endoscopy had distensibility characteristics comparable to the control subjects, whereas the other (illustrated in Figure 5) had characteristics intermediate between the controls and the patients with EoE and a narrow caliber.
Figure 7.
Cross-sectional area (CSA) versus distention pressure graphs of the smallest CSA for the four subjects displayed in Figures 5 and 6: (a) a control subject; (b) a patient with EoE and a focal stricture; (c) a patient with EoE and a narrow caliber esophagus; and (d) a patient with EoE and a normal endoscopy. Values were calculated using the same automated methods as described in Figure 3. Note that all three patients with EoE have a reduced slope and a lower distensibility plateau compared with the control subject.
Table 1.
Distensibility data at the minimal CSA for all eight subjects.
| Patient | Slope of line (mm2/mmHg) | Distension plateau (mm2) | Maximal DI (mm2/mmHg) |
|---|---|---|---|
| Control 1 | 10.42 | 286 | 10.06 |
| Control 2 | 10.45 | No plateau | 11.81 |
| Focal stricture 1 | 1.52 | 129 | 2.99 |
| Focal stricture 2 | 0.77 | 103 | 1.65 |
| Narrow caliber 1 | 1.51 | 99 | 2.26 |
| Narrow caliber 2 | 4.15 | 164 | 5.11 |
| EoE normal EGD 1 | 4.19 | 193 | 6.73 |
| EoE normal EGD 2 | 5.79 | 240 | 5.96 |
CSA, cross-sectional area; EoE, eosinophilic esophagitis; DI, distensibility index; EGD, esophagogastroduodenoscopy.
Discussion
The aim of this study was to improve the analysis paradigm of distensibility data acquired using the EndoFLIP high-resolution impedance planimetry system. The key objectives were to preserve the region-specific aspect of the data and to filter the data in such a way as to remove extraneous contributions to the distensibility signal attributable to vascular pulsations, respiration and esophageal contractions. This was accomplished using sophisticated filtering techniques coupled with a data presentation format that displayed changes in esophageal diameter and CSA as a continuum along the length of the esophagus and across the range of volumetric distensions analogous to techniques used in high-resolution manometry. We tested this technique in a small number of control subjects and patients with EoE selected to typify three distinct phenotypes of that disease process: focal stricture, a narrow caliber esophagus and a normal endoscopic appearance. Our findings suggest that this technique can differentiate these patients in both a qualitative and quantitative way, making it potentially useful to clinically phenotype patients and to monitor disease activity.
The EndoFLIP system uses a commercially developed functional luminal image probe to measure 16 adjacent CSAs within a cylindrical bag placed in the esophagus during volumetric distention coupled with the measurement of intrabag pressure during distension [Gregersen and Andersen, 1991; Orvar et al. 1993; McMahon et al. 2007; Kwiatek et al. 2011]. The device was developed to quantify the distensile characteristics of the esophagus as a function of progressive increases in intraluminal diameter. The on-screen display of the device (Figure 1) depicts these data as a cylindrical solid of varying diameter. However, that depiction is deceptively simple, dependent on bag volume, intrabag pressure, phasic esophageal contractions elicited by intraluminal distension, and superimposed pressure signals attributable to vascular pulsations and respiration. Accounting for these confounding variables can be a daunting task. One approach to data reduction has been to limit the assessment of esophageal distensibility characteristics to a single locus, defined by having the narrowest CSA during each distention volume. Our group previously used that technique to compare the distensibility of patients with EoE with control subjects [Kwiatek et al. 2011]. Although we were able to show that the EndoFLIP tool was useful in defining the most restricting esophageal diameter, that approach ignored regional variation of disease involvement in EoE and required intense analysis to isolate segments of the recordings not contaminated by extraneous pressure signals. Recognizing these limitations was the genesis of the current work.
The filtering approach applied to esophageal diameter and pressure data was devised to eliminate the components of these complex signals attributable to vascular pulsations, respiration and sporadic esophageal contractions. Owing to the relative regularity of vascular pulsations and respiration these were largely extracted with a median filter technique [Hwang and Haddad, 1995]. The more complex task was to eliminate the phasic esophageal contractions elicited by volumetric distensions. The strategy for this applied a pulse detection algorithm using the wavelet decomposition technique, taking advantage of the unique waveform of esophageal contractions. Another important facet of wavelet decomposition was that, unlike filtering based on Fourier analysis in which the entire signal is filtered for the same cutoff frequency, different segments of the signal are differentially filtered depending on their frequency content. Thus, segments of the signal with low-frequency noise (such as esophageal contractions with a frequency of <0.1 Hz) are filtered for low frequency or the mother wavelet waveform while segments with higher frequency noise are selectively filtered for higher frequency mother wavelet waveforms [Daubechies, 1988; Mallat, 1989].
The other novel aspect of our signal-processing methodology pertained to the development of FLIP topography plots. This technique was analogous to esophageal pressure topography plotting of high-resolution manometry data, but optimized to reveal nuances of distensibility data. Also analogous to pressure topography plotting are the advantages of the format: simultaneous visualization of the entire span of distensibility and easily tracking ‘moving targets’ consequent from probe movement or esophageal shortening. Evident in Figure 6, FLIP topography plots clearly illustrated the distinct features of focal stricture, narrow caliber esophagus and globally diminished distensibility in the three subsets of patients with EoE studied. These results are consistent with our previous findings in patients with EoE [Kwiatek et al. 2011], but far more detailed and now derived by a completely automated (and inherently reproducible) data analysis paradigm.
This study is limited by the small sample size and this reflects the pilot nature of these data. We chose four subject groups and selected three representative patients to illustrate how our filtering methodology and FLIP topography plots could be implemented to distinguish important phenotypes in EoE. Future studies will be required that use larger sample sizes to determine whether these parameters can be utilized as biomarkers of clinical outcomes, such as food impaction and requirement for further treatment. In addition, the performance characteristics of these novel analysis techniques will require further validation evaluating the reproducibility and stability of the measurements. The reproducibility of the measurement should be quite stable over short periods of time because the fibrostenotic changes in EoE do not vary quickly over time and even in the face of medical intervention do not exhibit large fluctuations in endoscopic appearance. Given that the line-fitting and curve-fitting distensibility plots are generated with an automated analysis, this reduces concerns regarding inter- and intra-observer variability for the distensibility metrics. However, the observer agreement will still need to be tested on the FLIP topography plots as the outcomes of this analysis are based on a manual visual inspection of the regional heterogeneity of the constricted segments along the esophagus.
In conclusion, we have developed a technique to refine the measurement of esophageal distensibility in EoE with the EndoFLIP device. Our methodology involved the application of computer-based filtering to extract extraneous signals superimposed on the wall distensibility characteristics under study and the adaptation of topographic plotting to parameters relevant to volumetric distension. We hypothesize that, by improving the representation of the qualitative and anatomical variability of esophageal distensibility in patients with EoE, this methodology will facilitate better definition of clinically relevant phenotypes in EoE and other esophageal disorders, such as achalasia, reflux disease and scleroderma. We speculate that this tool may be a viable outcome measure to complement histology as it focuses on a different aspect of the clinical presentation of the disease. However, future studies assessing performance characteristics focused on reproducibility and observer agreement need to be performed across a wide spectrum of patients to support utilization of this technique as a marker of clinical outcome.
Footnotes
Funding: This work was supported by the National Institutes of Health, USA (grant numbers R01 DK56033 (PJK) and R01 DK079902 (JEP)).
Conflict of interest statement: No relevant competing financial and other interests exist for Zhiyue Lin, Peter J. Kahrilas, Yinglian Xiao, Frédéric Nicodème, Nirmala Gonsalves, Ikuo Hirano, or John E. Pandolfino.
Contributor Information
Zhiyue Lin, Feinberg School of Medicine, Department of Medicine, Northwestern University, 676 St Clair Street, Suite 1400, Chicago, IL 60611-2951, USA.
Peter J. Kahrilas, Department of Medicine, Northwestern University, Chicago, IL, USA
Yinglian Xiao, Department of Medicine, Northwestern University, Chicago, IL, USA.
Frédéric Nicodème, Department of Medicine, Northwestern University, Chicago, IL, USA.
Nirmala Gonsalves, Department of Medicine, Northwestern University, Chicago, IL, USA.
Ikuo Hirano, Department of Medicine, Northwestern University, Chicago, IL, USA.
John E. Pandolfino, Department of Medicine, Northwestern University, Chicago, IL, USA
References
- Clouse R., Staiano A. (1991) Topography of the esophageal peristaltic pressure wave. Am J Physiol 261: G677–G684 [DOI] [PubMed] [Google Scholar]
- Daubechies I. (1988) Orthonormal bases of compactly supported wavelets. Comm Pure Appl Math 41: 909–996 [Google Scholar]
- Ghosh S., Pandolfino J., Zhang Q., Jarosz A., Shah N., Kahrilas P. (2006) Quantifying esophageal peristalsis with high-resolution manometry: a study of 75 asymptomatic volunteers. Am J Physiol Gastrointest Liver Physiol 290: G988–G997 [DOI] [PubMed] [Google Scholar]
- Gregersen H., Andersen M. (1991) Impedance measuring system for quantification of cross-sectional area in the gastrointestinal tract. Med Biol Eng Comput 29: 108–110 [DOI] [PubMed] [Google Scholar]
- Hwang H., Haddad R. (1995) Adaptive median filters: new algorithms and results. IEEE Trans Image Process 4: 499–502 [DOI] [PubMed] [Google Scholar]
- Khan S., Orenstein S., Di Lorenzo C., Kocoshis S., Putnam P., Sigurdsson L., et al. (2003) Eosinophilic esophagitis: strictures, impactions, dysphagia. Dig Dis Sci 48: 22–29 [DOI] [PubMed] [Google Scholar]
- Kwiatek M., Hirano I., Kahrilas P., Rothe J., Luger D., Pandolfino J. (2011) Mechanical properties of the esophagus in eosinophilic esophagitis. Gastroenterology 140: 82–90 [DOI] [PMC free article] [PubMed] [Google Scholar]
- Mallat S. (1989) A theory of multiresolution signal decomposition: the wavelet representation. IEEE Trans Patt Anal Machine Intell 1989: 674–693 [Google Scholar]
- McMahon B., Frokjaer J., Kunwald P., Liao D., Funch-Jensen P., Drewes A., et al. (2007) The functional lumen imaging probe (FLIP) for evaluation of the esophagogastric junction. Am J Physiol Gastrointest Liver Physiol 292: G377–G384 [DOI] [PubMed] [Google Scholar]
- Najmabadi M., Devabhaktuni V., Sawan M., Mayrand S., Fallone C. (2009) A new approach to analysis and modeling of esophageal manometry data in humans. IEEE Trans Biomed Eng 56: 1821–1830 [DOI] [PubMed] [Google Scholar]
- Orvar K., Gregersen H., Christensen J. (1993) Biomechanical characteristics of the human esophagus. Dig Dis Sci 38: 197–205 [DOI] [PubMed] [Google Scholar]
- Stanley W. (2005) Technical Analysis and Applications with MATLAB. Clifton, NY: Thomson Delmar Learning [Google Scholar]
- Vinter-Jensen L., Juhl C., Gregersen H. (1994) Regional differences in passive elastic wall properties of the esophagus: an impedance planimetric study in pigs. Neurogastroenterol Motil 6: 233–238 [Google Scholar]


