

Abstract
An imaging modality that can accurately discern prostate cancer (PCa) foci would be useful to detect PCa early or guide treatment. We have engineered numerous adenoviral vectors (Ads) to carry out reporter gene-based imaging using specific promoters to express a potent transcriptional activator, which in turn activates the reporter gene in PCa. This two-step transcriptional amplification (TSTA) method can boost promoters' activity, while maintaining cell specificity. Here, we examined a dual TSTA (DTSTA) approach, which utilizes TSTA not only to express the imaging reporter, but also to direct viral genome replication of a conditionally replicating Ad (CRAd) to further augment the expression levels of the reporter gene by genomic amplification supported in trans by coadministered CRAd. In vitro studies showed up to 50-fold increase of the reporter genome by DTSTA. Compared with TSTA reporter alone, DTSTA application exhibited a 25-fold increase in imaging signal in PCa xenografts. DTSTA approach is also beneficial for a combination of two TSTA Ads with distinct promoters, although amplification is observed only when TSTA-CRAd can replicate. Consequently, the DTSTA approach is a hybrid method of transcriptional and genomic augmentation that can provide higher level reporter gene expression potentially with a lower dose of viral administration.
Introduction
Cancer molecular imaging takes advantage of tracers to specifically visualize cancer cells. These tracers can be a small molecule substrate, an antibody, or a peptide that targets specific proteins expressed in cancer cells. If the target of the tracer is an exogenous protein delivered into cancer cells, then this exogenous protein is called a reporter. One strategy to achieve sensitive and specific imaging signal based on the molecular signature of the cancerous tissue is to use cell-specific transcription to control the expression of exogenous imaging reporter genes.1,2 However, the transcriptional activities of most tissue-specific promoters are often not sufficient to allow robust reporter imaging signal detection in vivo. To overcome this limitation, we and others have developed an effective bipartite transcriptional amplification system that is based on the Gal4-UAS enhancer trap approach widely used in Drosophila genetic targeting research3,4 and adapted it as a mammalian gene expression strategy.5,6,7,8 This two-step transcriptional amplification (TSTA) system,6,9 has two components that work in series: first, a tissue or cancer-specific promoter driven expression of the synthetic transcription amplifier, Gal4VP16 fusion protein; second, Gal4VP16 activates exclusively the expression of a reporter gene downstream of multiple tandem Gal4 binding sites (e.g., firefly luciferase (FL)) (Figure 1a,b). For instance, using AdPSA-TSTA-FL, an imaging adenoviral vector (Ad) employing enhanced prostate-specific antigen (PSA) promoter to direct the expression of the amplifier Gal4VP16, and Gal4VP16 then drives the expression of FL, we showed that the TSTA approach was able to achieve 800-fold higher expression over the native PSA promoter.9
Figure 1.
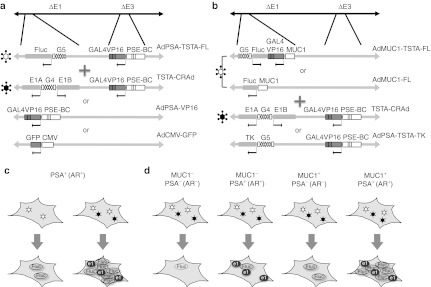
The experimental design and concept of the Dual-TSTA study. The Dual-TSTA (DTSTA) system was examined in tissue culture with two different experimental designs. (a,b) Show the list and combination of adenovirus vectors used in each experiment; (c,d) Cartoon of expected gene expression following infection. (a) PSA-positive (androgen receptor positive) prostate cancer cell lines were infected with the combination of AdPSA-TSTA-FL and either of TSTA-CRAd, AdPSA-VP16 or AdCMV-GFP, the latter two being control, balancing vectors. Both TSTA are regulated under the modified PSA promoter PSE-BC. (c) The expression of firefly luciferase (FL) reporter gene will be amplified further when coinfected with TSTA-CRAd compared to single infection. (b) The combined infection with two distinct promoters, the PSE-BC–based TSTA-CRAd, and MUC1 promoter-based reporter vector (AdMUC1-FL or AdMUC1-TSTA-FL). A nonreplicating AdPSA-TSTA-TK, expressing HSV-TK, was used as the control balancing Ad. (d) The schema depicts the expected gene expression in different cells, with respect to MUC1 and PSA expression status. In MUC1− and AR− cells, reporter gene expression should be negligible. In AR+ cells, the presence of TSTA-CRAd will amplify the reporter signal. Highest FL expression is expected in MUC1+ and AR+ cells, as both transcriptional and genomic amplification mechanism will be at play. Ad, adenoviral vector; AR, androgen receptor; CMV, cytomegalovirus; CRAd, conditionally replicating Ad; GFP, green fluorescent protein; MUC1, mucin 1; PSA, prostate-specific antigen; TSTA, two-step transcriptional amplification.
In this study, we aim to explore whether the expression level of our imaging Ads can be further augmented by combining transcriptional amplification of TSTA with the genome amplification of prostate-restricted conditional replicating virus (TSTA-CRAd) (Figure 1c). Moreover, by driving transcriptional and genomic amplification with two different tumor-specific promoters in two separate Ads, we showed that the cell-discriminatory ability of this dual-TSTA approach can likely achieve more sensitive prostate cancer imaging (Figure 1d).
Results
Coinfection of prostate-specific TSTA-CRAd with TSTA reporter adenovirus further increased reporter gene expression in PCa cell lines
The AdPSA-TSTA-FL virus is a replication-deficient type 5 adenovirus that lacks the viral E1 and E3 gene locus, but instead contains the FL and Gal4VP16 expression cassette at the respective locus (Figure 1a). The Gal4VP16 gene is driven by an enhanced PSA promoter, PSE-BC.10,11 The TSTA-CRAd contains the same transactivator component in E3, but its E1A and E1B gene expression are activated by Gal4VP16 in response to the PSE-BC promoter. Our hypothesis was that coinfection of the TSTA-CRAd with AdPSA-TSTA-FL would further amplify FL expression by allowing trans-replication of the AdPSA-TSTA-FL genome through E1 proteins produced by the TSTA-CRAd (Figure 1c). As controls, we also used a nonreplicating virus carrying only the expression cassette with Gal4VP16 driven by PSE-BC promoter placed in the E1 region (AdPSA-VP16, Figure 1a).
We next tested the ability of the TSTA-CRAd to enhance AdPSA-TSTA-FL–mediated FL activity by coinfecting PCa cell lines with AdPSA-TSTA-FL in combination with TSTA-CRAd, or negative controls AdCMV-GFP or AdPSA-VP16. As shown in Figure 2, the addition of TSTA-CRAd increased FL activity and the increase in FL was detected by day 4 and continued to rise until end of analyses on day 8 in both LNCaP, CWR22Rv1 (Figure 2a,c, respectively), and LAPC-4 (data not shown). We observed an increased activity of up to 6.2-fold at 8 days post-transduction in the androgen-dependent androgen receptor (AR)-expressing LNCaP cells (Figure 2a). In the AR+ but hormone-refractory CWR22Rv1 cell line, the kinetics of FL expression amplification was delayed, and the fold amplification was observed to be 2.5-fold above controls on day 8. The lower activity of AdPSA-TSTA-FL and TSTA-CRAd in CWR22Rv1 relative to LNCaP cells was attributed to lower functional AR activity in CWR22Rv1 cells, which we have consistently observed in prior studies.12,13 The amplification provided by TSTA-CRAd was specific to the presence of E1 viral regulatory proteins because it did not occur with the control AdPSA-VP16 or AdCMV-GFP vectors. Since TSTA-CRAd is a replication-competent Ad, we tested whether viral replication would induce cell toxicity and therefore counteract the effect of amplified reporter gene expression. We performed a time-course lactate dehydrogenase cytotoxicity assay comparing cell viability between experimental groups tested for FL activity above. As shown in Figure 2b,d, minimal cytotoxicity was observed following addition of TSTA-CRAd when compared with control vectors. Originally, TSTA-CRAd was designed as a replication-competent tumoricidal adenovirus (i.e., an oncolytic Ad). However, its replication efficiency was lower than that of wild-type adenovirus (Supplementary Figure S1), which is likely due to a suboptimal level of E1 protein expression from TSTA-CRAd (Supplementary Figure S2). Although TSTA-CRAd is not effective as an oncolytic agent, it can support viral replication, i.e., genome amplification, without killing host cells.
Figure 2.

Coinfection of TSTA-CRAd with AdPSA-TSTA-FL further amplifies reporter gene expression by genome copy amplification in prostate cancer cells. (a,b) LNCaP and (c,d) CWR22Rv1 PCa cells were infected with the AdPSA-TSTA-FL virus (MOI = 0.5) and either with the TSTA-CRAd or controls (AdCMV-GFP or AdPSA-VP16 viruses) at MOI = 3. (a,c) Show the FL activity, assessed on day 2, 4, 6, and 8 post-infection. Each point on the graph represents the average of duplicates ± SE of FL activity per µg protein. (b,d) Cell cytotoxicity of the coinfection experiments described above, determined at day 2, 4, 6 or 8 after adenoviral infections. LDH cell cytotoxicity was normalized to the level on day 2 after viral infection. (e) Amplification of the AdPSA-TSTA-FL genome by TSTA-CRAd. Real-time PCR was performed on total DNA extracted from LNCaP coinfected either with AdCMV-GFP, AdPSA-VP16 or TSTA-CRAd. The copy number of AdPSA-TSTA-FL genomes increases with TSTA-CRAd addition but not in controls (AdCMV-GFP or AdPSA-VP16 viruses), suggesting the viral replication of AdPSA-TSTA-FL supported by TSTA-CRAd. Values are reported as fold-FL gene copy number normalized to that of day 2 ± SE of FL activity per µg protein from duplicates. Ad, adenoviral vector; CMV, cytomegalovirus; CRAd, conditionally replicating Ad; FL, firefly luciferase; GFP, green fluorescent protein; LDH, lactate dehydrogenase; MOI, multiplicity of infection; PCa, prostate cancer; PSA, prostate-specific antigen; TSTA, two-step transcriptional amplification.
To confirm that TSTA-CRAd is indeed amplifying the imaging reporter viral genome in trans, we quantified the copy number of the FL gene at different timepoints after the coinfection experiments. As shown in Figure 2e, the addition of TSTA-CRAd resulted in a robust increase in gene copy number of AdPSA-TSTA-FL. The genome copy increase was noted at day 4 and continued to day 8, which is 58-fold higher than the level of day 2. This increase in DNA copy number was attributed specifically to the TSTA-CRAd as it was not observed in either the AdPSA-VP16 or AdCMV-GFP coinfected groups. These results confirmed that the increase in FL activity rendered by coinfection with TSTA-CRAd is due to the E1 proteins provided in trans.
The dual amplification (DTSTA) is an efficient amplification method for molecular imaging of PCa in vivo
We designate the combined transcriptional and viral genomic amplification approach as dual TSTA (DTSTA) and proceed to examine its ability to increase the sensitivity of in vivo molecular imaging. We grew xenografts of Renilla luciferase (RL)-marked LAPC-9 cells (LAPC-9-RL) on the flank of severe combined immunodeficiency/Beige mice. We next intratumorally injected AdPSA-TSTA-FL with either AdCMV-GFP (nonreplicating control Ad) or TSTA-CRAd (DTSTA), followed by imaging at different timepoints. Consistent across several assays, tumors injected with DTSTA (AdPSA-TSTA-FL + TSTA-CRAd) displayed much higher FL imaging signals than that those injected with equivalent dose of AdPSA-TSTA-FL alone (Figure 3a–d). For instance, on day 7, the three DTSTA-injected tumors showed a higher level of FL signal than the AdPSA-TSTA-FL singly injected tumors, and the increase averaged to 14.1-fold (Figure 3b). To account for variability in tumor volume, we normalized the Ad-mediated FL signal to RL signal emanating from the marked tumor cells by measuring the respective FL and RL signal from tumor extracts harvested on day 14 and again, the DTSTA group exhibited an average increase in FL/RL ratio of 79-fold over singly AdPSA-TSTA-FL–injected group (Figure 3c). We further confirmed that viral replication occurred in the DTSTA-injected tumors by measuring FL gene copy number. Figure 3d shows that there was viral replication of the AdPSA-TSTA-FL virus, but only when coinjected with the TSTA-CRAd virus. In monitoring the dynamic imaging signal over time, the FL activity remained low and stable in the mice that received nonreplicating vector, while the signal increased drastically with time in the DTSTA-injected mice (Figure 3e). On average, mice injected with DTSTA exhibited 1.7, 14.1, and 25.1-fold higher FL activity than the AdPSA-TSTA-FL alone group on day 3, 7, and 14 (data not shown). Taken together, these results showed that DTSTA can further increase the gene expression of imaging reporter gene beyond the already amplified level of TSTA by viral genome replication. Thus, DTSTA is expected to have higher imaging sensitivity and thus able to detect lower tumor burden than previously reported.
Figure 3.

The highly amplified activity of DTSTA in vivo in the xenograft LAPC-9 PCa model. (a) LAPC-9-RL (overexpressing the Renilla luciferase) tumors were grown as xenografts in SCID/Beige mice. After randomization for tumor size, mice were injected with AdPSA-TSTA-FL in combination with AdCMV-GFP (left panels) or with TSTA-CRAd (right panels). Mice were then imaged in vivo at different timepoints using a CCD-camera to detect bioluminescence emitted by FL following luciferin intraperitoneal injection. (b) In vivo bioluminescence quantification at 7 days after infection for each mouse. In average, animals with CRAd showed total flux of 4.4 ± 1.3 × 10⁷ photons per second (p/s) compared with control animals (+CMV-GFP): 31.0 ± 8.3 × 10⁵ p/s. These are statistically significant (P < 0.05) based on the Student's t-test with equal variance. (c) Ex-vivo firefly-to-Renilla luciferase activity ratio for each mouse tumor extract. On average, ratios of group with control and with CRAd were 1.9 ± 1.3 × 10⁻⁴ and 15.0 ± 2.8 × 10⁻³, respectively. These are statistically significant (P < 0.05) based on the t-test with equal variance. (d) Ex-vivo real-time PCR using FL gene-specific primers on total DNA extracts for each mouse. In average, group with control and with CRAd were 1.8 ± 1.1 and 3.0 ± 1.1 × 10⁻², respectively (P = 0.05). (e) FL activity increases with time after DTSTA injection in LAPC-9-RL tumors. Mice 101R (AdPSA-TSTA-FL) and 101B (DTSTA) were imaged in vivo at different timepoints using a CCD-camera to detect bioluminescence emitted by FL. The FL activity increases with time after infection in the DTSTA-infected mouse while it is stable for the mouse infected with AdPSA-TSTA-FL alone. Ad, adenoviral vector; CMV, cytomegalovirus; CRAd, conditionally replicating Ad; DTSTA, dual two-step transcriptional amplification; FL, firefly luciferase; GFP, green fluorescent protein; PCa, prostate cancer; PSA, prostate-specific antigen; SCID, severe combined immunodeficiency.
DTSTA allows a multiplex targeting strategy with two distinct promoters
While PSA promoter-based reporter system allows prostate-specific imaging, such a system is difficult to differentiate between malignant and nonmalignant prostate epithelial cells since both cell populations express PSA. Hence, we examined whether incorporating a tumor-specific promoter to regulate one of the steps of DTSTA could further enhance cancer specificity of imaging. The experimental design to test this concept was shown in Figure 1b,d. The mucin 1 (MUC1) gene has been shown to be overexpressed and is of prognostic value in human PCa.14 To test the multiplex targeting strategy, we devised a DTSTA system with the reporter gene expression under the control of the tumor-specific MUC1 promoter and viral replication under the PSA promoter (Figure 1b,d). We examined the combination of the TSTA-CRAd and AdMUC1-FL, a non-TSTA Ad, to obtain a proof of principle. As shown in Figure 4, coinfection of AdMUC1-FL with TSTA-CRAd in prostate (LNCaP and LAPC-4), cervical (HeLa), breast (MDA-MB-435) or liver (HepG2) carcinoma cells resulted in an amplification of the MUC1 signal only in prostate cell lines. The addition of TSTA-CRAd to AdMUC1-FL virus increased the FL activity up to 307.6 ± 58.9- and 9.5 ± 2.0-fold for LNCaP and LAPC-4, respectively, while only marginal increase was seen in other cell lines. Of note, the DTSTA could not amplify the activity of the MUC1 promoter in non-cancerous BPH1 prostate epithelial cells showing it can also discriminate benign from cancerous cells (Figure 4d versus Figure 4a,c). Based on these findings, we tested the DTSTA system in LNCaP cells. The addition of TSTA-CRAd to AdMUC1-FL (Figure 4a) or AdMUC1-TSTA-FL (Figure 4b) could amplify FL activity by 307- or 1,852.7-fold, respectively, compared with the MUC1 reporter Ad alone. Moreover, the amplification effects of the TSTA-CRAd was only seen in AR-positive cell lines (LNCaP, LAPC-4, CWR22Rv1, C4-2, MDA PCa 2b, and T-47D, data not shown), but in none of the AR-negative cell lines tested (BPH1, DU145, PC-3, HepG2, HeLa, MDA-MB-435 and KPL1, data not shown) confirming the increased expression and hence signal of the DTSTA system is due to the replication of MUC1-Ad in androgen-responsive cells through the PSE-BC–dependent E1 expression. Taken together, these results demonstrate that different combinations of tumor- and tissue-specific promoters in the DTSTA system can not only characterize multiple gene expression in vivo by molecular imaging, but also, increase the sensitivity of the system.
Figure 4.

The enhanced expression of combining a cancer-specific (MUC1) and prostate-specific promoters in the DTSTA system. (a) FL activity in LNCaP was examined with two different coinfection; AdMUC1-FL plus AdPSA-TSTA-TK (closed bars) or AdMUC1-FL plus TSTA-CRAd (open bars). (b) LNCaP cells were infected with AdMUC1-TSTA-FL plus AdPSA-TSTA-TK (darker hatched bars) or AdMUC1-TSTA-FL plus TSTA-CRAd (lightly dotted bars). (c) The AR+ prostate cancer line, LAPC-4, (d) untransformed prostatic epithelial BPH1 cell line, (e) MDA-MB-435 breast cancer cell line, (f) HepG2 hepatic carcinoma line, and (g) HeLa cervical carcinoma cell line are coinfected with either AdMUC1-FL plus control, replication-incompetent AdPSA-TSTA-TK (closed bars) or AdMUC1-FL plus TSTA-CRAd (open bars). Infection of all the virus were carried out at MOI = 1. Cells harvested on day 2, 4, and 6 are subjected to luciferase assay. Numbers on top of each graph shows ratios of FL activity of coinfection with or without TSTA-CRAd (e.g., AdMUC1-FL + TSTA-CRAd activity divided by AdMUC1-FL + AdPSA-TSTA-TK activity). Ad, adenoviral vector; AR, androgen receptor; CRAd, conditionally replicating Ad; DTSTA, dual two-step transcriptional amplification; FL, firefly luciferase; MOI, multiplicity of infection; MUC1, mucin 1.
Discussion
Due to the current concerns such as the limited accuracy of prostate random biopsies, the number of treatments available, and the heterogeneous course of the disease, molecular imaging of prostate cancer is an area that still needs great advances to better characterize intra- and extra-prostatic cancer staging. Imaging transcriptional alterations in vivo is one of the many approaches that have been extensively studied. However, the relatively weak activity of many tumor-specific promoters has restricted its application for molecular imaging in vivo. To circumvent this limitation, our group and others have developed the TSTA transcriptional amplification method.6,9 Extensive experience in the last 10 years demonstrated that the TSTA approach can greatly enhance transcription from a wide range of cancer- and tissue-specific promoters, e.g., PPT (PSA enhancer-PSMA enhancer-TARP promoter), survivin, MUC1, vascular endothelial growth factor, PSES (prostate-specific enhancing sequence) and cardiac-specific promoters12,15,16,17 to direct sensitive and specific reporter gene-based imaging with optical and positron emission tomography modality in murine and canine model.9,13,18,19 This amplified transcription-based imaging approach has been successfully applied to monitor dynamic processes such as transcriptional factor function,20 cancer therapeutics,18,21 and metastasis22,23 in living subjects.
Another strategy that could amplify imaging reporter gene expression is through increase of gene dosage copies. This approach is particularly relevant in the context of oncolytic adenovirus-based cancer therapy, in which tumor-specific promoter is used to drive lytic viral replication. Often, imaging reporter gene is inserted into the oncolytic virus to monitor viral gene delivery, replication, and therapeutic impact in vivo. In this setting, a study by Kim et al. has shown that the inserted HSV-TK positron emission tomography reporter gene was expressed at a higher level in a replicating E1B-deleted oncolytic Ad comparing to nonreplicating virus.24 In another example, Kishimoto et al. created an oncolytic adenovirus that is regulated by the human telomerase reverse transcriptase promoter, and inserted a green fluorescent protein (GFP) expression cassette driven by the constitutive cytomegalovirus (CMV) promoter as the reporter system. Using this approach, they were able to discern normal from cancerous tissues and visualize tumor cells by GFP expression in mesenteric lymph nodes in a rectal tumor model.25,26 The findings from the above mentioned studies do support the notion that viral replication can boost the expression of inserted imaging reporter gene. However, two issues hinder an accurate assessment of the level of enhancement of reporter gene expression in the oncolytic virus. First, the cytotoxic and cytolytic activity induced by an oncolytic virus on infected tumor cells would likely prohibit maximal expression of inserted transgene, thus underestimating the gene expression enhancement effects of genomic amplification. Second, the use of strong constitutive viral CMV promoter to express reporter gene could result in disproportionately high reporter gene expression relative to the viral replication process, which is regulated by tumor-specific promoter. In this study, we generated a replication-competent TSTA-CRAd that is also capable of replicating the genome of a coinfected virus (Figures 1 and 2e). However, this CRAd displayed negligible cytotoxic activity to tumor cells (Figure 2b,d), which could be accounted for by the following reasons. The magnitude of viral genome replication of TSTA-CRAd in an infection cycle is much lower (about 10%) than that of a wild-type adenovirus (dl309, Supplementary Figure S1), which is likely contributed by a suboptimal level of E1 protein expression (Supplementary Figure S2). The E1A gene expression regulated by the TSTA system is oriented in the opposite direction of the native viral genome, which could lower its expression.27 Moreover, TSTA-CRAd also lacks E3 genes that include adenovirus death protein, which enables efficient virion release and spread to neighboring cells.28
Here, we took advantage of TSTA-CRAd's uncoupled viral replication and cytolytic activity to assess the impact of genomic amplification on gene expression. The addition of viral genomic amplification to TSTA transcriptional amplification (i.e., DTSTA approach) boosted the expression level of imaging reporter gene by more than sixfold over the TSTA vector alone in LNCaP PCa cells (Figure 2a). In the initial characterization of the PSA-TSTA amplification system, we demonstrated the TSTA-directed expression is about 800-fold higher than that driven by the native PSA promoter. By back calculation, the gene expression level of the combined DTSTA system could theoretically be 4,800-fold higher than the native PSA promoter in cell culture infection studies. Interestingly, the level of imaging signal enhancement induced by the addition of TSTA-CRAd (genomic amplification) in tumor setting is significantly higher than in vitro, reaching 25-fold higher than nonreplicating control at day 14 after viral injection (Figure 3e). The viral replication process can lead to increased accumulation of transgene templates over time or slow down the rate of template loss in the growing tumor over time. Alternatively, the replicated new progeny virus can slowly release and spread to neighboring cells and express a new round of reporter gene in the secondary infected cells. Further investigation is needed to distinguish between different mechanisms of reporter gene amplification in vivo as a result of adding TSTA-CRAd.
The simultaneous delivery of two viruses into the same cell to achieve the combined genomic and transcriptional amplification described here is very inefficient, especially in in vivo gene delivery settings where often a very low vector-to-cell ratio can be achieved. The reason that we dissociated these two amplification steps in this study is to better understand the contribution of each component and also to evaluate whether mixing and matching two separate cell-specific promoters for the two amplification steps can achieve more selective expression. Findings from this study support that the DTSTA approach is a versatile platform to build new generations of adenoviral imaging vectors from the bottom up to achieve further augmented cancer selectivity and imaging sensitivity. In summary, the combined transcriptional and genomic amplification strategy described here can be used to achieve sensitive imaging of PCa lesions based on molecular pathological process of the disease.
Materials and Methods
Adenovirus construction and production. All the Ad vectors except AdCMV-GFP used in this report are based on AdEasy system.29 AdCMV-GFP was constructed by the conventional homologous recombination between 293 cells and adenoviral genome containing plasmid DNA. The virus grown in 293 cells was purified by density gradient centrifugation using cesium chloride. Titer was determined by plaque formation assays on 293 monolayers. Viruses are stored in 10 mmol/l Tris-HCl, 1 mmol/l MgCl2, and 10% glycerol at −80 °C until use. Construction and propagation of AdMUC1-FL and AdMUC1-TSTA-FL are described previously.30 The construction of TSTA-CRAd, AdPSA-TSTA-E1, is similar to AdPSA-TSTA-FL as described previously except distinct shuttle plasmid harboring bidirectional expression cassettes encoding E1A and E1B was employed.10,31 In this shuttle plasmid, nucleotides from regions of E1A (nucleotide 560–1,545) and E1B (nucleotide 1,714–3,509) are placed in a head-to-head manner and four repeats of Gal4 binding consensus sequence are inserted in the middle of two genes along with minimal promoters (Figure 1a).
Tissue culture and Ad infection experiments. Human PCa cell line LNCaP and CWR22Rv1, non-cancerous BPH1 prostate epithelial cells, breast carcinoma cell line MDA-MB-435, cervical carcinoma cell line HeLa, and liver carcinoma cell line HepG2 were all grown in RPMI-1640 (Mediatech, Herndon, VA) supplemented with 10% fetal bovine serum and 1% penicillin/streptomycin solution. Iscove's modification of Dulbecco's modified Eagle's medium (Mediatech) was used for LAPC-4 PCa cell line. For adenovirus infection experiments, 1 × 10⁵ cells per well were plated for all cell lines except LAPC-4 (2 × 10⁵ cells per well) in 24-well plates 24 hours before infection. Cells were then infected with recombinant adenovirus at the indicated multiplicity of infection. Two days after infection or indicated timepoints, cells were harvested, lysed, and assayed by standard luciferase assay (Promega, Madison, MI) using a luminometer (Berthold Detection Systems, Pforzheim, Germany) with a 10-seconds integration time. Each value was calculated as the average of triplicate samples. Cell lysates were then assessed for their protein content using the Bradford protein assay (Thermo Scientific Pierce, Rockford, IL). Relative FL activity was calculated as bioluminescence (photon/second) over protein content (µg) or Renilla luciferase activity as indicated.
Animal work and imaging. Male Fox Chase SCID Beige mice (SCID/Beige mice; Charles Rivers, Wilmington, MA) were used for these studies. LAPC-9 PCa cell xenografts were passed continuously in male SCID/Beige mice and injected as a single cell suspension.32 One million LAPC-9 cells were marked with pccl-CMV-RL-IRES-EGFP lentiviruses,18 FACS-sorted and then implanted into the flank of mice (1 × 10⁶ cells per animal). Tumors were grown for 28 days. After mice randomization based on tumor volume (three mice per group), animals received intratumoral injections of adenovirus (1 × 10⁷ plaque-forming unit/virus/animal in 50 µl of phosphate-buffered saline). Mice were administered with AdPSA-TSTA-FL in combination with either AdCMV-GFP (control group) or TSTA-CRAd (DTSTA group). Under 2% isoflurane anesthesia, mice were imaged on days 3, 7, and 14, 20 minutes after intraperitoneal injection of 150 mg/kg of D-Luciferin (Caliper LifeSciences, Hopkinton, MA) using IVIS CCD camera (Xenogen, Alameda, CA). Images were analyzed using IGOR-PRO Living Image Software (Xenogen), as described previously.10 Regions of interest were determined around the tumors and photon emission quantified as total flux (photon/second). On day 14, mice were euthanized and tumors were extracted and snap frozen in liquid nitrogen for further analysis. All animal studies have been approved by our Institutional Review Board.
DNA and RNA extraction and quantitative real-time PCR. For real-time PCR analysis, total DNA was extracted from each cell line infected with Ad at multiplicity of infection = 1. DNA extraction was performed using DNeasy Blood & Tissue Kit (QIAGEN, Valencia, CA). Tumor samples were also processed with DNeasy kit to extract total DNA. Detail of real-time analysis is described previously.33 Ad viral replication was judged based on the number by calculating resultant cycle threshold (Ct) values.
Lactate dehydrogenase cell toxicity assays. To examine Ads cytotoxicity, LDH Cytotoxicity Detection Kit (TAKARA BIO, Shiga, Japan) was used. Briefly, culture supernatant from Ad-infected cells was collected every other day until day 8 and kept in dark at 4 °C. Following the experiments, culture supernatants were mixed with assay solutions, incubated, and analyzed in a plate reader (Bio-Rad, Hercules, CA) in accordance with manufacturer's instruction.
Statistical analysis. Student's t-test was performed to compare FL activity/µg protein, FL/RL activities or FL DNA copies between AdCMV-GFP or TSTA-CRAd coinfected AdPSA-TSTA-FL groups (Figure 3a–c). Statistical significance was determined as P < 0.05.
SUPPLEMENTARY MATERIAL Figure S1. Viral output/input ratio of wild-type Ad (dl309), oncolytic Ad (dl1520), and TSTA-CRAd in LNCaP cells. Figure S2. LNCaP cells were infected with either dl309 (wild-type) or TSTA-CRAd at MOI = 1.
Acknowledgments
We thank National Cancer Institute (RO1 CA101904, R21 CA122693, and P50 CA092131) for their support to L.W.. F.P. is a former urologic oncology fellow at UCLA that was supported in part by the McLaughlin and the Conseil des Médecins Dentistes et Pharmaciens fellowship scholarships, both from Laval University, the Québec Urological Association and is now supported by the Prostate Cancer Canada Clinician Scientist grant. B.D.W.K. is supported by the Career Development Award from the UCLA SPORE in Prostate Cancer. We thank Fanxiang Jin for his technical assistance. The authors declared no conflict of interest.
Supplementary Material
Viral output/input ratio of wild-type Ad (dl309), oncolytic Ad (dl1520), and TSTA-CRAd in LNCaP cells.
LNCaP cells were infected with either dl309 (wild-type) or TSTA-CRAd at MOI = 1.
REFERENCES
- Min JJ., and, Gambhir SS. Molecular imaging of PET reporter gene expression. Handb Exp Pharmacol. 2008. pp. 277–303. [DOI] [PubMed]
- Pouliot F, Johnson M., and, Wu L. Non-invasive molecular imaging of prostate cancer lymph node metastasis. Trends Mol Med. 2009;15:254–262. doi: 10.1016/j.molmed.2009.04.004. [DOI] [PMC free article] [PubMed] [Google Scholar]
- Brand AH., and, Perrimon N. Targeted gene expression as a means of altering cell fates and generating dominant phenotypes. Development. 1993;118:401–415. doi: 10.1242/dev.118.2.401. [DOI] [PubMed] [Google Scholar]
- Fischer JA, Giniger E, Maniatis T., and, Ptashne M. GAL4 activates transcription in Drosophila. Nature. 1988;332:853–856. doi: 10.1038/332853a0. [DOI] [PubMed] [Google Scholar]
- Block A, Milasinovic D, Mueller J, Schaefer P, Schaefer H., and, Greten H. Amplified Muc1-specific gene expression in colon cancer cells utilizing a binary system in adenoviral vectors. Anticancer Res. 2002;22 6A:3285–3292. [PubMed] [Google Scholar]
- Iyer M, Wu L, Carey M, Wang Y, Smallwood A., and, Gambhir SS. Two-step transcriptional amplification as a method for imaging reporter gene expression using weak promoters. Proc Natl Acad Sci USA. 2001;98:14595–14600. doi: 10.1073/pnas.251551098. [DOI] [PMC free article] [PubMed] [Google Scholar]
- Koch PE, Guo ZS, Kagawa S, Gu J, Roth JA., and, Fang B. Augmenting transgene expression from carcinoembryonic antigen (CEA) promoter via a GAL4 gene regulatory system. Mol Ther. 2001;3:278–283. doi: 10.1006/mthe.2001.0273. [DOI] [PubMed] [Google Scholar]
- Qiao J, Doubrovin M, Sauter BV, Huang Y, Guo ZS, Balatoni J.et al. (2002Tumor-specific transcriptional targeting of suicide gene therapy Gene Ther 9168–175. [DOI] [PubMed] [Google Scholar]
- Zhang L, Adams JY, Billick E, Ilagan R, Iyer M, Le K.et al. (2002Molecular engineering of a two-step transcription amplification (TSTA) system for transgene delivery in prostate cancer Mol Ther 5223–232. [DOI] [PubMed] [Google Scholar]
- Sato M, Figueiredo ML, Burton JB, Johnson M, Chen M, Powell R.et al. (2008Configurations of a two-tiered amplified gene expression system in adenoviral vectors designed to improve the specificity of in vivo prostate cancer imaging Gene Ther 15583–593. [DOI] [PMC free article] [PubMed] [Google Scholar]
- Wu L, Matherly J, Smallwood A, Adams JY, Billick E, Belldegrun A.et al. (2001Chimeric PSA enhancers exhibit augmented activity in prostate cancer gene therapy vectors Gene Ther 81416–1426. [DOI] [PubMed] [Google Scholar]
- Jiang ZK, Sato M, Wei LH, Kao C., and, Wu L. Androgen-independent molecular imaging vectors to detect castration-resistant and metastatic prostate cancer. Cancer Res. 2011;71:6250–6260. doi: 10.1158/0008-5472.CAN-11-1520. [DOI] [PMC free article] [PubMed] [Google Scholar]
- Sato M, Johnson M, Zhang L, Gambhir SS, Carey M., and, Wu L. Functionality of androgen receptor-based gene expression imaging in hormone refractory prostate cancer. Clin Cancer Res. 2005;11:3743–3749. doi: 10.1158/1078-0432.CCR-04-1990. [DOI] [PMC free article] [PubMed] [Google Scholar]
- Lapointe J, Li C, Higgins JP, van de Rijn M, Bair E, Montgomery K.et al. (2004Gene expression profiling identifies clinically relevant subtypes of prostate cancer Proc Natl Acad Sci USA 101811–816. [DOI] [PMC free article] [PubMed] [Google Scholar]
- Chen IY, Gheysens O, Ray S, Wang Q, Padmanabhan P, Paulmurugan R.et al. (2010Indirect imaging of cardiac-specific transgene expression using a bidirectional two-step transcriptional amplification strategy Gene Ther 17827–838. [DOI] [PMC free article] [PubMed] [Google Scholar]
- Dzojic H, Cheng WS., and, Essand M. Two-step amplification of the human PPT sequence provides specific gene expression in an immunocompetent murine prostate cancer model. Cancer Gene Ther. 2007;14:233–240. doi: 10.1038/sj.cgt.7701007. [DOI] [PubMed] [Google Scholar]
- Figueiredo ML, Gambhir SS, Carey M., and, Wu L.2010Cell-specific imaging of reporter gene expression using a two-step transcriptional amplification strategy Gambhir SS., and, Yaghoubi GS.eds). Molecular Imaging With Reporter Genes Cambridge University Press: Cambridge, UK; pp 127–148. [Google Scholar]
- Johnson M, Sato M, Burton J, Gambhir SS, Carey M., and, Wu L. Micro-PET/CT monitoring of herpes thymidine kinase suicide gene therapy in a prostate cancer xenograft: the advantage of a cell-specific transcriptional targeting approach. Mol Imaging. 2005;4:463–472. doi: 10.2310/7290.2005.05154. [DOI] [PMC free article] [PubMed] [Google Scholar]
- Pouliot F, Karanikolas BD, Johnson M, Sato M, Priceman SJ, Stout D.et al. (2011In vivo imaging of intraprostatic-specific gene transcription by PET J Nucl Med 52784–791. [DOI] [PMC free article] [PubMed] [Google Scholar]
- Zhang L, Johnson M, Le KH, Sato M, Ilagan R, Iyer M.et al. (2003Interrogating androgen receptor function in recurrent prostate cancer Cancer Res 634552–4560. [PubMed] [Google Scholar]
- Ilagan R, Zhang LJ, Pottratz J, Le K, Salas S, Iyer M.et al. (2005Imaging androgen receptor function during flutamide treatment in the LAPC9 xenograft model Mol Cancer Ther 41662–1669. [DOI] [PubMed] [Google Scholar]
- Adams JY, Johnson M, Sato M, Berger F, Gambhir SS, Carey M.et al. (2002Visualization of advanced human prostate cancer lesions in living mice by a targeted gene transfer vector and optical imaging Nat Med 8891–897. [DOI] [PubMed] [Google Scholar]
- Burton JB, Johnson M, Sato M, Koh SB, Mulholland DJ, Stout D.et al. (2008Adenovirus-mediated gene expression imaging to directly detect sentinel lymph node metastasis of prostate cancer Nat Med 14882–888. [DOI] [PMC free article] [PubMed] [Google Scholar]
- Kim EJ, Yoo JY, Choi YH, Ahn KJ, Lee JD, Yun CO.et al. (2008Imaging of viral thymidine kinase gene expression by replicating oncolytic adenovirus and prediction of therapeutic efficacy Yonsei Med J 49811–818. [DOI] [PMC free article] [PubMed] [Google Scholar]
- Kishimoto H, Kojima T, Watanabe Y, Kagawa S, Fujiwara T, Uno F.et al. (2006In vivo imaging of lymph node metastasis with telomerase-specific replication-selective adenovirus Nat Med 121213–1219. [DOI] [PubMed] [Google Scholar]
- Umeoka T, Kawashima T, Kagawa S, Teraishi F, Taki M, Nishizaki M.et al. (2004Visualization of intrathoracically disseminated solid tumors in mice with optical imaging by telomerase-specific amplification of a transferred green fluorescent protein gene Cancer Res 646259–6265. [DOI] [PubMed] [Google Scholar]
- Ray S, Paulmurugan R, Hildebrandt I, Iyer M, Wu L, Carey M.et al. (2004Novel bidirectional vector strategy for amplification of therapeutic and reporter gene expression Hum Gene Ther 15681–690. [DOI] [PMC free article] [PubMed] [Google Scholar]
- Tollefson AE, Scaria A, Hermiston TW, Ryerse JS, Wold LJ., and, Wold WS. The adenovirus death protein (E3-11.6K) is required at very late stages of infection for efficient cell lysis and release of adenovirus from infected cells. J Virol. 1996;70:2296–2306. doi: 10.1128/jvi.70.4.2296-2306.1996. [DOI] [PMC free article] [PubMed] [Google Scholar]
- He TC, Zhou S, da Costa LT, Yu J, Kinzler KW., and, Vogelstein B. A simplified system for generating recombinant adenoviruses. Proc Natl Acad Sci USA. 1998;95:2509–2514. doi: 10.1073/pnas.95.5.2509. [DOI] [PMC free article] [PubMed] [Google Scholar]
- Huyn ST, Burton JB, Sato M, Carey M, Gambhir SS., and, Wu L. A potent, imaging adenoviral vector driven by the cancer-selective mucin-1 promoter that targets breast cancer metastasis. Clin Cancer Res. 2009;15:3126–3134. doi: 10.1158/1078-0432.CCR-08-2666. [DOI] [PMC free article] [PubMed] [Google Scholar]
- Sato M, Johnson M, Zhang L, Zhang B, Le K, Gambhir SS.et al. (2003Optimization of adenoviral vectors to direct highly amplified prostate-specific expression for imaging and gene therapy Mol Ther 8726–737. [DOI] [PMC free article] [PubMed] [Google Scholar]
- Klein KA, Reiter RE, Redula J, Moradi H, Zhu XL, Brothman AR.et al. (1997Progression of metastatic human prostate cancer to androgen independence in immunodeficient SCID mice Nat Med 3402–408. [DOI] [PubMed] [Google Scholar]
- Johnson M, Huyn S, Burton J, Sato M., and, Wu L. Differential biodistribution of adenoviral vector in vivo as monitored by bioluminescence imaging and quantitative polymerase chain reaction. Hum Gene Ther. 2006;17:1262–1269. doi: 10.1089/hum.2006.17.1262. [DOI] [PubMed] [Google Scholar]
Associated Data
This section collects any data citations, data availability statements, or supplementary materials included in this article.
Supplementary Materials
Viral output/input ratio of wild-type Ad (dl309), oncolytic Ad (dl1520), and TSTA-CRAd in LNCaP cells.
LNCaP cells were infected with either dl309 (wild-type) or TSTA-CRAd at MOI = 1.