

Abstract
Objective:
Presently there is no clinically feasible imaging modality that can effectively detect cortical demyelination in patients with multiple sclerosis (MS). The objective of this study is to determine if clinically feasible magnetization transfer ratio (MTR) imaging is sensitive to cortical demyelination in MS.
Methods:
MRI were acquired in situ on 7 recently deceased patients with MS using clinically feasible sequences at 3 T, including relatively high-resolution T1-weighted and proton density–weighted images with/without a magnetization transfer pulse for calculation of MTR. The brains were rapidly removed and placed in fixative. Multiple cortical regions from each brain were immunostained for myelin proteolipid protein and classified as mostly myelinated (MMctx), mostly demyelinated (MDctx), or intermediately demyelinated (IDctx). MRIs were registered with the cortical sections so that the cortex corresponding to each cortical section could be identified, along with adjacent subcortical white matter (WM). Mean cortical MTR normalized to mean WM MTR was calculated for each cortical region. Linear mixed-effects models were used to test if mean normalized cortical MTR was significantly lower in demyelinated cortex.
Results:
We found that mean normalized cortical MTR was significantly lower in cortical tissue with any demyelination (IDctx or MDctx) compared to MMctx (demyelinated cortex: least-squares mean [LSM] = 0.797, SE = 0.007; MMctx: LSM = 0.837, SE = 0.006; p = 0.01, n = 89).
Conclusions:
This result demonstrates that clinically feasible MTR imaging is sensitive to cortical demyelination and suggests that MTR will be a useful tool to help detect MS cortical lesions in living patients with MS.
Cortical demyelinated lesions (CL) have been detected in patients with multiple sclerosis (MS) for more than 5 decades.1,2 Postmortem studies have raised the possibility that CL may be more prevalent than white matter (WM) demyelination3 and that intracortical and mixed cortical/WM lesions together may account for >50% of all MS brain lesions.4 Despite their detection on postmortem tissue, most CL are invisible on conventional MRI.4,5 The double inversion recovery sequence improves detection but does not reveal most CL.5,6
While nonquantitative imaging features low sensitivity to CL, the sensitivity of semiquantitative and quantitative MRI is unclear. Although one ex vivo imaging study performed at 1.5 T revealed that T1 and T2 relaxation rates (not magnetization transfer ratio [MTR]) are sensitive to CL,7 a separate study performed at 9.4 T found MTR and T2 relaxation rate (not T1) to be most sensitive.8
Whole-brain MTR imaging is possible on most modern magnetic resonance (MR) systems at relatively high resolution without specialized sequences (unlike T1 and T2 relaxivity maps). Due to the conflicting results regarding the sensitivity of MTR to CL, we wanted to ascertain if MTR acquired under clinically feasible conditions would be sensitive to CL. To do so, we imaged the brains of deceased patients with MS in situ on a clinical MR system using acquisitions suitable for in vivo imaging, and compared mean normalized cortical MTR (normMTRctx) values in demyelinated and normally myelinated cortex.
METHODS
Standard protocol approvals, registrations, and patient consents
These studies were approved by the Cleveland Clinic Institutional Review Board. Informed consent for participation was obtained either from the patient as an advance directive before death or from the next of kin after death.
Patients
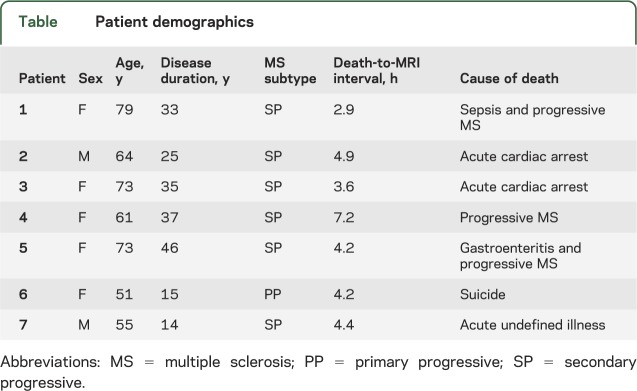
Postmortem in situ brain imaging was performed and tissue was processed as described previously.9 For this study, we analyzed brain MRI and tissue from 7 patients with MS (table).
Postmortem in situ MRI
Postmortem in situ brain MRIs (figure 1) were acquired soon after death using a 3 T MR system (Tim Trio, Siemens, Erlangen, Germany). In 6 subjects, T1-weighted (T1W) MRI were acquired with magnetization-prepared rapid acquisition gradient echo (repetition time [TR] = 1,860 msec; echo time [TE] = 2.8 msec; inversion time = 1,100 msec; flip angle = 10°; voxel size = 0.94 × 0.94 × 0.94 mm3; GRAPPA acceleration factor = 2; acquisition time = 4 minutes) and fast low-angle shot (TR = 20 msec; TE = 5 msec; flip angle = 27°; voxel size = 1 × 1 × 1 mm3; acquisition time = 9 minutes) sequences (in one subject, only FLASH was acquired). MTR was calculated from a pair of proton density–weighted gradient recalled echo volumes with/without a magnetization transfer prepulse (MTON and MTOFF: TR = 24 msec; TE = 3.81 msec; flip angle = 10°; voxel size = 1 × 1 × 1 mm3; GRAPPA acceleration factor = 2; acquisition time = 4 minutes).
Figure 1. Postmortem in situ MRI example.

Postmortem in situ MRI acquired from multiple sclerosis patient 3 in the table. (A) 3D T1-weighted fast low-angle shot; (B) 3D T1-weighted magnetization-prepared rapid gradient echo; (C) proton density–weighted 3D gradient echo without magnetization transfer pulse; (D) proton density–weighted 3D gradient echo with magnetization transfer pulse.
Registration of postmortem in situ MRI to fixed brain slices
After postmortem in situ MRI, the brain and spinal cord were removed, and one cerebral hemisphere was fixed in 4% paraformaldehyde for >9 weeks. After fixation, the hemisphere was reimaged in a custom-designed polycarbonate slicing box.9 After postfixation MRI, the brain was sliced (1 cm coronal sections) within the box and photographed. The postmortem T1W MRI was registered to the postfixation MRI using rigid-body followed by affine transformations with FLIRT10; in 4 of the cases, additional nonlinear registration was performed using FNIRT (http://www.fmrib.ox.ac.uk/fsl/fnirt/index.html). The equations of the brain slice planes (determined from MRI-visible markers on the slicing box indicating the positions of slots that guide slicing) were then used to extract the 2-dimensional postmortem MR images that corresponded to each fixed brain slice. The plane correspondence was compared with the photographs for gyral and sulcal features, and, if necessary, the equations of the planes were adjusted to achieve optimal correspondence between brain slice and postmortem MRI slice (figure 2, A and B).
Figure 2. Coregistration of postmortem in situ MRI and fixed brain slices.

(A) Photograph of a 10-mm-thick fixed brain slice from multiple sclerosis patient 2 in the table. (B) 3D intensity normalized T1-weighted coregistered to (A). (C) 3D intensity normalized proton density–weighted coregistered to (B). (D) Magnetization transfer ratio coregistered to (B).
Tissue sampling and proteolipid protein immunohis-tochemistry
Based on brain slice photographs, 89 tissue blocks sampling 6 cortical regions (frontal, parietal, occipital, temporal, insular, cingulate) were chosen for uniform, unbiased assessment. The blocks were cut (sized to fit a 22 × 40 mm2 coverslip) and sectioned at 30 μm thick using a freezing-sliding microtome. Free-floating sections were immunostained for myelin using rat antiproteolipid protein (anti-PLP, gift from Dr. Wendy Macklin) by the avidin-biotin complex procedure with diaminobenzidine tetrahydrochloride as a chromagen.11
Each PLP-stained section was examined for demyelination at 10× using a Zeiss Axiophot light microscope (Carl Zeiss MicroImaging, LLC, Thornwood, NY). The cortex was classified by an observer blinded to the MRI results as one of the following: mostly myelinated (MMctx), in which more than half of the cortex had normal PLP staining, and there were no large regions of complete demyelination (figure 3C); mostly demyelinated (MDctx), in which more than half of the cortex features little or no PLP staining extending at least 1 mm deep from the pial surface with no large regions of normal-appearing cortex (figure 3D); or intermediately demyelinated (IDctx), which may feature patches of normal-appearing cortex, demyelinated cortex, or regions of low myelin density (figure 3E). Remyelination was not assessed.
Figure 3. Examples of different classes of cortical myelination based on proteolipid protein immunostaining.
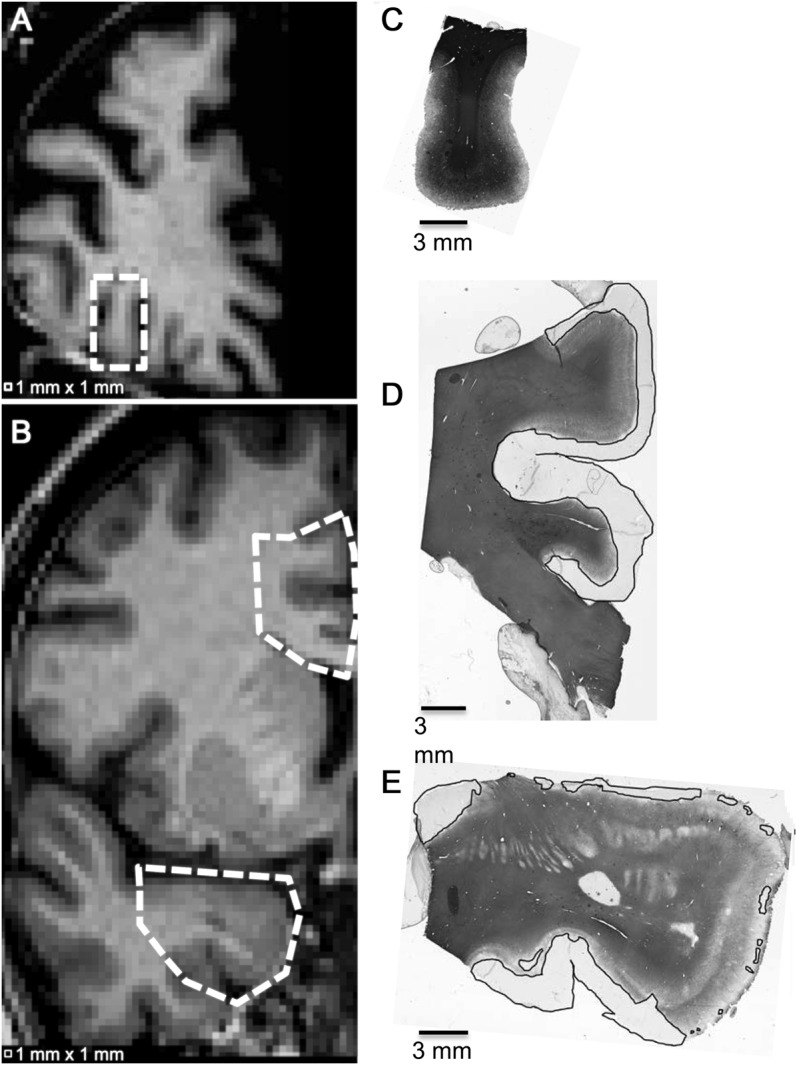
Scanned slides of 30-μm-thick cortical tissue sections immunostained for myelin using rat anti–proteolipid protein and the corresponding T1-weighted MRI slice. (A) T1-weighted MRI slice from patient 1 in the table with cortical region (C) designated by dotted box; (B) T1-weighted MRI slice from patient 6 in the table with cortical regions (D) and (E) designated by dotted polygons; (C) mostly myelinated cortex; (D) mostly demyelinated cortex; (E) intermediately demyelinated cortex. Black lines denote demyelinated cortex.
Calculating mean normalized cortical MTR
The uncorrected MTOFF and MTON were transformed to correspond with the postmortem T1W MRI. The MTR map was calculated (100 × [MTOFF − MTON]/MTOFF) and transformed to correspond with the fixed brain slices (figure 2D).
The cortex corresponding to each cortical section was manually segmented on the MRIs by an observer blinded to the immunostaining results who referred to photographs of the unstained tissue blocks; the intensity-normalized12 MTOFF was used to visually define the brain surface/CSF interface and the intensity-normalized12 T1W MRI was used to define the cortex/WM interface. Normal-appearing WM proximate to the segmented cortex was also manually segmented on the T1W MRI. This procedure was considered to be adequately unbiased as the observer was blinded to PLP staining and MTR that were compared in the statistical analyses.
For each cortical region, the mean cortical MTR (MTRctx) was calculated from the MTR values of the segmented cortex, if these values were normally distributed according to the Lilliefors or Jarque-Bera tests (MATLAB, R2009a, The Mathworks, Inc., Natick, MA). MTR values within each cortical region were presumed to be normally distributed under the assumption that the underlying tissue composition is uniform, with the exception of relatively small foci (foci much smaller than the 1 mm3 voxel volume are undetectable). If the MTR values of the segmented cortex did not satisfy either normality test, outlying values (starting with values <2.5th percentile or >97.5th percentile) were iteratively omitted until one of the tests was satisfied; the mean MTRctx was then calculated from the truncated distribution, which contained data from an average of 59 voxels/region. Outliers were eliminated because we believed that they corresponded to isolated voxels of normal or demyelinated WM, CSF, partial volume, or artifact (the exact composition of the outlier voxels cannot be determined from the PLP-stained slides, since the exact positioning of the voxels with respect to the slide is not known and the slides display only 0.03-mm-thick tissue sections, whereas the MRI is sensitive to 1-mm-thick tissue). The median value of the percentage of voxels eliminated was 0%/region; 85% of regions had no voxels eliminated. For the regions where voxels were eliminated, median value of the percentage of voxels eliminated was 10%/region.
To standardize the mean MTRctx values over different cortical regions and subjects, we normalized the mean MTRctx of each region by dividing by the subject's overall mean WM MTR of all selected normal-appearing WM voxels within the subject's brain. The percent coefficient of variation of the overall mean WM MTR of the subjects was 2.8%, suggesting that it is a relatively stable value and suitable to use for normalization.
Statistics
A linear mixed-effects model (JMP, Release 8, SAS Institute Inc., Cary, NC) within the “Fit Model” platform fitted with the restricted maximum likelihood method was used to test for a significant effect of cortical myelin status classification on mean normMTRctx. Mean normMTRctx was the response variable, myelin status classification was a fixed model effect, and subject within myelin status classification was a random effect. To determine if mean normMTRctx is significantly lower in demyelinated cortex, myelin status was coded “0” for MMctx and “1” for IDctx and MDctx. To determine if mean normMTRctx is significantly different for each myelin status class, each class was coded separately and a Tukey-Kramer honestly significant difference (Tukey HSD) test was used to determine if comparisons of myelin status classes yielded significant differences in mean normMTRctx.
RESULTS
MRI and histopathology were performed on the brains of 7 patients with MS (see table): mean age = 65 years (SD = 10 years); mean disease duration = 29 years (SD = 12 years); mean death-to-MRI interval = 4 hours (SD = 1 hour). Eighty-nine tissue blocks were examined (mean = 13 blocks/brain, range = 9–19 blocks/brain). Based on PLP immunostaining, 45 tissue sections were classified as MMctx, 17 were classified as MDctx, and 27 were classified as IDctx. All CL observed were subpial or intracortical. All patients had cortical regions that featured some demyelination (IDctx or MDctx). In one of the patients, all of the sections featured some demyelination.
Table.
Patient demographics
Using the linear mixed-effects model that combined IDctx and MDctx into one group, we found that mean normMTRctx was significantly lower in demyelinated cortex (IDctx or MDctx) compared to MMctx (demyelinated cortex: least-squares mean [LSM] = 0.797, SE = 0.007; MMctx: LSM = 0.837, SE = 0.006; p = 0.01, n = 89) (figure 4). The 2 lowest outlying MMctx values likely result from cortex/CSF partial-volume effect, since the corresponding regions were situated in locations of pronounced cortical convolution (superior frontal cortex in the most anterior coronal brain slice and inferior occipital cortex).
Figure 4. Mean normalized cortical magnetization transfer ratio.

Mean normalized magnetization transfer ratio (MTR) in cortical tissue with any demyelination (intermediately demyelinated [IDctx] or mostly demyelinated [MDctx]) is significantly lower when compared to mostly myelinated (MMctx). Demyelinated cortex: least-squares mean = 0.797, SE = 0.007; MMctx: least-squares mean = 0.837, SE = 0.006; p = 0.01, n = 89.
The linear mixed-effects model analysis that considered each myelin status class separately revealed a significant effect of myelin status classification on mean normMTRctx (p = 0.01). The Tukey HSD test indicated that mean normMTRctx was significantly different in MDctx compared to MMctx, but the mean normMTRctx was not significantly different in IDctx when it was compared to MDctx or MMctx.
Testing the myelin status classification reproducibility by repeating the classification after ∼104 days revealed the following: 1% of the sections were reclassified from MDctx to IDctx, 2% were reclassified from IDctx to MMctx, and there were no significant changes to the results of the statistical tests. Testing the cortical segmentation reproducibility by repeating the segmentations for 16 regions (2–3 regions/subject; 8 MMctx regions; 8 MDctx regions) after ∼145 days revealed the following: the mean Dice coefficient of similarity was 0.82 and mean normMTRctx was significantly lower in demyelinated compared to myelinated cortex for both sets of segmentations.
DISCUSSION
The imaging sequences for MTR calculation are available for routine clinical scanning on most modern MR systems and have been used for in vivo assessment of the cortex in patients with MS. Cortical MTR abnormalities have been observed in patients with relapsing-remitting MS, patients with primary progressive MS, and cognitively impaired patients with benign MS.13–16 In primary progressive MS, MTRctx reductions were associated with disability.15 In these in vivo studies, the pathologic substrate of reduced MTR is unknown. Postmortem MRI/histopathology studies offer the opportunity to understand the pathology underlying in vivo imaging-related observations. It is often suggested that decreased MTRctx in patients with MS arises due to CL; however, postmortem MRI/histopathology correlation studies have not agreed on the sensitivity of MTR to CL. In this study we wanted to ascertain whether MTR acquired within a clinical setting would be sensitive to cortical demyelination. To do so, we imaged postmortem brains in situ on a 3 T clinical MR system using clinically feasible imaging sequences, including conventional MRI and MRI for MTR calculation, and compared mean normMTRctx values in demyelinated and normally myelinated cortex. We found that mean normMTRctx was significantly lower in demyelinated cortex compared to MMctx.
The presence of CL in patients with MS has been recognized for more than 5 decades.1,2 In this study we found that all patients had cortical regions with some demyelination, which is consistent with early findings.2 The high percentage of affected patients in this study may be due to the fact that all of the patients had been diagnosed with progressive MS, which has been shown to feature a higher percentage of demyelinated cortex compared to acute MS.17
Despite the prevalence of CL on immunostained postmortem brain, the vast majority of these lesions are not visible on typical clinically feasible MRI. The findings of previous studies that MTR at 1.5 T with a voxel size of 5 mm3 was not sensitive to cortical demyelination,7 but was sensitive at 9.4 T,8 suggest that a field strength >1.5 T and a voxel size <5 mm3 may be necessary to detect cortical lesions. Our results support this notion, as we demonstrated that MTR at 3 T with a voxel size of 1 mm3 reveals significant differences between demyelinated and normal-appearing cortex. The benefit of higher field is likely due to the improvement in signal-to-noise and contrast-to-noise of the MTR.18
T1 and T2 relaxation rates have been found to be significantly different between demyelinated and normally myelinated cortex on images obtained from ex vivo brain slices at 1.5 T7; at 9.4 T, the significant effect was found for T2 but not for T1.8 We could not evaluate the sensitivity of T1 and T2 relaxivity to CL, as the sequences are not standard for clinical use and not included in our MRI protocol. In contrast to quantitative T1 and T2 mapping, the sequences for MTR calculation used in this study can be directly transitioned to clinical practice without need for pulse sequence programing.
At 3 T, we found a difference of 5% between mean normMTRctx of MMctx and demyelinated cortex. Previously reported differences between myelinated and demyelinated MTRctx in ex vivo tissues were 5% at 1.5 T7 and 19% at 9.4 T.8 There are a few reasons why we expect a smaller percentage difference between myelinated and demyelinated MTRctx in our study compared to the 9.4 T study: 1) the mean normMTRctx was calculated over the entire PLP-immunostained cortical region (containing both normal and demyelinated cortex) and not only in small purely myelinated or demyelinated regions; 2) the contrast-to-noise ratio at 3 T is expected to be lower than at 9.4 T; 3) the 1 mm3 voxel size in this study is much larger (more susceptible to partial-volume effects) than the voxel size used at 9.4 T.
Although we found that mean normMTRctx was significantly different in MDctx compared to MMctx, there was no significant difference when IDctx was compared to either MDctx or MMctx. The lack of sensitivity of mean normMTRctx to IDctx may be due to inherent limitations of the comparison between MRI-derived and histopathologically derived metrics under our experimental conditions. The MRI-derived metric, mean normMTRctx, represents an average over 1 mm3 cortical voxels within a 1-mm-thick region, while the histopathologically derived metric, MMctx/IDctx/MDctx, represents the cortical myelin status classification of a 0.03-mm-thick section most closely corresponding to the MRI. In cortical regions that are uniformly normally myelinated or demyelinated, it is reasonable to expect that mean normMTRctx would accurately reflect the myelin status classification, which is supported by the significant differences in mean normMTRctx that we observed when comparing MMctx and MDctx. The within-class mean normMTRctx dispersion likely arises due to myelin density heterogeneity within the 1-mm-thick regions (e.g., some cortical regions may be mostly demyelinated in the 0.03-mm-thick PLP-stained tissue section but mostly normally myelinated in the rest of the MRI-detected 1-mm-thick region, resulting in a relatively high mean normMTRctx in a region classified as demyelinated). It is also reasonable to expect that the mean normMTRctx calculated over many 1-mm3 voxels may not be sensitive to relatively small foci of demyelinated cortex observed on sections classified as IDctx.
In the absence of tissue pathology, MTR values may vary over different cortical regions within a single brain and between different brains. One of the largest contributors to MTR variability is B1 field non uniformity.18–20 To minimize the effect of MTR variations between different brains on MTR sensitivity to cortical demyelination, we normalized the mean MTRctx of each region using the subject's overall mean WM MTR. The mean normMTRctx in MMctx spanned the range of values inferred from published values.21 The normalization may be expected to decrease the sensitivity to cortical demyelination if the mean WM MTR was low in subjects with many regions of cortical demyelination and high in subjects with many regions of normally myelinated cortex. We did not find large variations in mean WM MTR between subjects.
Although our results demonstrate that clinically feasible MTR is sensitive to cortical demyelination, there are limitations to this study. Our results are based on postmortem imaging, which is free of motion artifacts that may be observed on in vivo MRI and may be expected to affect the sensitivity of any imaging modality to pathology. The brains examined in this study were from patients with MS with a relatively long disease course, and therefore we are not able to determine if the mean normMTRctx is also significantly lower in early-stage MS CL that may feature inflammation.22 In this study, as in other studies of the sensitivity of semiquantitative or quantitative MRI to CL, we classified myelin status rather than quantifying the degree of demyelination. This approach precludes estimation of the correlation between mean normMTRctx and degree of cortical demyelination, which would have been compromised by the MRI-derived metric sampling a thicker tissue region than the PLP-stained tissue section. In spite of this weakness, we were able to demonstrate that mean normMTRctx is sensitive to cortical demyelination, perhaps even when as little as 2.5% of the cortical area is demyelinated, which we found in a simplistic analysis in which the relative amount of demyelinated cortex was estimated from the PLP-immunostained slides. We recognize that mean normMTRctx alone cannot be used to prospectively identify CL, and suggest that prospective detection of CL may be achieved using a quantitative multimodal approach that includes MTRctx, since visual assessment of any single MRI modality has not proven to be adequately sensitive. Future postmortem 3 T MRI/histopathology studies should include acquisitions to calculate T1 and T2 relaxation rates in addition to MTR, and additional immunostaining should be performed to evaluate both sensitivity and specificity to CL. An important confounding factor of using MTR to evaluate WM demyelination is inflammation, and CL have been shown to exhibit little inflammation; therefore we may presume that low MTRctx may be relatively specific to cortical demyelination. The above-mentioned limitations do not weaken our finding that clinically feasible MTR is sensitive to cortical demyelination. We propose that advanced image processing methods can be developed to automatically detect abnormally low MTR measurements consistent with CL, enabling the quantification of cortical lesion load and distribution in living patients with MS.
ACKNOWLEDGMENT
The authors thank the Cleveland Clinic Mellen Center clinical personnel and Lifebanc, Cleveland, OH, for assistance in identifying MS tissue donors, Cynthia Schwanger, RN, for coordinating the MS tissue donation program, and John Cowan and Derrek Tew for performing the MRI.
GLOSSARY
- CL
cortical demyelinated lesions
- HSD
honestly significant difference
- IDctx
intermediately demyelinated
- LSM
least-squares mean
- MDctx
mostly demyelinated
- MMctx
mostly myelinated
- MR
magnetic resonance
- MS
multiple sclerosis
- MTR
magnetization transfer ratio
- MTRctx
mean cortical magnetization transfer ratio
- normMTRctx
normalized cortical magnetization transfer ratio
- PLP
proteolipid protein
- TE
echo time
- TR
repetition time
- T1W
T1-weighted
- WM
white matter
AUTHOR CONTRIBUTIONS
J.T. Chen: conceptualization of the study, analysis and interpretation of the data, drafting and revising the manuscript. K. Easley: collection of data, analysis of data, and revising the manuscript. C. Schneider: analysis of data and revising the manuscript. K. Nakamura: analysis of data and revising the manuscript. G.J. Kidd: technical help, analysis and interpretation of the data. A. Chang: collection of data and analysis of the data. S.M. Staugaitis: collection of data and revising the manuscript. Robert J. Fox: donor recruitment and revising the manuscript. Elizabeth Fisher: supervision of personnel, interpretation of the data, and revising the manuscript. Douglas L. Arnold: revising the manuscript. Bruce D. Trapp: supervision of personnel and revising the manuscript.
STUDY FUNDING
Supported in part by NIH NINDS P50 NS38667 and CIHR (MOP #84367).
DISCLOSURE
J.T.-H. Chen is a consultant for NeuroRx Research and has received funding by the Multiple Sclerosis Scientific Research Foundation. K. Easley, C. Schneider, and K. Nakamura report no disclosures. G.J. Kidd is paid key personnel from several NIH grants at the Cleveland Clinic, and a scientific advisor for Renovo Neural Inc. A. Chang reports no disclosures. S.M. Staugaitis has received research support from the NIH and the National Multiple Sclerosis Society. R.J. Fox has received speaker honoraria from Biogen Idec and Teva Pharmaceuticals; has served as a consultant for Avanir, Biogen Idec, Genentech, Inc., and Novartis; has served on clinical trial advisory committees for Biogen Idec; and has received/receives research support from the National Multiple Sclerosis Society. E. Fisher has received speaker honoraria from Biogen Idec, Genzyme, and Teva Pharmaceuticals; has served as a consultant for Biogen Idec and Genzyme; and has received/receives research support from Biogen Idec, Genzyme, and the NIH. D.L. Arnold has served on advisory boards or data monitoring committees for Bayer-Schering, Biogen Idec, Genentech, Genzyme, Roche, and Teva. He has received speaker honoraria or funding for travel from Bayer Healthcare, Biogen Idec, EMD Serono, Genentech, Sanofi Aventis, Serono Symposia International, and Teva, holds stock in and received remuneration from NeuroRx Research, and has received research support from Bayer Healthcare, the Canadian Institutes for Health Research, the MS Society of Canada, and its Foundation. B.D. Trapp serves as chief scientific officer of Renovo Neural; has received payment for lectures including service on speakers bureaus from Teva, Serono, and Biogen Idec; is funded by grants from the NIH, State of Ohio, and Pfizer; and received research support from the National Multiple Sclerosis Society. Go to Neurology.org for full disclosures.
REFERENCES
- 1.Brownell B, Hughes JT. The distribution of plaques in the cerebrum in multiple sclerosis. J Neurol Neurosurg Psychiatry 1962;25:315–320 [DOI] [PMC free article] [PubMed] [Google Scholar]
- 2.Lumsden CE. The neuropathology of multiple sclerosis. In: Winken PJ, Bruyn GW, ed. Handbook of Clinical Neurology. Amsterdam: Elsevier; 1970:174–227 [Google Scholar]
- 3.Bo L, Vedeler CA, Nyland HI, Trapp BD, Mork SJ. Subpial demyelination in the cerebral cortex of multiple sclerosis patients. J Neuropathol Exp Neurol 2003;62:723–732 [DOI] [PubMed] [Google Scholar]
- 4.Geurts JJ, Bo L, Pouwels PJ, Castelijns JA, Polman CH, Barkhof F. Cortical lesions in multiple sclerosis: combined postmortem MR imaging and histopathology. AJNR Am J Neuroradiol 2005;26:572–577 [PMC free article] [PubMed] [Google Scholar]
- 5.Simon B, Schmidt S, Lukas C, et al. Improved in vivo detection of cortical lesions in multiple sclerosis using double inversion recovery MR imaging at 3 Tesla. Eur Radiol 2010;20:1675–1683 [DOI] [PMC free article] [PubMed] [Google Scholar]
- 6.Seewann A, Kooi EJ, Roosendaal SD, et al. Postmortem verification of MS cortical lesion detection with 3D DIR. Neurology 2012;78:302–308 [DOI] [PubMed] [Google Scholar]
- 7.Seewann A, Vrenken H, Kooi EJ, et al. Imaging the tip of the iceberg: visualization of cortical lesions in multiple sclerosis. Mult Scler 2011;17:1202–1210 [DOI] [PubMed] [Google Scholar]
- 8.Schmierer K, Parkes HG, So PW, et al. High field (9.4 Tesla) magnetic resonance imaging of cortical grey matter lesions in multiple sclerosis. Brain 2010;133:858–867 [DOI] [PubMed] [Google Scholar]
- 9.Fisher E, Chang A, Fox RJ, et al. Imaging correlates of axonal swelling in chronic multiple sclerosis brains. Ann Neurol 2007;62:219–228 [DOI] [PubMed] [Google Scholar]
- 10.Jenkinson M, Smith S. A global optimisation method for robust affine registration of brain images. Med Image Anal 2001;5:143–156 [DOI] [PubMed] [Google Scholar]
- 11.Trapp BD, Peterson J, Ransohoff RM, Rudick R, Mork S, Bo L. Axonal transection in the lesions of multiple sclerosis. N Engl J Med 1998;338:278–285 [DOI] [PubMed] [Google Scholar]
- 12.Sled JG, Zijdenbos AP, Evans AC. A nonparametric method for automatic correction of intensity nonuniformity in MRI data. IEEE Trans Med Imaging 1998;17:87–97 [DOI] [PubMed] [Google Scholar]
- 13.Codella M, Rocca MA, Colombo B, Martinelli-Boneschi F, Comi G, Filippi M. Cerebral grey matter pathology and fatigue in patients with multiple sclerosis: a preliminary study. J Neurol Sci 2002;194:71–74 [DOI] [PubMed] [Google Scholar]
- 14.De Stefano N, Battaglini M, Stromillo ML, et al. Brain damage as detected by magnetization transfer imaging is less pronounced in benign than in early relapsing multiple sclerosis. Brain 2006;129:2008–2016 [DOI] [PubMed] [Google Scholar]
- 15.Khaleeli Z, Cercignani M, Audoin B, Ciccarelli O, Miller DH, Thompson AJ. Localized grey matter damage in early primary progressive multiple sclerosis contributes to disability. Neuroimage 2007;37:253–261 [DOI] [PubMed] [Google Scholar]
- 16.Amato MP, Portaccio E, Stromillo ML, et al. Cognitive assessment and quantitative magnetic resonance metrics can help to identify benign multiple sclerosis. Neurology 2008;71:632–638 [DOI] [PubMed] [Google Scholar]
- 17.Kutzelnigg A, Lucchinetti CF, Stadelmann C, et al. Cortical demyelination and diffuse white matter injury in multiple sclerosis. Brain 2005;128:2705–2712 [DOI] [PubMed] [Google Scholar]
- 18.Cercignani M, Symms MR, Ron M, Barker GJ. 3D MTR measurement: from 1.5 T to 3.0 T. Neuroimage 2006;31:181–186 [DOI] [PubMed] [Google Scholar]
- 19.Finelli DA. Magnetization transfer effects on T1-weighted three-dimensional gradient-echo MR images of a phantom simulating enhancing brain lesions. AJNR Am J Neuroradiol 1997;18:147–159 [PMC free article] [PubMed] [Google Scholar]
- 20.Tofts PS, Steens SC, Cercignani M, et al. Sources of variation in multi-centre brain MTR histogram studies: body-coil transmission eliminates inter-centre differences. MAGMA 2006;19:209–222 [DOI] [PubMed] [Google Scholar]
- 21.Vrenken H, Pouwels PJ, Ropele S, et al. Magnetization transfer ratio measurement in multiple sclerosis normal-appearing brain tissue: limited differences with controls but relationships with clinical and MR measures of disease. Mult Scler 2007;13:708–716 [DOI] [PubMed] [Google Scholar]
- 22.Lucchinetti CF, Popescu BF, Bunyan RF, et al. Inflammatory cortical demyelination in early multiple sclerosis. N Engl J Med 2011;365:2188–2197 [DOI] [PMC free article] [PubMed] [Google Scholar]