

Abstract
Objectives:
Many multiple sclerosis (MS) lesions develop around small veins that are surrounded by perivenular inflammatory cells, but whether veins in the brains of people with MS are smaller or larger than similar veins in healthy volunteers or people with other neurologic diseases remains unknown. This question can be addressed by high-resolution, high-field-strength MRI.
Methods:
In a cross-sectional study performed on a standard 3 T clinical scanner, we acquired whole-brain T2*-weighted images with 0.55 mm isotropic voxels and reconstructed the courses of deep and superficial veins within the white matter. We compared the apparent diameters of intralesional and perilesional veins to those of extralesional MS veins, veins in healthy volunteers, and veins in individuals with other neurologic diseases.
Results:
We studied veins in 19 MS cases, 9 healthy volunteers, and 8 individuals with other neurologic diseases, analyzing a total of 349 veins. The mean diameter of intralesional veins (0.76 ± 0.14 mm) was smaller than that of perilesional (1.18 ± 0.13 mm; p < 0.001) and extralesional (1.13 ± 0.14 mm; p < 0.001) veins, regardless of lesion size and location. Perilesional and extralesional MS veins were larger than non-MS veins (0.94 ± 0.14 mm; p < 0.001), and intralesional MS veins were smaller (p < 0.001).
Conclusions:
The small apparent size of intralesional MS veins may reflect compression by the perivascular inflammatory cuff within active lesions or hardening of the vascular wall in chronic lesions. The finding that extralesional veins are larger than similar veins in non-MS lesions may result from diffuse disease-related processes.
Most multiple sclerosis (MS) lesions in the cerebral white matter expand outward from small, inflamed veins,1,2 although demyelinated lesions not centered by small veins have been reported.3 The walls of veins in MS plaques are denser and heavily cellular, and perivenular fibrosis can be seen in the lesion center.1 In chronic lesions, due to fibrosis and collagen deposition in the vein wall and perivascular space, venous caliber is significantly narrowed.1,4
MRI venography at standard clinical field strength can demonstrate the perivenous distribution of MS lesions in vivo.5 The ability to detect veins improves greatly as field strength increases,6 because the degree to which deoxyhemoglobin in venous blood reduces signal intensity on T2*-weighted images becomes magnified.7 At 7 T, a central vessel can be identified in 87% of visible white matter lesions.8
An important open question is whether veins centering lesions are macroscopically different from veins outside lesions and from similar veins in healthy people and individuals with other neurologic diseases. One possibility is that the histopathologically observed perivenular cuffing and wall thickening induce macroscopic changes in intralesional veins. It is also possible, however, that such changes on MRI occur diffusely, affecting many if not all parenchymal veins in the MS brain; in this case, the changes would not be directly related to lesions, and their pathophysiologic significance would be less clear.
METHODS
Standard protocol approvals, registrations, and patient consents
We collected data for this study between June and December 2011 under 2 institutional review board–approved natural history protocols at the NIH Clinical Center. We obtained written, informed consent from all participants in the study.
Participants
We scanned 19 MS cases. As controls, we scanned 8 cases of other neurologic diseases and 9 healthy volunteers. See Results for more demographic details. These cases were evaluated under a diagnostic research protocol that involved clinical, laboratory (serum and CSF), and neuroimaging evaluation. Scans of sequential patients seen under this protocol during the study period were selected for analysis, without a preplanned sample size calculation, after reviewing the image quality to ensure that data were analyzable and interpretable. Experienced MS clinicians determined disability according to the Expanded Disability Status Scale (EDSS)9 and obtained clinical data. The diagnosis of MS followed the 2010 McDonald criteria.10 The healthy volunteers were specifically recruited for this study.
MRI protocol
We collected data on a 3 T Philips Achieva scanner, using the body coil for transmission and the manufacturer's 8-channel, phased-array head coil for reception. We acquired sagittal 3D whole-brain T2-weighted fluid-attenuated inversion recovery (FLAIR) images (VISTA sequence; repetition time [TR] = 4,800 msec; echo time [TE] = 376 msec; inversion time [TI] = 1,600 msec; flip angle [FA] = 90 deg; 1 mm isotropic voxels; acquisition time = 6 minutes) and sagittal 3D whole-brain T1-weighted images (magnetization-prepared rapid gradient echo [MPRAGE] sequence; TR = 6.8 msec; TE = 3.12 msec; TI = 900 msec; FA = 9 deg; 1 mm isotropic voxels; acquisition time = 5 minutes). Using a segmented (multishot) echoplanar imaging sequence, we acquired sagittal 3D whole-brain T2*-weighted images during injection of gadolinium-DTPA (Magnevist, Bayer) at a standard dose of 0.1 mmol/kg, which was delivered by power injector over 1 minute (TR = 51 msec; TE = 28 msec; FA = 10 deg; echoplanar imaging factor = 15; 0.55 mm isotropic voxels; acquisition time = 4 minutes).
Image postprocessing
On the T2*-weighted images, a trained image analyst, unaware of the final diagnosis, identified focal supratentorial white matter lesions that surrounded clear central veins and recorded the presence or absence of those lesions on T1-MPRAGE and T2-FLAIR images. Confluent lesions in which a clear central vein could not be identified, smaller lesions that did not contain a clearly visible central vein, and lesions not detected on all 3 sequence types were excluded. Veins in the infratentorial area were excluded because of image artifacts that limited visualization of associated lesions. Veins surrounded by lesions were classified as intralesional. The portions of the same veins just outside the lesion area were classified as perilesional, and MS veins with no associated lesions as extralesional. In the non-MS cases (healthy volunteers and cases of other neurologic diseases), randomly selected similar supratentorial veins were analyzed. The location of each vein was labeled juxtacortical, subcortical, or periventricular.
Specialized image analysis software, part of Vue PACS (version 11.1; Carestream Health), enabled identification and reconstruction of the courses of intraparenchymal veins in the acquisition plane as well as the 2 orthogonal planes. The image analyst placed sequential seed points at the center of each vein in the plane where it was displayed in cross-section (figure 1). The software then aligned the seed points and displayed the veins in a single, reconstructed plane, in which any surrounding lesions were also shown along their long axes. The resulting images, now consisting of a single set of linked images for each vein that were dissociated from the original scans, were exported to the OsiriX system (64-bit, version 3.9). Intralesional, perilesional, and extralesional apparent diameters were then measured in at least 2 different locations along the vein's course in order to reduce variability. One measurement was taken at the point where the diameter appeared largest and the second where it appeared smallest; the 2 measurements were then averaged. Where appropriate, measurements of cross-sectional lesion diameter and intralesional vein length were derived from the same images.
Figure 1. Process of reconstructing an intraparenchymal vein.
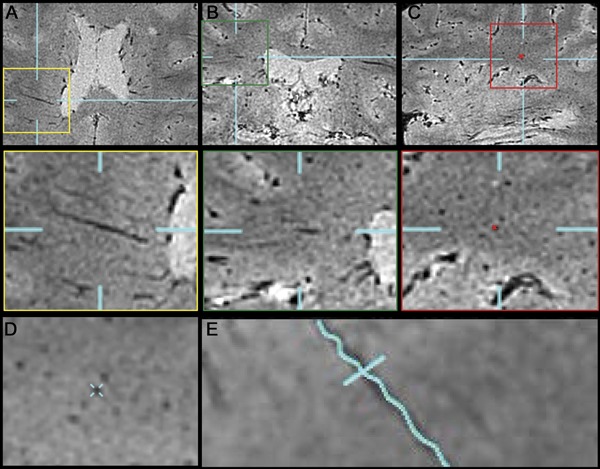
Veins were tracked in 3 orthogonal planes: axial (A), coronal (B), and sagittal (C). Seed points were left in each slice where the vein was seen in cross-section (C). These seed points were used to reconstruct the vein in a single plane (E). Reformations perpendicular to the new plane were also obtained (D).
Statistical analysis
We report results as mean ± overall SD. Because we sampled more than one vein per case, we used mixed-effects multivariable linear regression models to compare vein diameters across disease type, sex, treatment status, and location, and to estimate the strength of associations with age, disease duration, and EDSS. Statistics were performed in Stata version 9.2 (StataCorp LP).
RESULTS
Participants
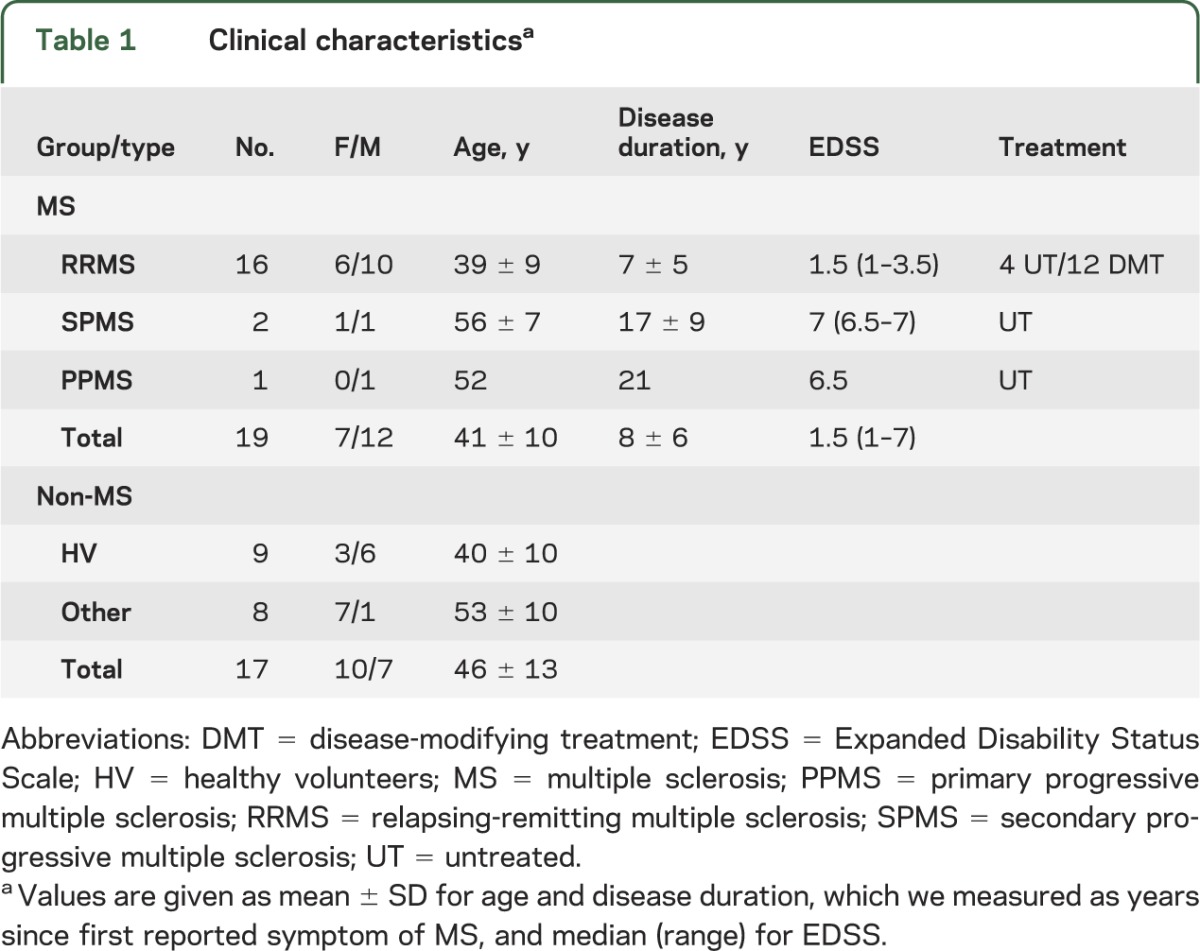
Of the 19 MS cases, 16 had relapsing-remitting MS, 2 secondary progressive MS, and 1 primary progressive MS (table 1). We also acquired MRI data from 8 age-matched individuals who presented with symptoms possibly due to MS but who were determined to have another etiology for their symptoms. These included 5 cases with evidence of inflammation (1 case of systemic lupus erythematosus, 3 cases of human T-cell lymphotrophic virus–associated myelopathy/tropical spastic paraparesis, and 1 case that did not receive a specific diagnosis) and 3 cases without evidence of inflammation (2 cases of suspected small-vessel disease and 1 case of cerebellar ataxia). Additionally, we studied 9 age-matched healthy volunteers. Patients with MS were taking a variety of disease-modifying therapies; 6 were untreated at the time of evaluation.
Table 1.
Clinical characteristicsa
Vein characteristics
We analyzed 125 unique veins in the MS cases (3–14 veins per case); examples are shown in figure 2. We made paired intralesional and perilesional measurements on 72 veins. For 14 lesions, we were unable to make a reliable measurement of vein diameter both inside and just outside the lesion; these lesions contributed 13 intralesional and 1 perilesional diameter. We also measured the diameters of 39 extralesional veins. We analyzed a total of 224 veins from the non-MS group (between 10 and 20 veins per case). In MS cases, 131 observed diameters were from periventricular veins (52 intralesional, 48 perilesional, 31 extralesional), 48 from subcortical veins (23 intralesional, 18 perilesional, 7 extralesional), and 18 from juxtacortical veins (10 intralesional, 7 perilesional, 1 extralesional). In non-MS cases, 108 veins were periventricular, 58 subcortical, and 58 juxtacortical.
Figure 2. Examples of reconstructed veins.
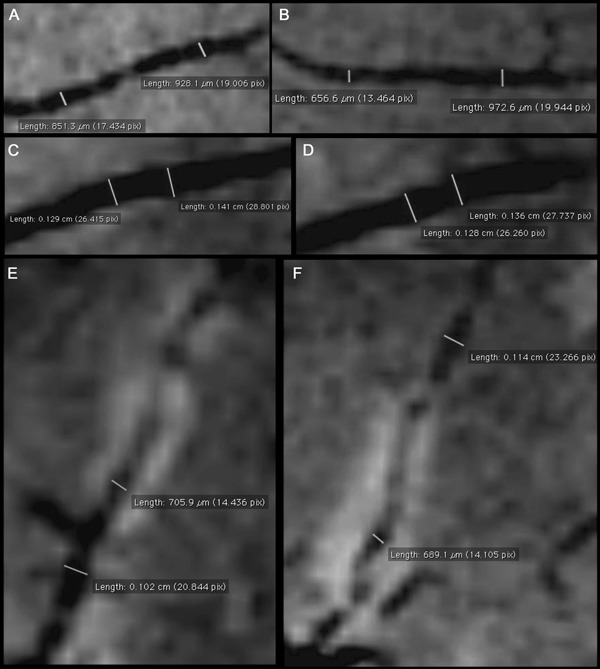
Reconstructed veins are displayed along their long axes. Veins in healthy volunteers (A, B) were smaller than similarly located extralesional (C, D) and perilesional multiple sclerosis (MS) veins. Intralesional MS veins (E, F) were smaller than perilesional and extralesional veins in the same cases and smaller than non-MS veins.
Vein diameter
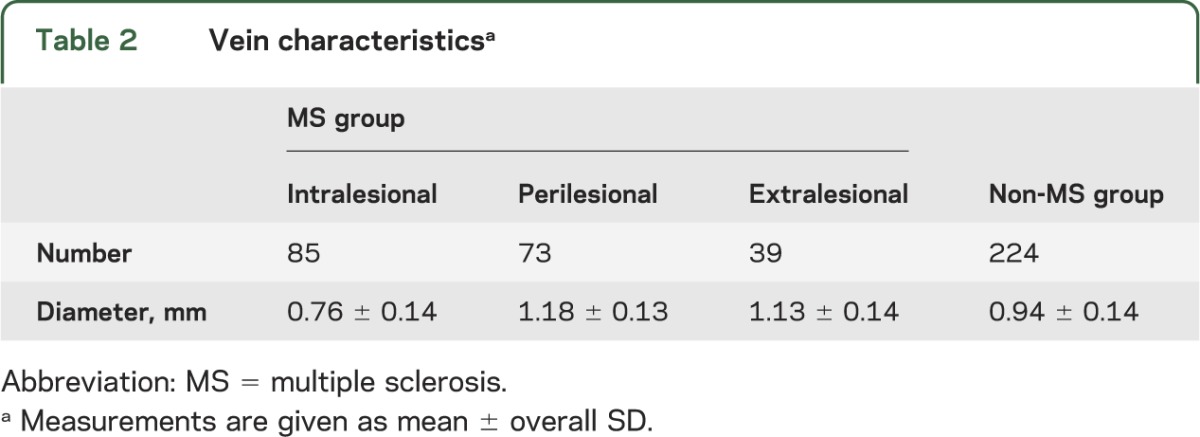
The mean apparent diameter of intralesional veins (0.76 ± 0.14 mm), regardless of location and lesion, was smaller than the mean apparent diameter of extralesional veins (1.13 ± 0.14 mm; p < 0.001) (table 2). Intralesional MS veins were on average 0.42 ± 0.16 mm (p < 0.001), or 36%, smaller than their associated perilesional veins (1.18 ± 0.13 mm). There was no difference in the diameter of veins in healthy volunteers (0.94 ± 0.10 mm) vs other neurologic diseases (0.94 ± 0.17 mm), so data were pooled across these groups.
Table 2.
Vein characteristicsa
For extralesional veins, we found no differences in lesion size by sex or brain area. In MS cases, there was no association between vein diameter and treatment status, EDSS, disease duration, or disease stage (relapsing vs progressive). In healthy volunteers, we found that extralesional veins were smaller in older people (decrease of 0.047 mm per decade, p < 0.001). We found a similar but nonsignificant trend in extralesional MS veins (decrease of 0.029 mm per decade, p = 0.16), so we adjusted for age in all MS vs non-MS comparisons. In particular, there was no effect of age on intralesional (p = 0.44) or perilesional (p = 0.14) vein diameter in MS.
MS vs non-MS veins
The mean apparent diameter of veins in the pooled non-MS cases (0.94 ± 0.14 mm) was smaller than the mean apparent diameter of extralesional (p < 0.001) and perilesional MS veins (p < 0.001). The apparent diameter of non-MS veins was larger than the apparent diameter of intralesional MS veins (p < 0.001). All comparisons were adjusted for age.
Enhancing vs nonenhancing lesions
One case presented 7 contrast-enhancing lesions and was rescanned the following week. Four lesions no longer enhanced, 2 were still slightly enhancing, and 1 was no longer detected. The mean apparent diameter of the veins within these 6 lesions did not change in this short time interval, regardless of whether the lesion persistently enhanced.
Effect of gadolinium on apparent vein diameter
In 1 case, we acquired data prior to, during, and 15 minutes after gadolinium injection. On the scans performed during gadolinium injection, the apparent diameter of a representative deep medullary vein was 1.00 mm, whereas on the scans performed before and after gadolinium injection, the apparent diameter of the same vein was 0.83 mm.
DISCUSSION
In white matter, most MS lesions appear to wrap themselves around the small medullary veins that drain into the deep and superficial venous pathways.1,11 Histologically, veins at the center of MS lesions are inflamed,12 particularly early in the disease.2 Inflammatory cells and fibrinous exudates are present within and around the tunica adventitia in both active lesions and normally myelinated white matter.13 In chronic lesions, there is evidence of repair, including collagenous thickening of the venous wall as well as intimal hyperplasia and narrowing of the vessel caliber.1,13 Fibrosis also occurs within the perivascular space, between the endothelium and the glia limitans, in both active lesions and, more abundantly, inactive lesions.4 It has been reported that T2*-weighted imaging is sensitive to perivascular inflammation, at least in animal models of MS.14
This study was designed to obtain data on the size of the superficial and deep medullary veins in the brains of patients with MS and matched controls based on in vivo imaging data. It was not intended to be a comprehensive accounting of vein size across a spectrum of neurologic diseases (although the imaging techniques reported here could in principle be used to perform such a study), nor a definitive study of the mechanisms behind venous narrowing or enlargement, nor a comparison of the number of visible veins in patients with MS vs controls. The fact that fewer veins were analyzed in the patients with MS relates to the exclusion of veins surrounded by confluent lesions, where it is impossible to identify the vein around which the lesion initially formed. Overall, the results indicate that in MS, intralesional veins (veins surrounded by lesions) in vivo are smaller than perilesional and extralesional veins in the same brains, and than similar veins in non-MS cases. In addition, the same perilesional and extralesional MS veins are larger than non-MS veins.
We consider 2 plausible and not mutually exclusive explanations for the finding of intralesional venous narrowing in MS. First, as described above, perivascular inflammation forms a cuff around these veins; intralesional MS veins may thus be externally compressed. Second, chronic changes in the venous wall, such as fibrosis, may reduce vascular compliance and thereby narrow the veins within lesions. Note that the extent of vein narrowing may be underestimated in our data, since we obtained images during gadolinium injection. The reduced T2* relaxation time induced by intravascular gadolinium manifests as apparent enlargement of the hypointense veins due to the “blooming” effect.
Despite the fact that prior studies using T2*-weighted venography, performed in the absence of contrast injection, demonstrated that veins in the periventricular white matter appear less conspicuous in MS than in healthy people,7,15 we found that on our gadolinium-enhanced venograms, perilesional and extralesional MS veins appeared significantly larger than veins from healthy volunteers and cases of other neurologic diseases. This finding is more difficult to explain than the finding of luminal narrowing within lesions. One possible explanation for this finding is simply ex vacuo dilatation of extralesional veins due to overall brain volume loss. Brain atrophy occurs early in the disease,16 and the rate of volume loss appears to increase later on, particularly in gray matter.17,18
Another possible explanation for our finding of enlarged perilesional and extralesional MS veins is metabolic rather than structural, as apparent venous size on T2*-weighted images will increase with the amount of deoxyhemoglobin in the blood. In this scenario, and assuming that arterial blood in MS is normally oxygenated, our results would suggest that early in MS there is a diffuse increase in cerebral metabolism, perhaps associated with inflammation, which results in greater oxygen extraction from blood. However, the dominant determinant of apparent venous size in our data is probably intravascular gadolinium rather than deoxyhemoglobin, which makes it difficult to draw any conclusions regarding metabolism from our results.
An additional possible explanation for extralesional venous enlargement in MS is subtle gadolinium extravasation from an abnormally permeable blood–brain barrier. Studies have reported leakage of serum proteins outside discrete areas of demyelination and inflammation,19,20 as well as subtle blood–brain barrier disruption in nonenhancing lesions.21 However, 3 factors render this explanation unlikely: 1) intralesional veins, where this effect should be most prominent, were narrowed rather than enlarged; 2) veins within actively enhancing lesions, where the blood–brain barrier is most widely open, did not further narrow once the contrast enhancement resolved; and 3) images were acquired during injection of gadolinium, so subtle leakage, which is likely to be slow, should only have a minor effect on apparent diameter.
Recent reports that MS is associated with chronically impaired venous drainage from the brain and spinal cord, a state that has been termed chronic cerebrospinal vein insufficiency (CCSVI),22,23 might, if true, explain the apparent enlargement in the compliant intracranial veins. However, the CCSVI hypothesis—whether CCSVI is even present in the first place and, even more, whether it has any bearing on disease pathogenesis or clinical course—remains highly controversial,24 and we do not believe that our results can be taken as evidence for or against it.
Finally, the enlargement of extralesional MS veins may be related to decreased vascular tone, which must be profound to more than offset the age-related vein narrowing that is consistent with observations outside the brain25 and that we observed in this study. Veins are typically considered capacitance vessels, and although they can constrict or dilate passively, their luminal size can also be modulated by a variety of mechanisms. For example, sympathetic activity can constrict veins,26 and abnormal autonomic function can therefore result in venous dilatation in diseases where autonomic function is altered, such as MS.27 In addition, the relationship between enlarged veins and impaired cerebral arterial blood flow, which has been described in several studies in MS,28–30 may require consideration. It is worth noting that medullary veins in the brain can dilate in the setting of acute ischemia,31 and cerebrovascular reactivity can be modulated by changes in the fraction of inspired carbon dioxide,32 but whether such mechanisms play a role in MS is unknown.
The primary limitation of this study is the lack of histopathology data and physiologic measurements that would be necessary to test all of the possible explanations for our findings. However, it is worth noting that vein size can change postmortem due to exsanguination and fixation artifacts, so it is not clear that histopathology would provide a suitable gold standard for comparison with the in vivo imaging data. Another limitation is that most of the MS cases analyzed here were relatively early in the disease course, and as a result we cannot draw conclusions about the natural history of vein size in MS. An additional limitation is that the control group was heterogeneous, including both healthy volunteers and patients with other neurologic disease. Despite this, we were unable to detect differences between the various control participants, which we regard as evidence in support of a specific effect of MS on vein size. Finally, although the image analyst was blinded to the final diagnosis, as MS has a characteristic appearance on MRI, the blinding may have been incomplete.
From a technical point of view, an important issue to consider is that the apparent size of veins may be overestimated in T2*-weighted images, particularly images obtained during gadolinium infusion, and can be affected by factors other than their actual size. These factors include distortions and blurring related to the specific type of data acquisition used here, differences in the intravascular concentration of contrast agent at the time of scanning, and the orientation of vessels relative to the main magnetic field. Additionally, partial volume averaging with surrounding hyperintense lesions might reduce apparent venous size. Although these considerations may affect the precise sizes of measured veins, we believe that they should not affect the main conclusions of this work. To demonstrate this, we analyzed a representative sample of veins in conventional (non–echoplanar imaging) gradient echo images, which have fewer distortions. We also sampled veins that traversed (but did not center) non-MS lesions. Finally, we examined whether there were persistent differences between MS and non-MS veins if we used data acquired 10–15 minutes after gadolinium injection, where the apparent vein size is determined more by intrinsic factors than by the effect of gadolinium itself. In all cases, the overall results presented here were unchanged.
Overall, our findings demonstrate that intralesional veins are apparently narrower than other MS veins as well as veins from healthy volunteers and other neurologic diseases. We believe that this narrowing may reflect compression by the perivascular inflammatory cuff and thickening of the venous wall and perivascular space. Future research may determine whether vein size can be used as a marker of disease status or response to treatment.
Acknowledgment
The authors thank Irene Cortese, Joan Ohayon, Kaylan Fenton, Helen Griffith, Rosalind Ebinger, Melissa Goldstein, and Leila Panossian of the Neuroimmunology Branch clinical group for recruiting and expertly evaluating the study participants and for coordinating the scans; the NIH Clinical Center MRI technologists for performing the scans; Roger Stone for database assistance; and Rita Devine and Tony Casco of the National Institute of Neurological Disorders and Stroke Summer Internship Program for supporting Ms. de Alwis's work. They also thank David Solomon for discussions.
Glossary
- CCSVI
chronic cerebrospinal vein insufficiency
- EDSS
Expanded Disability Status Scale
- FA
flip angle
- FLAIR
fluid-attenuated inversion recovery
- MPRAGE
magnetization-prepared rapid gradient echo
- MS
multiple sclerosis
- TE
echo time
- TI
inversion time
- TR
repetition time
AUTHOR CONTRIBUTIONS
Dr. Gaitán drafted the manuscript, conceptualized/designed the study, and analyzed/interpreted data. Ms. de Alwis revised the manuscript and analyzed/interpreted data. Dr. Sati revised the manuscript, analyzed/interpreted data, and acquired data. Dr. Nair revised the manuscript and analyzed/interpreted data. Dr. Reich drafted the manuscript, conceptualized/designed the study, analyzed/interpreted data, performed statistical analysis, supervised/coordinated the study, and obtained funding.
STUDY FUNDING
Supported by the Intramural Research Program of the National Institute of Neurological Disorders of Stroke, NIH.
DISCLOSURE
The authors report no disclosures relevant to the manuscript. Go to Neurology.org for full disclosures.
REFERENCES
- 1.Charcot JM. Histologie de la Sclérose en Plaques. Paris: Imprimerie L. Pupart-Davyl; 1869 [Google Scholar]
- 2.Adams CW. The onset and progression of the lesion in multiple sclerosis. J Neurol Sci 1975;25:165–182 [DOI] [PubMed] [Google Scholar]
- 3.Lucchinetti C, Bruck W, Parisi J, Scheithauer B, Rodriguez M, Lassmann H. Heterogeneity of multiple sclerosis lesions: implications for the pathogenesis of demyelination. Ann Neurol 2000;47:707–717 [DOI] [PubMed] [Google Scholar]
- 4.Mohan H, Krumbholz M, Sharma R, et al. Extracellular matrix in multiple sclerosis lesions: fibrillar collagens, biglycan and decorin are upregulated and associated with infiltrating immune cells. Brain Pathol 2010;20:966–975 [DOI] [PMC free article] [PubMed] [Google Scholar]
- 5.Tan IL, van Schijndel RA, Pouwels PJ, et al. MR venography of multiple sclerosis. AJNR Am J Neuroradiol 2000;21:1039–1042 [PMC free article] [PubMed] [Google Scholar]
- 6.Tallantyre EC, Brookes MJ, Dixon JE, Morgan PS, Evangelou N, Morris PG. Demonstrating the perivascular distribution of MS lesions in vivo with 7-Tesla MRI. Neurology 2008;70:2076–2078 [DOI] [PubMed] [Google Scholar]
- 7.Ge Y, Zohrabian VM, Osa EO, et al. Diminished visibility of cerebral venous vasculature in multiple sclerosis by susceptibility-weighted imaging at 3.0 Tesla. J Magn Reson Imaging 2009;29:1190–1194 [DOI] [PMC free article] [PubMed] [Google Scholar]
- 8.Tallantyre EC, Morgan PS, Dixon JE, et al. A comparison of 3T and 7T in the detection of small parenchymal veins within MS lesions. Invest Radiol 2009;44:491–494 [DOI] [PubMed] [Google Scholar]
- 9.Kurtzke JF. Rating neurologic impairment in multiple sclerosis: an expanded disability status scale (EDSS). Neurology 1983;33:1444–1452 [DOI] [PubMed] [Google Scholar]
- 10.Polman CH, Reingold SC, Banwell B, et al. Diagnostic criteria for multiple sclerosis: 2010 revisions to the McDonald criteria. Ann Neurol 2011;69:292–302 [DOI] [PMC free article] [PubMed] [Google Scholar]
- 11.Fog T. On the vessel-plaque relationships in the brain in multiple sclerosis. Acta Neurol Scand Suppl 1964;40(suppl 10):9–15 [PubMed] [Google Scholar]
- 12.Dawson JW. The histology of disseminated sclerosis. Trans Roy Soc Edin 1916;50:74–75 [Google Scholar]
- 13.Adams CW, Poston RN, Buk SJ, Sidhu YS, Vipond H. Inflammatory vasculitis in multiple sclerosis. J Neurol Sci 1985;69:269–283 [DOI] [PubMed] [Google Scholar]
- 14.Gareau PJ, Wymore AC, Cofer GP, Johnson GA. Imaging inflammation: direct visualization of perivascular cuffing in EAE by magnetic resonance microscopy. J Magn Reson Imaging 2002;16:28–36 [DOI] [PubMed] [Google Scholar]
- 15.Zivadinov R, Poloni GU, Marr K, et al. Decreased brain venous vasculature visibility on susceptibility-weighted imaging venography in patients with multiple sclerosis is related to chronic cerebrospinal venous insufficiency. BMC Neurol 2011;11:128. [DOI] [PMC free article] [PubMed] [Google Scholar]
- 16.Chard DT, Griffin CM, Parker GJ, Kapoor R, Thompson AJ, Miller DH. Brain atrophy in clinically early relapsing-remitting multiple sclerosis. Brain 2002;125:327–337 [DOI] [PubMed] [Google Scholar]
- 17.Fisher E, Lee JC, Nakamura K, Rudick RA. Gray matter atrophy in multiple sclerosis: a longitudinal study. Ann Neurol 2008;64:255–265 [DOI] [PubMed] [Google Scholar]
- 18.Tedeschi G, Lavorgna L, Russo P, et al. Brain atrophy and lesion load in a large population of patients with multiple sclerosis. Neurology 2005;65:280–285 [DOI] [PubMed] [Google Scholar]
- 19.Hochmeister S, Grundtner R, Bauer J, et al. Dysferlin is a new marker for leaky brain blood vessels in multiple sclerosis. J Neuropathol Exp Neurol 2006;65:855–865 [DOI] [PubMed] [Google Scholar]
- 20.Lassmann H. The pathologic substrate of magnetic resonance alterations in multiple sclerosis. Neuroimaging Clin N Am 2008;18:563–576, ix [DOI] [PubMed] [Google Scholar]
- 21.Soon D, Tozer DJ, Altmann DR, Tofts PS, Miller DH. Quantification of subtle blood-brain barrier disruption in non-enhancing lesions in multiple sclerosis: a study of disease and lesion subtypes. Mult Scler 2007;13:884–894 [DOI] [PubMed] [Google Scholar]
- 22.Zamboni P, Galeotti R, Menegatti E, et al. Chronic cerebrospinal venous insufficiency in patients with multiple sclerosis. J Neurol Neurosurg Psychiatry 2009;80:392–399 [DOI] [PMC free article] [PubMed] [Google Scholar]
- 23.Zamboni P, Galeotti R. The chronic cerebrospinal venous insufficiency syndrome. Phlebology 2010;25:269–279 [DOI] [PubMed] [Google Scholar]
- 24.Filippi M, Rocca MA, Barkhof F, et al. Multiple sclerosis and chronic cerebrospinal venous insufficiency: the neuroimaging perspective. AJNR Am J Neuroradiol 2011;32:424–427 [DOI] [PMC free article] [PubMed] [Google Scholar]
- 25.Greaney JL, Farquhar WB. Why do veins stiffen with advancing age? J Appl Physiol 2011;110:11–12 [DOI] [PubMed] [Google Scholar]
- 26.Hainsworth R. Vascular capacitance: its control and importance. Rev Physiol Biochem Pharmacol 1986;105:101–173 [DOI] [PubMed] [Google Scholar]
- 27.Flachenecker P. Autonomic dysfunction in Guillain-Barré syndrome and multiple sclerosis. J Neurol 2007;254(suppl 2):II96– II–101. [DOI] [PubMed] [Google Scholar]
- 28.Ge Y, Law M, Johnson G, et al. Dynamic susceptibility contrast perfusion MR imaging of multiple sclerosis lesions: characterizing hemodynamic impairment and inflammatory activity. AJNR Am J Neuroradiol 2005;26:1539–1547 [PMC free article] [PubMed] [Google Scholar]
- 29.Wuerfel J, Paul F, Zipp F. Cerebral blood perfusion changes in multiple sclerosis. J Neurol Sci 2007;259:16–20 [DOI] [PubMed] [Google Scholar]
- 30.De Keyser J, Steen C, Mostert JP, Koch MW. Hypoperfusion of the cerebral white matter in multiple sclerosis: possible mechanisms and pathophysiological significance. J Cereb Blood Flow Metab 2008;28:1645–1651 [DOI] [PubMed] [Google Scholar]
- 31.Rosso C, Belleville M, Pires C, et al. Clinical usefulness of the visibility of the transcerebral veins at 3T on T2*-weighted sequence in acute stroke patients. Eur J Radiol 2012;81:1282–1287 [DOI] [PubMed] [Google Scholar]
- 32.Bright MG, Donahue MJ, Duyn JH, Jezzard P, Bulte DP. The effect of basal vasodilation on hypercapnic and hypocapnic reactivity measured using magnetic resonance imaging. J Cereb Blood Flow Metab 2011;31:426–438 [DOI] [PMC free article] [PubMed] [Google Scholar]