

ABSTRACT
Objective:
To determine whether 4 genetic variants in the fat mass and obesity associated gene (FTO) identified in genome-wide association studies of diabetes and obesity are associated with cognitive change in midlife in the Atherosclerosis Risk in Communities (ARIC) Study.
Methods:
ARIC is a prospective cohort study of the development of atherosclerosis in 15,792 individuals aged 45 to 64 years at baseline from 1986 to 1989. FTO is highly expressed in human fetal and adult brain, and a single nucleotide polymorphism in FTO has previously been associated with reduced brain volume in cognitively normal subjects. Since a relationship between brain atrophy and diminished cognitive function has been demonstrated in ARIC participants, general linear models were used to evaluate the association between 6-year change in scores on 3 neuropsychological tests and FTO genotype.
Results:
In a sample of 8,364 white and 2,083 African American men and women with no clinical history of stroke, significantly greater mean change in performance on the Delayed Word Recall Test was associated with 2 of 4 FTO single nucleotide polymorphisms examined (rs9939609, rs805136, rs17817449, and rs1421085) in whites but not in African Americans (p ≤ 0.002). The association of the FTO polymorphisms with cognitive change was independent of potential confounding clinical and demographic variables including age, gender, education, diabetes, hypertension, and body mass index.
Conclusions:
Further studies will be needed to clarify the biological mechanisms and genetic pathways through which variants in FTO can increase susceptibility to decline in verbal memory detectable in middle-aged, community-dwelling adults.
Genetic variants in the fat mass and obesity associated gene (FTO), located on human chromosome 16q12.2, have been reproducibly associated with body mass index (BMI)1–3 and diabetes1,4,5 in genome-wide association studies in children and adults of European descent, with variable replication in other ethnicities.6 FTO is ubiquitously expressed in human tissues including the fetal and adult brain with high levels found in the hypothalamus, cerebellar cortex, temporal lobe, and parietal lobe.1,2 The minor alleles of 4 single nucleotide polymorphisms (SNPs) in FTO (rs9939609, rs8050136, rs17817449, and rs1421085) were associated with risk of diabetes and obesity in white participants in the Atherosclerosis Risk in Communities (ARIC) Study, whereas only rs1421085 was a determinant of obesity susceptibility in African Americans and was moderately protective against diabetes.7 In accordance with previous evidence that individuals who are obese showed differences in brain structure compared with subjects whose weight was in the normal range, significantly decreased brain volume in the frontal lobes and occipital lobes has recently been reported for carriers of the FTO rs3751812 T allele in a study of 206 cognitively normal subjects assessed by MRI.8–10 Since brain atrophy has previously been observed in individuals with lower cognitive performance in a number of population-based epidemiologic studies,11,12 the association between the same 4 SNPs spanning a 19.6-kb region within intron 1 and variation in cognitive status and cognitive decline was analyzed in a sample of 8,364 white and 2,083 African American participants in the ARIC study.
METHODS
ARIC study
The ARIC study is a prospective, longitudinal, biracial investigation of the development of atherosclerosis and its clinical sequelae in which 15,792 individuals aged 45 to 64 years from 4 communities in the United States were enrolled at baseline from 1986 to 1989. A detailed description of the ARIC study has previously been reported.13 Four examinations have been performed at 3-year intervals, and subjects are contacted annually to update their medical histories between examinations. Individuals were not included in this analysis if they were neither African American nor white (n = 48), were African Americans from the Minnesota or Maryland field centers because of the small numbers of individuals recruited from these sites (n = 55), restricted use of their DNA (n = 45), had a history of physician-diagnosed stroke before visit 2 (n = 271), or did not attend the visit 2 clinical examination (n = 1,431). Additional exclusions were made for incident stroke verified by ARIC clinicians from medical records through visit 4 (n =104), missing cognitive data for all 3 neuropsychological tests at either visit 2 or visit 4 (n = 2,906), missing genotype data (n = 461), or for missing information concerning years of education completed (n = 24).
Standard protocol approvals, registrations, and patient consents
Written informed consent was provided by all study participants, and the study design and methods were approved by institutional review boards at the collaborating medical centers.
Genotype determination
Genotyping of the FTO and APOE polymorphisms using DNA isolated from peripheral blood lymphocytes was performed using the TaqMan system (Applied Biosystems, Foster City, CA). Sequences for primers and probes are available upon request. Allele detection was performed using the ABI Prism 7700 Sequence Detection System (Applied Biosystems). The genotype call rate was determined before exclusion of individuals from the analysis and was 94.2% for rs9939609, 94.4% for rs17817449, 94.2% for rs8050136, and 94.3% for rs1421085. After the application of all exclusion criteria, the proportion of missing genotype data in the final study sample ranged from 1.4% for rs17817449 to 1.7% for rs8050136. The genotyping success rate was also assessed by analyzing the concordance between genotypes for pairs of blind duplicates included with the DNA samples from the study participants. Kappa coefficients,14 indices of the percent agreement between measurements corrected for agreement occurring by chance, were calculated for each SNP and were 0.97 for rs9939608 and 0.98 for rs17817449, rs8050136, and rs1421085.
Cognitive tests
Cognitive function was assessed using 3 neuropsychological tests at the second (1990–1992) and fourth (1996–1998) clinical examinations: 1) the Delayed Word Recall Test (DWRT) is a test of verbal learning and recent memory in which the participant is required to use each of 10 common nouns in a sentence. After a 5-minute delay in which another test is given, the participant is asked to recall the 10 nouns. The DWRT score is the number of correct words recalled (range 0–10). A 6-month test-retest reliability of 0.75 was reported in 26 normal elderly adults15; 2) the Digit Symbol Substitution Test (DSST) is a subtest of the Wechsler Adult Intelligence Scale–Revised involving timed translation of numbers to symbols using a key with paired symbols and digits.16 The test measures psychomotor performance, and is relatively unaffected by intellectual ability, learning, or memory.17 The total number of correct translations within 90 seconds determines the score (range 0–93). The correlation coefficient for test-retest reliability over 2 to 5 weeks is 0.82 in 45- to 54-year-old adults16; and 3) the Word Fluency Test (WFT) is a measure of executive function. In 3 separate 1-minute trials, the subject is asked to generate as many words as possible beginning with the letters F, A, and S.17 The score is the combined total of correct words produced. Test-retest reliability is 0.74 for up to 5 years in older adults.18 The tests were administered by trained interviewers in a standardized order and were given in a single session. The examination sessions were monitored by tape recorder and a sample of sessions was evaluated to confirm that there were no systematic differences in mean test scores obtained by different interviewers. Six-year change in cognitive function was analyzed as the difference between the test score obtained at the later of the 2 clinic visits and the test score obtained at the earlier examination for each neuropsychological test.
Clinical and laboratory measurements
The clinical and laboratory measurements used for this study were assessed during the second clinical examination (visit 2, 1990–1992) with the exception of education, which was evaluated at the baseline examination (visit 1, 1987–1989). Highest level of education attained (≤11 years; 12–16 years; >17 years) was included as a covariate in regression models and coded as an additive categorical variable. Plasma total cholesterol and triglycerides were measured by enzymatic methods, and low-density lipoprotein cholesterol was calculated.19–21 High-density lipoprotein cholesterol was measured after dextran-magnesium precipitation of non–high-density lipoprotein cholesterol.22 Hypercholesterolemia was defined as low-density lipoprotein cholesterol ≥130 mg/dL (3.36 mmol/L).23 Blood pressure was measured 3 times while seated using a random-zero sphygmomanometer and the last 2 measurements were averaged for analysis. Hypertension was defined by diastolic blood pressure of ≥90 mm Hg, systolic blood pressure of ≥140 mm Hg, or use of antihypertensive medication. Fasting serum glucose was measured using a standard hexokinase method on a Coulter DACOS chemistry analyzer (Coulter Instruments, Fullerton, CA). The prevalence of diabetes was defined using a fasting glucose level >126 mg/dL (6.99 mmol/L), a nonfasting glucose level >200 mg/dL (11.10 mmol/L), and/or self-reported physician diagnosis or treatment for diabetes. Body weight and other anthropometric variables were measured by trained technicians according to standardized protocols. BMI was calculated as weight in kilograms/(height in meters)2. Waist-to-hip ratio (WHR) was calculated as waist girth in centimeters/hip girth in centimeters. Information on cigarette smoking and alcohol use was obtained using an interviewer-administered questionnaire and status was classified as current, former, or never.
Statistical analysis
All statistical analyses were performed using Stata 9 software (StataCorp, College Station, TX). Hardy-Weinberg equilibrium was tested using a χ2 goodness-of-fit test for all individuals in each racial group. The proportions, means, and standard deviations were calculated for cardiovascular risk factors for individuals categorized by FTO genotype. Comparisons were performed using χ2 tests for categorical variables and t tests for continuous variables. General linear models were used to assess mean differences in cognitive change among groups of individuals categorized by FTO genotype assuming an additive genetic model and adjusting for age, gender, and educational level. Tests of interaction were conducted by including main effects for each FTO polymorphism and measurements of body size in the general linear models, and introducing a multiplicative 2-way interaction term for gene by anthropometric measurement. Multivariable logistic regression was used to estimate the risk of being in the top decile of score change compared with being in the other 9 deciles combined for each of the cognitive tests. Linkage disequilibrium was estimated using Haploview version 4.2.24 The Bonferroni correction was used to adjust for multiple comparisons; a p value <0.002 was considered statistically significant for all tests (α level = 0.05/4 FTO variants × change in scores for 3 neurocognitive tests × 2 racial groups). The results of the statistical analyses are reported separately by self-reported racial group.
RESULTS
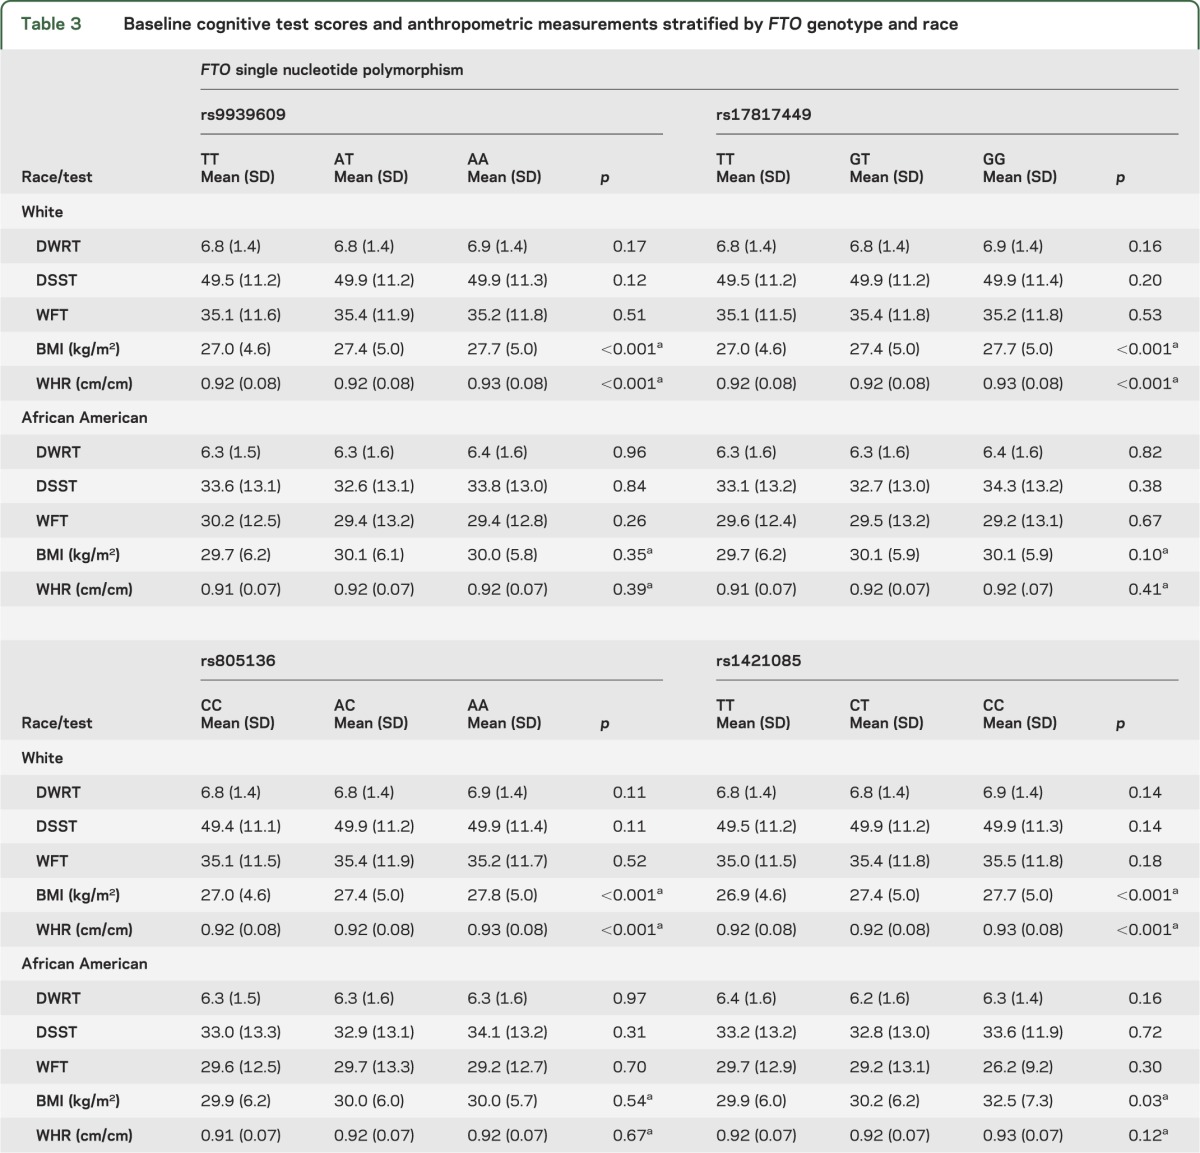
The allele and genotype frequencies for 4 FTO SNPs were in accordance with Hardy-Weinberg expectation for whites and African Americans and did not vary by decade of life (all p > 0.15) (table 1). All of the FTO polymorphisms were highly correlated in whites (r2 > 0.94) whereas there was weaker linkage disequilibrium between the SNPs in African Americans (table e-1 on the Neurology® Web site at www.neurology.org). A description of the study sample at baseline stratified by race, or race and FTO genotype, is displayed in tables 2 and 3, respectively. For white participants, mean BMI and WHR varied by rs9939609 genotype, with similar results found for rs17817449, rs8050136, and rs1421085. For African Americans, a significant difference in mean BMI with genotype was seen only for rs1421085 (p = 0.03) as was previously reported.7 When cognitive status as assessed by scores on 3 neuropsychological tests was analyzed at baseline, there was no significant difference in mean test scores by FTO genotype for either white or African American ARIC study participants (table 3).
Table 1.
FTO genotype and allele frequencies in the ARIC study
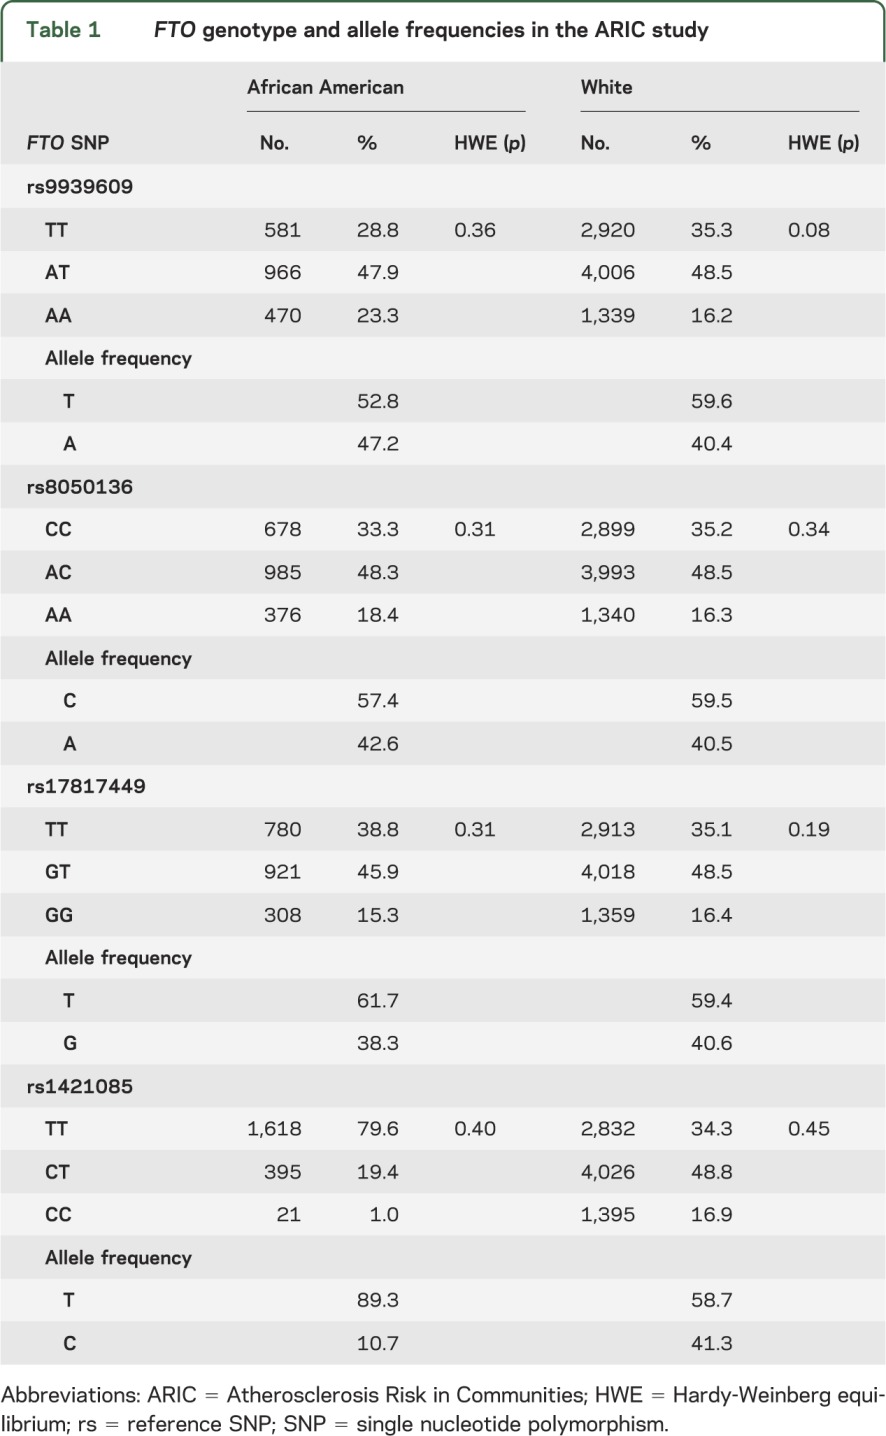
Table 2.
Clinical and demographic characteristics of the ARIC study (1990–1992)
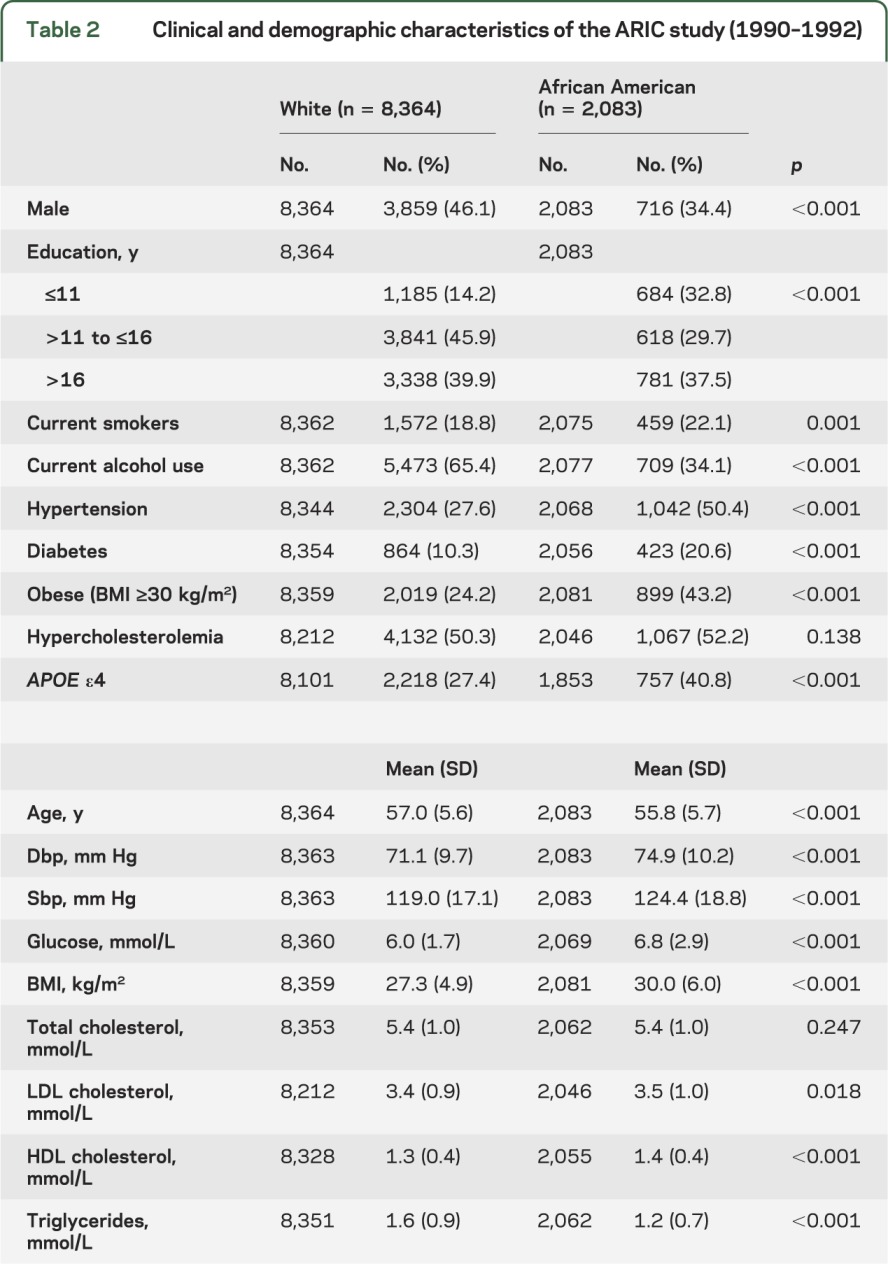
Table 3.
Baseline cognitive test scores and anthropometric measurements stratified by FTO genotype and race
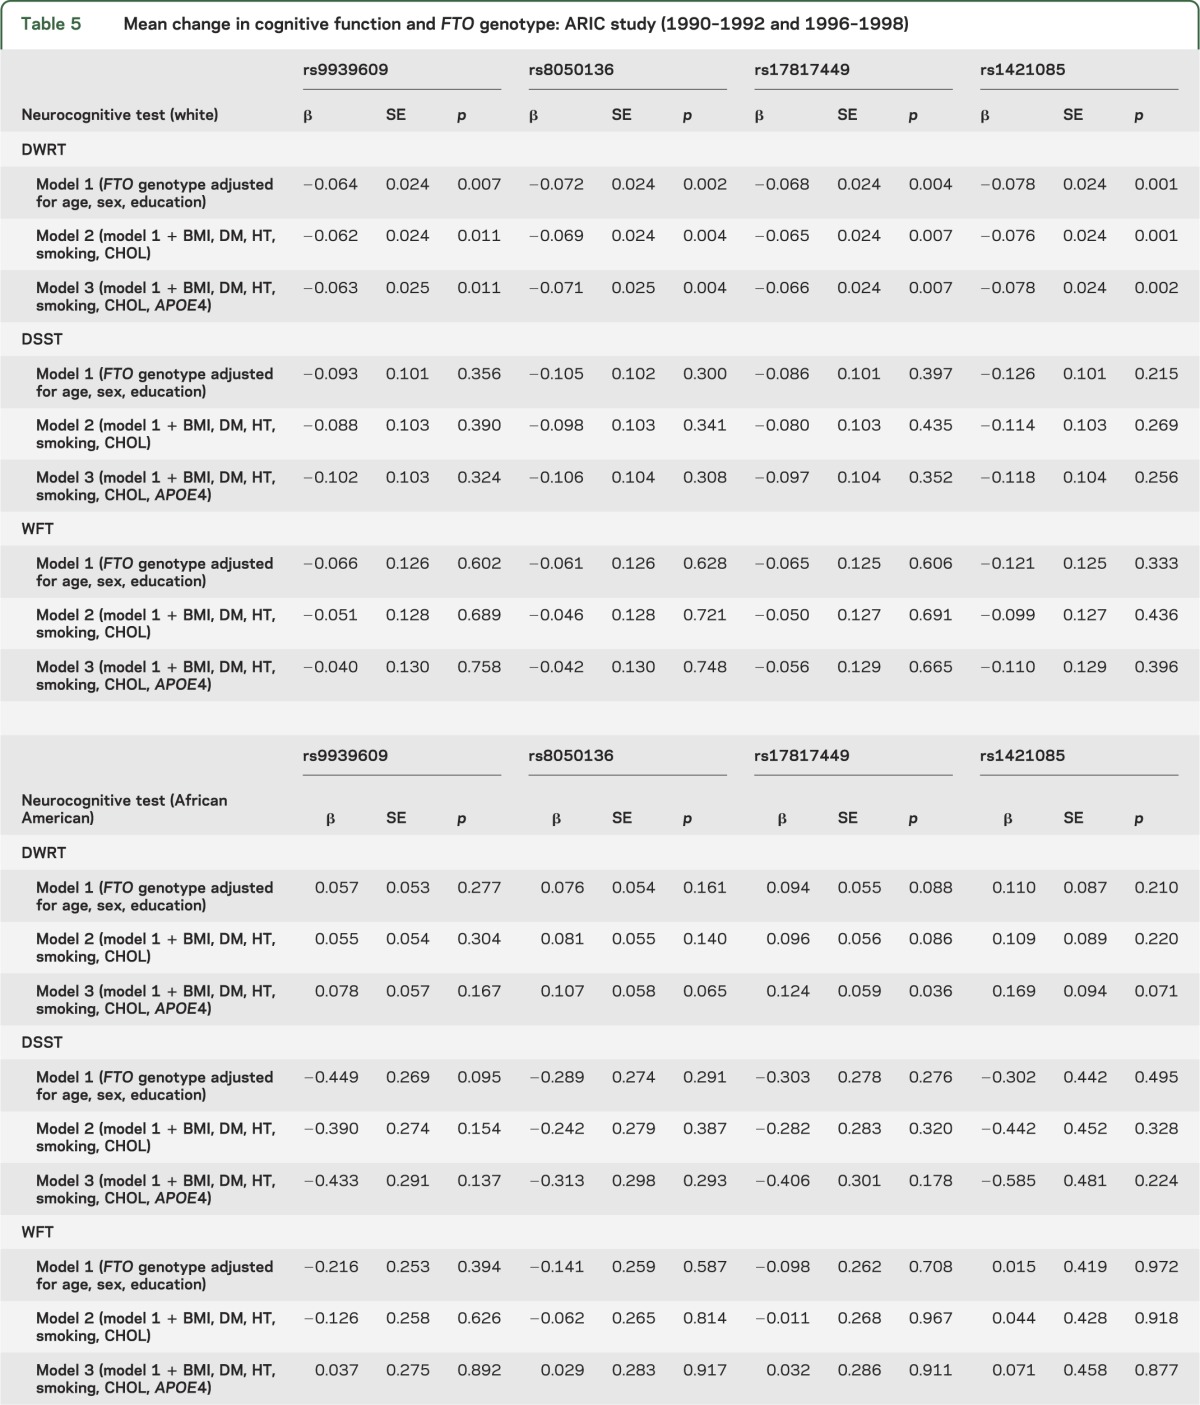
In the primary analyses of the association of cognitive change and FTO sequence variation adjusted for age, gender, and years of education, there was a significant difference found in whites for mean 6-year change in DWRT scores between individuals classified on the basis of genotype for 2 of the FTO SNPs (rs8050136 and rs1421085, p ≤ 0.002) using general linear models for analysis of covariance (tables 4 and 5). However, no significant variation among FTO genotypes was observed for mean 6-year change in DWRT scores for African American study participants, and there was no association between FTO genotype and 6-year change in scores detected for the DSST or the WFT for either racial group. When change in cognitive function over a 6-year period was analyzed further by adjusting for potential confounding variables including diabetes case status, hypertension case status, cigarette smoking, hypercholesterolemia, APOE ε4 carrier status, and BMI (table 5),25 the association between cognitive change as measured by scores on the DWRT and FTO genotype appeared to be independent of the risk factors examined for white study participants. When interaction terms were included in the models, there was no evidence for gene by BMI or gene by WHR interaction for any of the FTO sequence variants (all p > 0.3). Similarly, mean change in test scores for the DWRT was significantly associated with all 2-, 3-, and 4-locus haplotypes in whites but not with any of the FTO marker combinations in African Americans (table e-1). In an exploratory analysis, the association between measures of brain volume and FTO genotype was evaluated in a subset of participants who underwent a cerebral MRI examination in 2004–2006, but no significant relationship was observed (table e-2).
Table 4.
Six-year change in neurocognitive test scores stratified by FTO genotype and race: ARIC study (1990–1992 and 1996–1998)
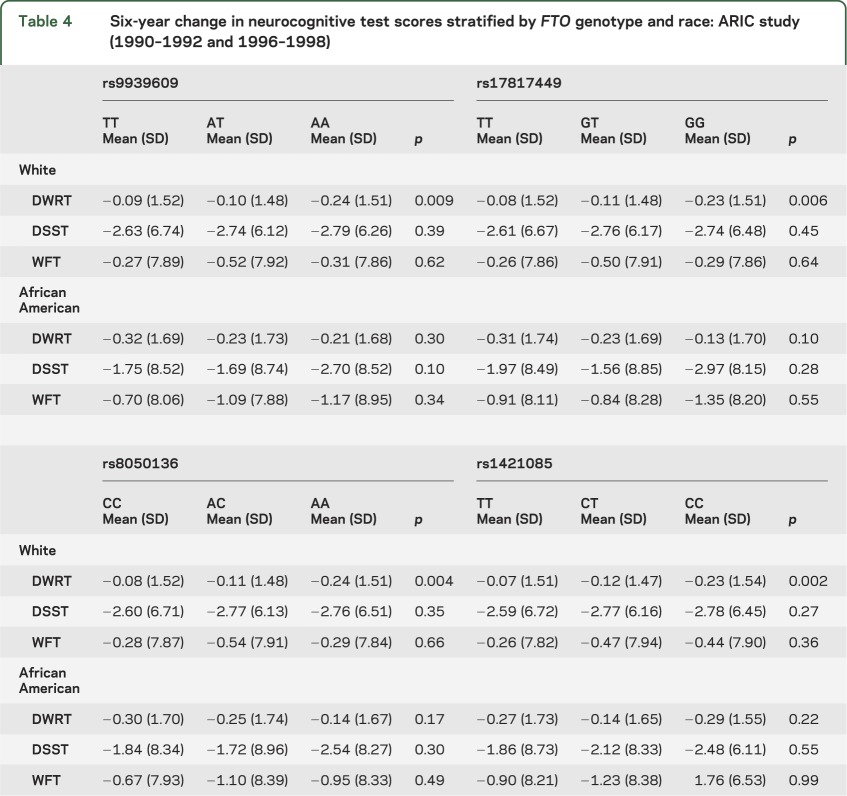
Table 5.
Mean change in cognitive function and FTO genotype: ARIC study (1990–1992 and 1996–1998)
An association between FTO genotype and cognitive change was also examined using logistic regression to predict the risk of being in the decile of change score showing the greatest decline for each of the 3 neuropsychological tests rather than in the other 9 deciles combined. An increased susceptibility to cognitive decline associated with each addition of an FTO minor allele was seen only in white ARIC study participants for 6-year change in scores on the DWRT. For these individuals, the odds ratios for greatest decline after adjustment for age, gender, and education were 1.10 (95% confidence interval [CI] = 1.01–1.19, p = 0.03) for the addition of the rs8050136 A allele, 1.09 (95% CI 1.00–1.18, p = 0.05) for the rs17817449 G allele, and 1.11 (95% CI = 1.02–1.21, p = 0.01) for the rs1421085 C allele, but there was no significant association observed for the rs9939609 A allele (odds ratio = 1.08, 95% CI = 1.00–1.18, p = 0.06).
DISCUSSION
Genome-wide association studies of BMI have identified possible causal variants in genes that are either highly expressed in the brain, or have known functions in the CNS, such as FTO, melanocortin 4 receptor (MC4R), proopiomelanocortin (POMC), SH2 adaptor protein 1 (SH2B1), and brain-derived neurotrophic factor (BDNF), that are implicated in the regulation of energy balance and body weight.26,27 For example, mice deficient in Fto show postnatal growth retardation, loss of white adipose tissue, and increased energy expenditure,28 and deletion of Bdnf in the hypothalamus results in hyperphagia and increased adiposity.29 Rare mutations in both POMC and MC4R cause severe monogenic forms of obesity.30 BDNF is also involved in memory formation and synaptic plasticity,31 and the results of the study reported here suggest that 2 sequence variants in FTO that are associated with susceptibility to obesity and diabetes may have a second independent role in cognitive aging.
The FTO rs3751812 variant associated with deficits in brain volume in the Alzheimer's Disease Neuroimaging Initiative8 is in strong linkage disequilibrium (r2 > 0.90) with all 4 of the SNPs genotyped in the ARIC cohort in Utah residents with ancestry from northern and western Europe (CEPH), and with rs1421085 in populations of African ancestry (r2 = 1.00 in Yoruba in Ibadan, Nigeria [YRI]; r2 = 1.00 in African ancestry in southwest United States [ASW]) included in the International HapMap project.32 However, there were no significant alterations associated with the FTO rs3751812 genotype after the regression models were adjusted for age, sex, and BMI so that the brain atrophy observed in the Alzheimer's Disease Neuroimaging Initiative may have been mediated by BMI, while unexpectedly the effect of the 4 FTO variants on change in memory was not attenuated by the inclusion of BMI and diabetes.
In contrast to the known effects of chronic caloric excess, which can include failure of insulin production in combination with insulin resistance in metabolic tissues, caloric restriction in which food intake is limited without malnutrition results in lower blood glucose and insulin, reduced energy stores in the form of glycogen and fat, increased resistance to external stress, and increased lifespan in laboratory rodents.33 In accordance with a study demonstrating that a high-calorie diet increases the risk of Alzheimer disease,34 caloric restriction has been shown to prevent amyloid plaque development in Tg2576 transgenic mice,35 providing plausibility for biological pathways that may control both energy metabolism and age-dependent maintenance of neuronal integrity that affects cognitive status.
The impact of obesity on cognitive function, rather than its genetic determinants, has also been examined in several large epidemiologic studies in individuals without dementia.36–39 To evaluate the relationship with midlife obesity, BMI and WHR were assessed in 1,814 men and women aged 40 to 69 years in the Framingham Offspring Cohort, and a WHR in the upper quartile at baseline was associated with significantly lower performance on tests of executive function and visuomotor skills 12 years later.36 There was also a linear trend for greater 5-year decline in scores for a test of delayed word recall with increasing BMI in a cohort of healthy French workers.37 In the Whitehall II Study of 9,181 white British civil service workers aged 35 to 55 years, long-term obesity was associated with lower scores on the Mini-Mental State Examination, a test of immediate memory, and a composite measure of executive function that included a test similar to the WFT.38 In contrast, higher BMI did not predict cognitive decline in residents of Chicago aged 65 years and older who were not impaired at baseline.39 Differences in the ages of the study participants, study design, the neuropsychological tests used to assess cognitive function, as well as the indices of obesity among the various studies, make it difficult to directly compare these results with those found for the FTO sequence variants; however, taken together, these reports suggest that obesity is associated with performance in multiple cognitive domains whereas variation in FTO was limited to decline in memory in the ARIC study. Similarly, diabetes case status has been associated with significantly poorer cognitive performance in various cognitive domains including global cognitive function, executive function, immediate and delayed memory, visual attention, and processing speed in several longitudinal studies.40
When the association between the 4 FTO polymorphisms and susceptibility to diabetes was previously investigated in the ARIC study, variation in the influence of the gene in whites and African Americans was observed.7 In this study, there was no association between any of the tests of cognitive function and the FTO sequence variants in African Americans despite adequate power to detect an effect of the same magnitude that was found for whites (R2 ≤ 0.01) (table e-3). This would be consistent with the observed differences in linkage disequilibrium between the polymorphisms in whites and African Americans if there were a causative variant underlying the association that was located elsewhere in the gene and was correlated with at least 2 of the SNPs in whites but with none of the sequence variants in African Americans. Alternatively, although the same criteria were applied in both racial groups, 26.9% of whites and 50.4% of African Americans were excluded from analysis, including a higher proportion of African Americans than whites who were eligible for the study at baseline but who died during the 6-year follow-up period (8.4% and 5.4%, respectively; p ≤ 0.001), so it is possible that selection bias may have contributed to the lack of association found for African American subjects.
Although the amount of change in test scores observed for white study participants was modest, replication of this finding in other populations is warranted to confirm the role of FTO in decline in memory detectable in middle-aged adults.
Supplementary Material
ACKNOWLEDGMENT
The authors thank the staff and participants of the ARIC study for their important contributions.
Glossary
- ARIC
Atherosclerosis Risk in Communities
- BMI
body mass index
- CI
confidence interval
- DSST
Digit Symbol Substitution Test
- DWRT
Delayed Word Recall Test
- SNP
single nucleotide polymorphism
- WFT
Word Fluency Test
- WHR
waist-to-hip ratio
Footnotes
Supplemental data at www.neurology.org
AUTHOR CONTRIBUTIONS
Dr. Bressler drafted the manuscript, and contributed to study concept, study design, and analysis and interpretation of data. Dr. Bressler also conducted the statistical analysis. Dr. Fornage, Dr. Demerath, Dr. Knopman, Dr. Monda, Dr. North, Dr. Penman, Dr. Mosley, and Dr. Boerwinkle revised the manuscript for content, and contributed to study concept, study design, and analysis and interpretation of data.
Study funding
The Atherosclerosis Risk in Communities Study is performed as a collaborative study supported by National Heart, Lung, and Blood Institute contracts (HHSN268201100005C, HHSN268201100006C, HHSN268201100007C, HHSN268201100008C, HHSN268201100009C, HHSN268201100010C, HHSN268201100011C, and HHSN268201100012C).
DISCLOSURE
J. Bressler and M. Fornage receive research support from the NIH. E. Demerath received an honorarium for speaking at the Pennington Biomedical Research Center; is an investigator of a study sponsored by COSMED, Inc.; and receives research support from the NIH. D.S. Knopman serves as Deputy Editor for Neurology®; serves on a Data Safety Monitoring Board for Lilly Pharmaceuticals; is an investigator in clinical trials sponsored by Baxter, Elan Pharmaceuticals, and Forest Pharmaceuticals; and receives research support from the NIH. K. Monda received travel expenses from Amgen Inc. to attend a conference and is currently employed by Amgen Inc. K. North receives research support from the NIH. A. Penman receives research support from Pfizer Inc., the NIH, and from Friends of the Massachusetts Eye and Ear Infirmary. T. Mosley and E. Boerwinkle receive research support from the NIH. Go to Neurology.org for full disclosures.
REFERENCES
- 1.Frayling TM, Timpson NJ, Weedon MN, et al. A common variant in the FTO gene is associated with body mass index and predisposes to childhood and adult obesity. Science 2007;316:889–894 [DOI] [PMC free article] [PubMed] [Google Scholar]
- 2.Dina C, Meyre D, Gallina S, et al. Variation in FTO contributes to childhood obesity and severe adult obesity. Nat Genet 2007;39:724–726 [DOI] [PubMed] [Google Scholar]
- 3.Scuteri A, Sanna S, Chen WM, et al. Genome-wide association scan shows genetic variants in the FTO gene are associated with obesity-related traits. PLoS Genet 2007;3:e115. [DOI] [PMC free article] [PubMed] [Google Scholar]
- 4.Scott LJ, Mohlke KL, Bonnycastle LL, et al. A genome-wide association study of type 2 diabetes in Finns detects multiple susceptibility variants. Science 2007;316:1341–1345 [DOI] [PMC free article] [PubMed] [Google Scholar]
- 5.Saxena R, Voight BF, Lyssenko V, et al. Genome-wide association analysis identifies loci for type 2 diabetes and triglyceride levels. Science 2007;316:1331–1336 [DOI] [PubMed] [Google Scholar]
- 6.Tung YC, Yeo GS. From GWAS to biology: lessons from FTO. Ann NY Acad Sci 2011;1220:162–171 [DOI] [PubMed] [Google Scholar]
- 7.Bressler J, Kao WH, Pankow JS, Boerwinkle E. Risk of type 2 diabetes and obesity is differentially associated with variation in FTO in whites and African-Americans in the ARIC study. PLoS One 2010;5:e10521. [DOI] [PMC free article] [PubMed] [Google Scholar]
- 8.Ho AJ, Stein JL, Hua X, et al. A commonly carried allele of the obesity-related FTO gene is associated with reduced brain volume in the healthy elderly. Proc Natl Acad Sci USA 2010;107:8404–8409 [DOI] [PMC free article] [PubMed] [Google Scholar]
- 9.Raji CA, Ho AJ, Parikshak NN, et al. Brain structure and obesity. Hum Brain Mapp 2010;31:353–364 [DOI] [PMC free article] [PubMed] [Google Scholar]
- 10.Debette S, Beiser A, Hoffmann U, et al. Visceral fat is associated with lower brain volume in healthy middle-aged adults. Ann Neurol 2010;68:136–144 [DOI] [PMC free article] [PubMed] [Google Scholar]
- 11.Mosley TH, Jr, Knopman DS, Catellier DJ, et al. Cerebral MRI findings and cognitive functioning: the Atherosclerosis Risk in Communities study. Neurology 2005;64:2056–2062 [DOI] [PubMed] [Google Scholar]
- 12.Kuller LH, Shemanski L, Manolio T, et al. Relationship between ApoE, MRI findings, and cognitive function in the Cardiovascular Health Study. Stroke 1998;29:388–398 [DOI] [PubMed] [Google Scholar]
- 13.The ARIC Investigators The Atherosclerosis Risk in Communities (ARIC) study: design and objectives. Am J Epidemiol 1989;129:687–702 [PubMed] [Google Scholar]
- 14.Cohen J. A coefficient of agreement for nominal scales. Educ Psychol Meas 1960;20:37–46 [Google Scholar]
- 15.Knopman DS, Ryberg S. A verbal memory test with high predictive accuracy for dementia of the Alzheimer type. Arch Neurol 1989;46:141–145 [DOI] [PubMed] [Google Scholar]
- 16.Wechsler D. The Adult Intelligence Scale—Revised. New York: Psychological Corp.; 1981 [Google Scholar]
- 17.Lezak M. Neuropsychological Assessment. New York: Oxford University Press; 1995 [Google Scholar]
- 18.Tombaugh TN, Kozak J, Rees L. Normative data stratified by age and education for two measures of verbal fluency: FAS and animal naming. Arch Clin Neuropsychol 1999;14:167–177 [PubMed] [Google Scholar]
- 19.Siedel J, Hagele EO, Ziegenhorn J, Wahlefeld AW. Reagent for the enzymatic determination of serum total cholesterol with improved lipolytic efficiency. Clin Chem 1983;29:1075–1080 [PubMed] [Google Scholar]
- 20.Nagele U, Hagele EO, Sauer G, et al. Reagent for the enzymatic determination of serum total triglycerides with improved lipolytic efficiency. J Clin Chem Clin Biochem 1984;22:165–174 [DOI] [PubMed] [Google Scholar]
- 21.Friedewald WT, Levy RI, Fredrickson DS. Estimation of the concentration of low-density lipoprotein cholesterol in plasma, without use of the preparative ultracentrifuge. Clin Chem 1972;18:499–502 [PubMed] [Google Scholar]
- 22.Warnick GR, Benderson J, Albers JJ. Dextran sulfate-Mg2+ precipitation procedure for quantitation of high-density-lipoprotein cholesterol. Clin Chem 1982;28:1379–1388 [PubMed] [Google Scholar]
- 23.National Cholesterol Education Program Detection, Evaluation, and Treatment of High Blood Cholesterol in Adults (Adult Treatment Panel III). Bethesda, MD: National Heart, Lung, and Blood Institute; 2002. Report No.: 02-5215. [Google Scholar]
- 24.Barrett JC, Fry B, Maller J, Daly MJ. Haploview: analysis and visualization of LD and haplotype maps. Bioinformatics 2005;21:263–265 [DOI] [PubMed] [Google Scholar]
- 25.Cerhan JR, Folsom AR, Mortimer JA, et al. Correlates of cognitive function in middle-aged adults: Atherosclerosis Risk in Communities (ARIC) Study Investigators. Gerontology 1998;44:95–105 [DOI] [PubMed] [Google Scholar]
- 26.Willer CJ, Speliotes EK, Loos RJ, et al. Six new loci associated with body mass index highlight a neuronal influence on body weight regulation. Nat Genet 2009;41:25–34 [DOI] [PMC free article] [PubMed] [Google Scholar]
- 27.Speliotes EK, Willer CJ, Berndt SI, et al. Association analyses of 249,796 individuals reveal 18 new loci associated with body mass index. Nat Genet 2010;42:937–948 [DOI] [PMC free article] [PubMed] [Google Scholar]
- 28.Fischer J, Koch L, Emmerling C, et al. Inactivation of the FTO gene protects from obesity. Nature 2009;458:894–898 [DOI] [PubMed] [Google Scholar]
- 29.Unger TJ, Calderon GA, Bradley LC, Sena-Esteves M, Rios M. Selective deletion of BDNF in the ventromedial and dorsomedial hypothalamus of adult mice results in hyperphagic behavior and obesity. J Neurosci 2007;27:14265–14274 [DOI] [PMC free article] [PubMed] [Google Scholar]
- 30.Bell CG, Walley AJ, Froguel P. The genetics of human obesity. Nat Rev Genet 2005;6:221–234 [DOI] [PubMed] [Google Scholar]
- 31.Egan MF, Kojima M, Callicott JH, et al. The BDNF val66met polymorphism affects activity-dependent secretion of BDNF and human memory and hippocampal function. Cell 2003;112:257–269 [DOI] [PubMed] [Google Scholar]
- 32.Frazer KA, Ballinger DG, Cox DR, et al. A second generation human haplotype map of over 3.1 million SNPs. Nature 2007;449:851–861 [DOI] [PMC free article] [PubMed] [Google Scholar]
- 33.Koubova J, Guarente L. How does calorie restriction work? Genes Dev 2003;17:313–321 [DOI] [PubMed] [Google Scholar]
- 34.Luchsinger JA, Tang MX, Shea S, Mayeux R. Caloric intake and the risk of Alzheimer disease. Arch Neurol 2002;59:1258–1263 [DOI] [PubMed] [Google Scholar]
- 35.Wang J, Ho L, Qin W, et al. Caloric restriction attenuates beta-amyloid neuropathology in a mouse model of Alzheimer's disease. FASEB J 2005;19:659–661 [DOI] [PubMed] [Google Scholar]
- 36.Wolf PA, Beiser A, Elias MF, Au R, Vasan RS, Seshadri S. Relation of obesity to cognitive function: importance of central obesity and synergistic influence of concomitant hypertension. The Framingham Heart Study. Curr Alzheimer Res 2007;4:111–116 [DOI] [PubMed] [Google Scholar]
- 37.Cournot M, Marquie JC, Ansiau D, et al. Relation between body mass index and cognitive function in healthy middle-aged men and women. Neurology 2006;67:1208–1214 [DOI] [PubMed] [Google Scholar]
- 38.Sabia S, Kivimaki M, Shipley MJ, Marmot MG, Singh-Manoux A. Body mass index over the adult life course and cognition in late midlife: the Whitehall II Cohort Study. Am J Clin Nutr 2009;89:601–607 [DOI] [PMC free article] [PubMed] [Google Scholar]
- 39.Sturman MT, de Leon CF, Bienias JL, Morris MC, Wilson RS, Evans DA. Body mass index and cognitive decline in a biracial community population. Neurology 2008;70:360–367 [DOI] [PubMed] [Google Scholar]
- 40.van den Berg E, Kloppenborg RP, Kessels RP, Kappelle LJ, Biessels GJ. Type 2 diabetes mellitus, hypertension, dyslipidemia and obesity: a systematic comparison of their impact on cognition. Biochim Biophys Acta 2009;1792:470–481 [DOI] [PubMed] [Google Scholar]
Associated Data
This section collects any data citations, data availability statements, or supplementary materials included in this article.