Abstract
Knowledge of the transmission field (B1 +) of radio-frequency coils is crucial for high field (B0 = 3.0 T) and ultrahigh field (B0≥7.0 T) magnetic resonance applications to overcome constraints dictated by electrodynamics in the short wavelength regime with the ultimate goal to improve the image quality. For this purpose B1 + mapping methods are used, which are commonly magnitude-based. In this study an analysis of five phase-based methods for three-dimensional mapping of the B1 + field is presented. The five methods are implemented in a 3D gradient-echo technique. Each method makes use of different RF-pulses (composite or off-resonance pulses) to encode the effective intensity of the B1 + field into the phase of the magnetization. The different RF-pulses result in different trajectories of the magnetization, different use of the transverse magnetization and different sensitivities to B1 + inhomogeneities and frequency offsets, as demonstrated by numerical simulations. The characterization of the five methods also includes phantom experiments and in vivo studies of the human brain at 3.0 T and at 7.0 T. It is shown how the characteristics of each method affect the quality of the B1 + maps. Implications for in vivo B1 + mapping at 3.0 T and 7.0 T are discussed.
Introduction
Non-uniformities of the transmission radio-frequency (RF) field (B1 +) constitute an adverse factor for high field (B0 = 3.0 T) and ultrahigh field (B0≥7.0 T) magnetic resonance (MR), which may render diagnostics challenging. This practical impediment is pronounced when imaging techniques sensitive to the excitation flip angle (FA) are applied. The knowledge of the B1 + field distribution is essential to correct for B1 + non-uniformities of single channel or multi-channel transmit (TX) RF-coils. To trim or shim the B1 + field, multiple channel transmission has been pioneered [1]–[3]. For this purpose, multi transmit arrays are used, which require B1+ mapping routines to calibrate each individual RF coil element. This procedure can be time consuming when using TX arrays comprising many transmit elements. Consequently accurate and fast B1+ distribution mapping is the key for ultrahigh field clinical applications.
B1+ mapping approaches commonly used are mainly magnitude-based and are generally confined to the ratios or the fit of signal intensity images [4]–[11]. For this purpose sets of images are acquired using either two flip angles [4]–[6], identical flip angles but different repetition times (TR) [7], variable flip angles [8], [9] or also signals from spin-echoes and stimulated-echoes [10], as well as signals from gradient-echoes and stimulated-echoes [11]. For most of these magnitude-based approaches the quantitative B1+ evaluation may be influenced by saturation effects given by T1 relaxation. This problem can be overcome with the use of long repetition times (TR), which, however, would result in prolonged acquisition times. Alternatively, phase-based methods have been proposed as they are insensitive to T1 relaxation. They were also found to be more accurate than magnitude-based methods, especially at low flip angle regimes [12].
Realizing the advantages of phase-based methods for B1+ mapping, this work characterizes five of these methods: A) an optimized version for high field proton MRI [13] of the low flip angle method proposed by Mugler [14], [15] here named “Optimized low-flip-angle method”, B) the phase sensitive method of Morrell [16] here named “Phase-sensitive method”, C) the phase-based method of Santoro [17], [18], applied to high field proton MRI [19] here named “ФFA-CUP method”, D) the Bloch-Siegert shift method of Sacolick [20]–[22] here named “Bloch-Siegert method” and E) the orthogonal pulses method proposed by Chang [23] here named “Orthogonal-pulses method”. These phase-based methods share in common the use of a composite or off-resonance RF-pulse to encode the spatial B1+ magnitude information into the phase of the magnetization vector (M). Each method uses a different scheme of the RF-phases, generating a different evolution of M. The sensitivity to B1+ variations and frequency offsets is examined using numerical simulations of the Bloch equations. Phantom experiments and human brain imaging studies are conducted at 3.0 T and 7.0 T to scrutinize each method. This includes the assessment of repetition times achievable, according to specific absorption rate (SAR) levels, as well as the susceptibility to off-resonance effects. For a balanced comparison, all methods are used in conjunction with the same reading module.
Materials and Methods
Theory
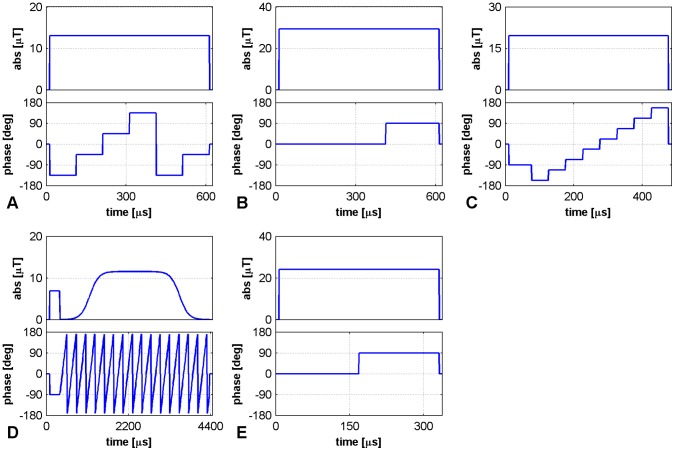
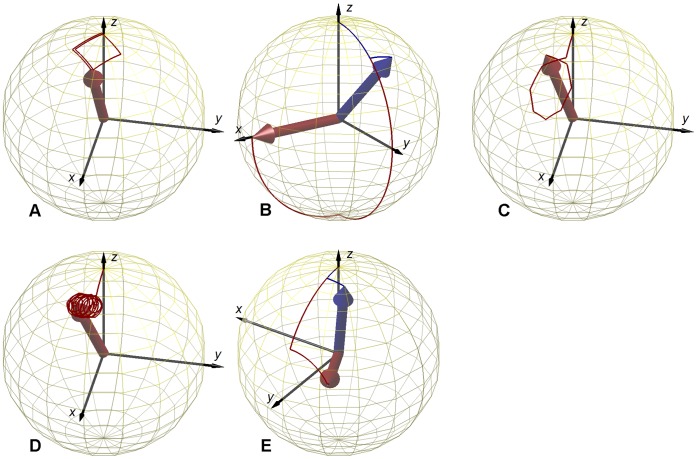
The B1+ mapping methods analyzed in this work make use of a complex RF-pulse envelope (a rectangular composite pulse or an off-resonance Fermi pulse) for excitation, with separately controlled amplitude and phase (Fig. 1). Each pulse achieves a different trajectory of the magnetization M, depending on the combination of amplitude and phase of the RF-pulse. The trajectories of M for the five pulses are depicted in Fig. 2 for the ideal case where ΔB0 = 0. The presence of B0 inhomogeneities, or other sources of frequency offsets, results in deviations from the ideal trajectory.
Figure 1. RF-pulse envelopes for phase-based B1+ mapping.
Diagrams of the composite pulses used for all methods: A – Optimized low-flip-angle method , B – Phase-sensitive method , C – ΦFA-CUP method , D – Bloch-Siegert method, E – Orthogonal-pulses method. Pulse timing, intensity of the B1+ field (in µT) and RF-phases (in degrees) are sketched. The parameters used are: A) α = 20° and duration of 600 µs; B) α = 90° and duration of 600 µs; C) p0 = 20°, α = 15° and duration of 400 µs (plus the duration of the p0 pulse); D) p0 = 20°, α = 425° and duration of 4000 µs (plus the duration of the p0 pulse); E) α = 60° and duration of 325 µs.
Figure 2. Trajectories of the magnetization during RF-excitation.
Evolution of M in a unitary sphere during the RF-pulses of Fig.1 (red lines), under ideal conditions (ΔB0 = 0) for all methods: A – Optimized low-flip-angle method , B – Phase-sensitive method , C – ΦFA-CUP method , D – Bloch-Siegert method, E – Orthogonal-pulses method. A) a squared trajectory is traversed for one and a half turns; B) for small flip angles a rectangular trajectory is traversed for half turn (blue line: α = 18°), the flip angle originally proposed moves M into the transverse plane (red line: α = 90°); C) an intial pulse moves M far from the origin, then an octagonal loop is traversed for one turn only; D) an initial excitation is followed by an off-resonance pulse, which is equivalent to traversing a circular trajectory for several turns; E) for small flip angles a square trajectory is traversed for half turn (blue line: α = 12°), the flip angle originally proposed moves M close to the transverse plane (red line: α = 60°).
All the five trajectories can be represented by a different polygon lying on the surface of a unitary sphere. Each of them is characterized by a different number of sides and it is traversed a different number of times: A – Optimized low-flip-angle method ) a squared trajectory which is traversed for one and a half turns [13]–[15], B – Phase-sensitive method ) a rectangular trajectory which is traversed for a half turn [16], C – ФFA-CUP method ) an off-origin loop trajectory which is traversed for a single turn [17]–[19], D – Bloch-Siegert method ) an initial excitation followed by an off-resonance pulse (which is equivalent to traversing a small circular trajectory for several turns) [20]–[22] and E – Orthogonal-pulses method ) a square trajectory which is traversed for a half turn [23].
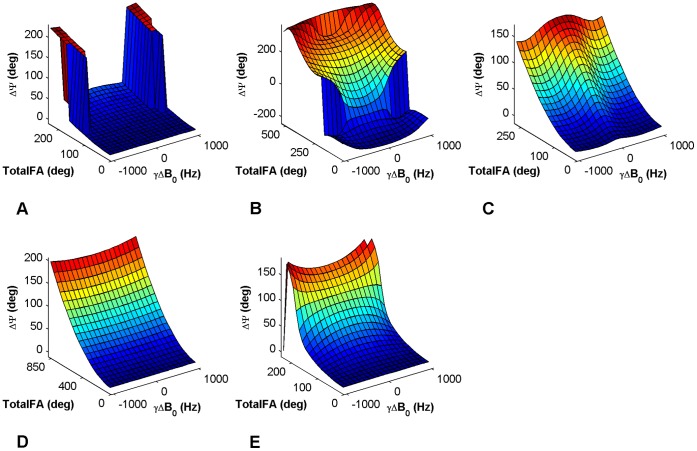
At the end of each RF-pulse, the local magnetization presents a phase accrual depending on the local B1+ intensity and frequency offset experienced, as shown in the curves of Fig. 3. The theoretical description of this effect has been already reported in [16], [18], [20], [23], and is briefly resumed here.
Figure 3. Curves of sensitivity to B1+ and B0 inhomogeneities.
Phase accrual curves of the five methods plotted versus the TotalFA of the RF-pulses and a frequency offset distribution −1 kHz ≤ ΔB0≤1 kHz. The frequency offset range is the same for all methods, while the TotalFA ranges differ, as well as the phase accrual Ψ. These curves were derived from simulations (using the same parameters as in Fig. 1) and used for the 2D interpolation to obtain the B1+ maps. Methods: A – Optimized low-flip-angle method , B – Phase-sensitive method , C – ΦFA-CUP method , D – Bloch-Siegert method, E – Orthogonal-pulses method.
For methods A, B, C and E the RF-pulse can be divided into sub-pulses of flip-angle α and RF-phase Ф, denoted with αФ. Each sub-pulse αФ represents a rotation about a different axis, due to their different RF-phase. The magnetization accumulates a phase shift which is proportional to the local B1+ field intensity because of the non-commutativity of rotations about different axes.
Method D, after the initial excitation, uses an off-resonance RF-pulse. In this case the RF-phase varies linearly within the pulse and the magnetization accumulates a phase shift proportional to the local B1+ field intensity, due to the well-known Bloch-Siegert shift effect [24].
To cancel phase contributions due to sources other than B1+, such as the receive coil sensitivity (B1−), the acquisition of two phase images, obtained with opposite senses of rotation of the magnetization (opposite RF-phase schemes), is required for all methods. The subtraction of the images preserves the B1+ information, while removing all other time-independent phase contributions.
A – Optimized low-flip-angle method
Excitation is performed by the application of the non-selective composite pulse: [α−135 α−45 α45 α135 α−135 α−45] (Fig. 1A). The pulse moves the magnetization vector about a square, of side length α, through 1.5 turns (Fig. 2A) [13]. A second image must be acquired using a corresponding pulse that moves the magnetization in the opposite sense of rotation: [α−45α−135α135α45α−45α−135].
B – Phase-sensitive method
Excitation is performed by the application of the non-selective composite pulse: [2α0 α90] (Fig. 1B). For a small flip angle α the pulse moves the magnetization vector along a rectangular trajectory, with one side of length 2α and the other of length α, through 0.5 turns (Fig. 2B - blue line). The method is originally proposed using a nominal flip angle α = 90° (which performs the trajectory in Fig. 2B - red line) [16]. A second image must be acquired with the first sub-pulse reversed in sign: [2α180 α90].
C – ФFA-CUP method
Excitation is performed by the application of the non-selective composite pulse: [p0 −90 α−157.5 α−112.5 α−67.5 α−22.5 α+22.5 α+67.5 α+112.5 α+157.5] (Fig. 1C). The magnetization vector is moved away from the origin by the first sub-pulse, named p0. The phase accrual is achieved by traversing for 1.0 turn an octagonal trajectory of side α shifted from the origin. The use of the first pulse p0 separates the excitation from the phase accrual in order to optimize the sensitivity to B1+ variations [17], [19]. A second image must be acquired with the composite pulse: [p0 +90 α+157.5 α+112.5 α+67.5 α+22.5 α−22.5 α−67.5 α−112.5 α−157.5].
D – Bloch-Siegert method
This method makes use of an off-resonance pulse of frequency shift ΔωRF applied immediately after an excitation: [p0 −90 α−90,Δω] (Fig. 1D). The off-resonance pulse moves the magnetization about a circular trajectory traversed several times (Fig. 2D). The number of loops is given by the duration of the pulse multiplied by the off-resonance frequency. The off-resonance pulse can be seen as a pulse in which the RF phase Ф is continuously varied during its duration τ, according to Ф = ΔωRF·τ. A second image must be acquired using the opposite frequency shift:
-ΔωRF. The method is originally proposed using an off-resonance Fermi pulse of frequency shift ΔωRF = 4 kHz and duration of 8 ms [20]. However it has been widely shown [21], [22] that different values of the pulse duration and frequency shift, as well as different pulse shapes, can be used to optimize this method. Here we used a Fermi pulse of frequency shift ΔωRF = 4 kHz and duration of 4 ms.
E – Orthogonal-pulses method
Excitation is performed by the application of the non-selective composite pulse: [α0 α90] (Fig. 1E). For a small flip angle α the pulse moves the magnetization vector along a square trajectory, with side of length α, through 0.5 turns (Fig. 2E – blue line). The method is originally proposed using a nominal flip angle α = 60° (which performs the trajectory in Fig. 2E - red line) [23]. A second image must be acquired with the phases of the two sub-pulses swapped: [α90 α0].
Numerical Simulations
MATLAB (MathWorks Inc, Natick, USA) software was used to calculate the dynamics of the magnetization during the excitation pulses, by means of numerical simulations of the Bloch equations. A range of values of the frequency offset (−1 kHz ≤ ΔB0≤1 kHz, with an increment of 50 Hz) and of the B1+ intensity (rescaling the flip angle from 0 to 2 times the nominal value, with an increment of 0.05) was used. The sensitivity of the different methods to the local variations of the B1+ field and of the frequency offset is expressed by the variable Ψ (Fig. 3), which is defined as the subtraction of the phase accruals obtained from the two complementary scans required by each method. The intensity of the B1+ is expressed in terms of the total flip angle (TotalFA) used by each pulse, which results from the total duration and amplitude of the RF applied, regardless of its RF-phase scheme.
At high field strengths the TotalFA represents a crucial parameter, as the SAR levels limit the lowest achievable TR. This is especially the case for the methods used in this work, which require values of TotalFA of the order of several tens to a few hundred degrees. In order to quantify the efficiency (ε) of each method to convert the employed RF-power into a phase accrual Ψ the following variable was defined and calculated:
| (1) |
where τRF is the total duration of the pulse.
MR Hardware
Phantom studies and in vivo experiments of the human brain were performed at magnetic field strengths of 3.0 T and 7.0 T. For this purpose, methods A-E were implemented on a clinical 3.0 T MR-scanner (TIM Verio, Siemens Healthcare, Erlangen, Germany) and a whole body 7.0 T MR-scanner (Magnetom, Siemens Healthcare, Erlangen Germany), using a dedicated sequence development environment (IDEA, Siemens Healthcare, Erlangen, Germany). At 3.0 T a transmit/receive (TX/RX) birdcage coil (Siemens Healthcare, Erlangen, Germany) operating in the circular polarized (CP) mode was used (diameter = 27 cm, length = 31 cm). At 7.0 T a TX/RX birdcage coil (Siemens Healthcare, Erlangen, Germany) operating in the CP mode was used (diameter = 34 cm, length = 38 cm).
Implementation of the B1+ Mapping Techniques
The implementation comprises a standard 3D gradient-echo sequence, where the excitation is performed for each method by the non-selective RF-pulses sketched in Fig. 1 and described in the Theory section.
To reduce bulk motion effects the two images required by each method were acquired interleavedly. To examine and correct for variations in the main magnetic field (B0) across the object ΔB0 maps were acquired. For this purpose a secondary gradient-echo readout was added to the sequence; the ΔB0 maps (Fig. 4) were obtained from the subtraction of the two phase images acquired at different echo times (TE) [25].
Figure 4. ΔB0 maps in phantom and in vivo at 3.0 T and 7.0 T.
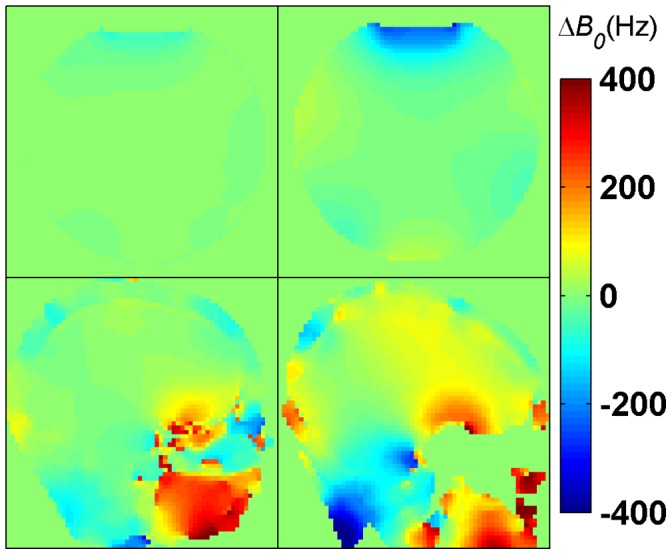
Top: central axial partition of the 3D ΔB0 maps obtained at 3.0 T (top-left) and at 7.0 T (top-right) in phantom with ΔTE = 2.5 ms; strong B0 offsets are visible at the air-water interface in the upper part of the phantom. Bottom: central sagittal partition of the 3D ΔB0 maps of the human brain obtained at 3.0 T (bottom-left) with ΔTE = 2.46 ms and at 7.0 T (bottom-right) with ΔTE = 3.06 ms; strong B0 offsets are visible in the sphenoid sinuses area and, at 7.0 T, in the neck region. All maps are in hertz.
B1+ maps (Figs. 5–8) were calculated for each method from the measured phase accrual Ψ and the ΔB0 map, using the corresponding curve of sensitivity of Fig. 3 as a lookup table and performing a linear 2D interpolation.
Figure 5. B1+ maps in phantom at 3.0 T.
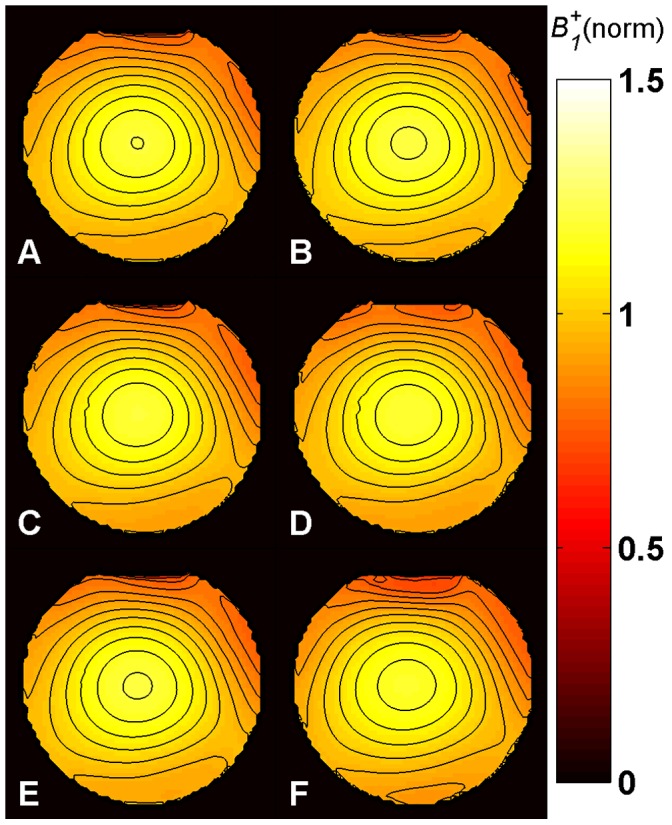
Central axial partition of the 3D B1+ maps obtained with methods A-E in phantom at 3.0 T using a birdcage TX/RX coil. Identical repetition times (TR = 30 ms) and SAR levels were used for all methods. The same partition of the B1+ map acquired for comparison with the DAM with TR = 500 ms is also shown (F). All maps are normalized to their nominal B1+ given in Table 1 in µT. The typical central spot of the birdcage TX/RX coil is visible. The contour plots (with contour increment of 0.05) show that the B1+ distributions obtained from the phase-based methods are consistent with the DAM. Methods: A – Optimized low-flip-angle method , B – Phase-sensitive method , C – ΦFA-CUP method , D – Bloch-Siegert method, E – Orthogonal-pulses method, F – Double Angle method.
Figure 8. B1+ maps in vivo at 7.0 T.
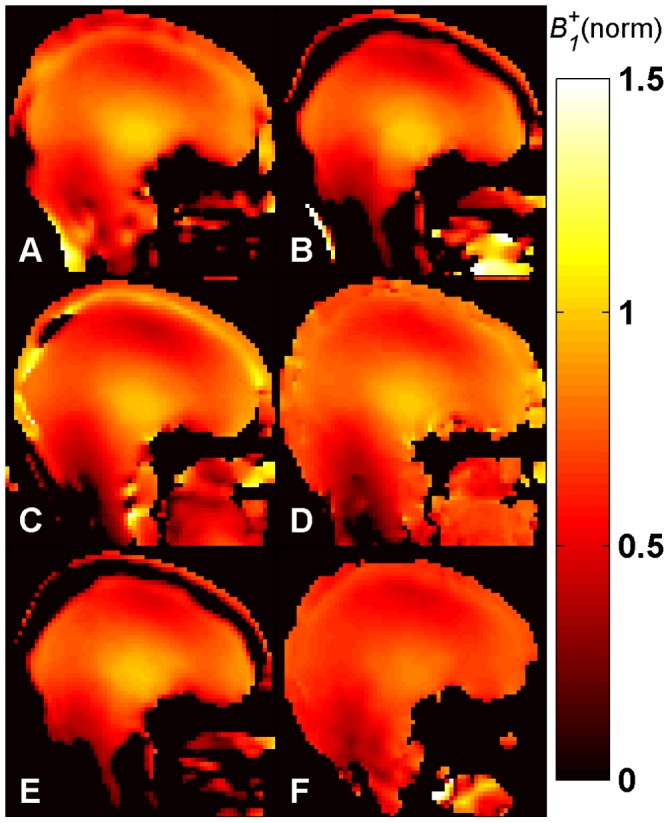
Central sagittal partition of the 3D B1+ maps of the human brain obtained with methods A-E in vivo at 7.0 T using a birdcage TX/RX coil. Identical repetition times (TR = 110 ms) and SAR levels were used for all methods. The central slice of the B1+ map acquired for comparison with the 2D DAM, with TR = 6000 ms, is also shown (F). All maps are normalized to their nominal B1+ given in Table 1 in µT. Methods: A – Optimized low-flip-angle method , B – Phase-sensitive method , C – ΦFA-CUP method , D – Bloch-Siegert method, E – Orthogonal-pulses method, F – Double Angle method.
For comparison, a standard 3D gradient-echo technique was used to acquire three-dimensional B1+ maps using the double-angle method (DAM) [4]. This required the acquisition of two magnitude images with nominal flip angles of α = 60° and 2α = 120° together with repetition times of TR>5T1 [5].
Specific Absorption Rate Adjustment
Each method uses a different RF-power level. Since the SAR represents the limiting factor for the minimum achievable TR at high field strengths for all methods, the RF-pulse amplitudes (i.e. the nominal B1+) were individually adjusted for each method in order to accomplish identical SAR levels, given a common repetition time. This corresponds to truncating the sensitivity curves of Fig. 3 to a TotalFA value which guarantees identical SAR levels for all methods. The TRs were adjusted in in vivo experiments - according to the volunteer weight - to achieve a nominal SAR level of 2.4 W/kg. This value corresponds to 75% of the SAR limit for the normal and first level operating modes for head imaging, as given by the IEC guidelines [26].
The nominal values of α, TotalFA and B1+ for the five methods are reported in Table 1, together with the duration of the RF-pulses and the repetition times. The nominal B1+ values are calculated starting from the reference voltage necessary to obtain a 1 ms rectangular π-pulse, and adjusted according to the duration τ and the TotalFA of the pulses of the five methods. The reported B1+ intensity represents the average value within the pulse. Identical parameters were used for both phantom and in vivo experiments.
Table 1. Nominal values of the initial excitation angle (p0), flip angle of each sub-pulse (α), total flip angle (TotalFA), B1+ intensity, total duration of the RF-pulses, echo times (TE) and repetition times (TR) for the experiments performed in phantom and in vivo, at 3.0 T and 7.0 T, with methods A–E.
| Method | p0 | α | TotalFA | Total Duration | B1+ intensity | TE | TR [ms] at 3.0 T | TR [ms] at 7.0 T |
| [deg] | [deg] | [deg] | [µs] | [µT] | [ms] | phantom/in vivo | phantom/in vivo | |
| A | - | 20 | 120 | 600 | 13.0 | 1.55 | 30/30 | 110/110 |
| B | - | 40 | 120 | 600 | 13.0 | 1.42 | 30/30 | 110/110 |
| C | 20 | 15 | 140 | 490 | 14.6 | 1.47 | 30/30 | 110/110 |
| D | 20 | 250 | 270 | 4250 | 4.14 | 5.21 | 30/30 | 110/110 |
| E | - | 45 | 90 | 325 | 18.1 | 1.25 | 30/30 | 110/110 |
| DAM | - | 60 | 60 | 300 | 13.0 | 2.00 | 500/6000 | 500/6000 |
| 120 | 120 | 600 | 13.0 | 500/6000 | 500/6000 |
Also the parameters for the comparison with the DAM are listed. The echo times are calculated relatively to the center of the first sub-pulse for each method.
Phantom Studies
A synopsis of the imaging parameters used for phantom studies at 3.0 T and 7.0 T is shown in Table 1. The basic imaging parameters were kept constant for all methods, including: field of view FOV = (200×200×200) mm3, matrix size of 32×32×16 (plus zero-filling interpolation) and receiver bandwidth BW = 800 Hz/pixel. The echo times were set to the minimum possible value, which depends on the pulse duration of each method. For ΔB0 mapping an inter-echo time of ΔTE = 2.5 ms was used. TRs needed to be prolonged at 7.0 T, in order to accomplish identical SAR levels as at 3.0 T.
A spherical phantom (18 cm diameter), filled with water and doped with 50 mM Na and 20 mM CuSO4, was prepared. This setup provides sufficient RF-loading and short T1 relaxation time (at 3.0 T: T1 ≈ 70 ms, T2 ≈ 40 ms). The latter affords reasonable scan time for the DAM approach.
Ethics Statement
For the in vivo feasibility study, two healthy subjects without any known history of neurovascular disease were included after due approval by the local ethical committee (registration number DE/CA73/5550/09, Landesamt für Arbeitsschutz, Gesundheitsschutz und technische Sicherheit, Berlin, Germany). Informed written consent was obtained from each volunteer prior to the study.
In vivo Studies
Human brain imaging was performed at 3.0 T and 7.0 T in healthy subjects using the five phase-based methods (A-E) and the DAM. FOV was adjusted to (230×230×176) mm3 at 3.0 T and (210×210×160) mm3 at 7.0 T, in order to cover the whole brain with 16 sagittal partitions using a matrix size of 32×32×16 (plus zero-fill interpolation). The inter echo time for the ΔB0 map was set to ΔTE = 2.46 ms at 3.0 T and ΔTE = 3.06 ms at 7.0 T, to make sure that fat and water are in phase for both TEs.
For the DAM approach only a central partition of the brain was acquired, since covering the whole brain would have required several hours of scan time: a constraint that is dictated by the T1 of the brain (gray matter: T1 ≈ 1800 ms, white matter T1 ≈ 1000 ms at 3.0 T [27]), so that the repetition time was set to TR = 6000 ms.
Results
Numerical Simulations
The results derived from the simulations are shown in Figs. 2 and 3. The trajectories of M during excitation (Fig. 2) are used to qualitatively estimate the use of transverse magnetization. The curves displayed in Fig. 3 represent the sensitivities to B1+ variations (expressed as the TotalFA) and frequency offsets (ΔB0 in Hz). The frequency offset range is identical for all the curves, while the total flip angle ranges vary (TotalFA axis), as well as the phase accrual ranges (Ψ axis). Efficiency ε is used to combine the flip angle range and phase accrual characteristics in a single variable that supports a balanced comparison. The values of ε were calculated for each method at the center of the sensitivity curves using Eq. 1.
A – Optimized low-flip-angle method
This method revealed the lowest B1+ sensitivity among all methods, with ε = 0.44 µs/deg. Its sensitivity curve presents a rather flat dependency upon frequency offsets. A discontinuity is observed for some combinations of ΔB0 and TotalFA (Fig. 3A). In terms of usage of the transverse magnetization its composite pulse is equivalent to an excitation of  α (Fig. 2A).
B – Phase-sensitive method
This method shows the highest B1+ sensitivity, with ε = 1.91 µs/deg. For frequency offsets exceeding a range of approximately ±500 Hz the phase accrual Ψ experiences a discontinuity (Fig. 3B). A folding, leading to non-unique phase information which could not be decoded into the B1+ value, can also be observed outside of this range. This method employs the highest transverse magnetization, as the composite pulse is equivalent to a 90° excitation, when α = 90° (Fig. 2B).
C – ФFA-CUP method
This method has a high B1+ sensitivity, with ε = 1.52 µs/deg. The dependency upon frequency offsets is more pronounced than in method A. This method does not present the discontinuities observed for methods A and B (Fig. 3C). The use of transverse magnetization is equal to p0 (Fig. 2C). Its value can be chosen equal to the Ernst angle in order to optimize the signal, without affecting the B1+ sensitivity. This is not possible for methods A and B.
D – Bloch-Siegert method
This method exhibits a low B1+ sensitivity, with ε = 0.66 µs/deg, because it requires a much larger TotalFA compared to the other methods. This results also in a longer pulse duration, which manifests itself in a TE prolongation. The sensitivity curve of this method presents a rather modest dependency upon frequency offsets (Fig. 3D). The use of transverse magnetization depends only on the initial excitation p0 (Fig. 2D), and can therefore be controlled, like for method C.
E – Orthogonal-pulses method
This method presents an intermediate B1+ sensitivity, with ε = 0.82 µs/deg. Its sensitivity curve shows a non-negligible dependency upon frequency offsets. A reduced B1+ sensitivity was observed for small flip angles versus the high flip angle regime (Fig. 3E). In terms of usage of the transverse magnetization the composite pulse used is equivalent to a flip angle larger than α (at small flip angles it is equal to  α, like for method A) (Fig. 2E).
Phantom Studies
The results derived from phantom experiments at 3.0 T and 7.0 T are shown in Figs. 5 and 6. All maps present the typical behavior of a birdcage resonator, where B1+ is higher at the center. At 7.0 T, due to destructive interference patterns, some areas around the center present a lower intensity.
Figure 6. B1+ maps in phantom at 7.0 T.
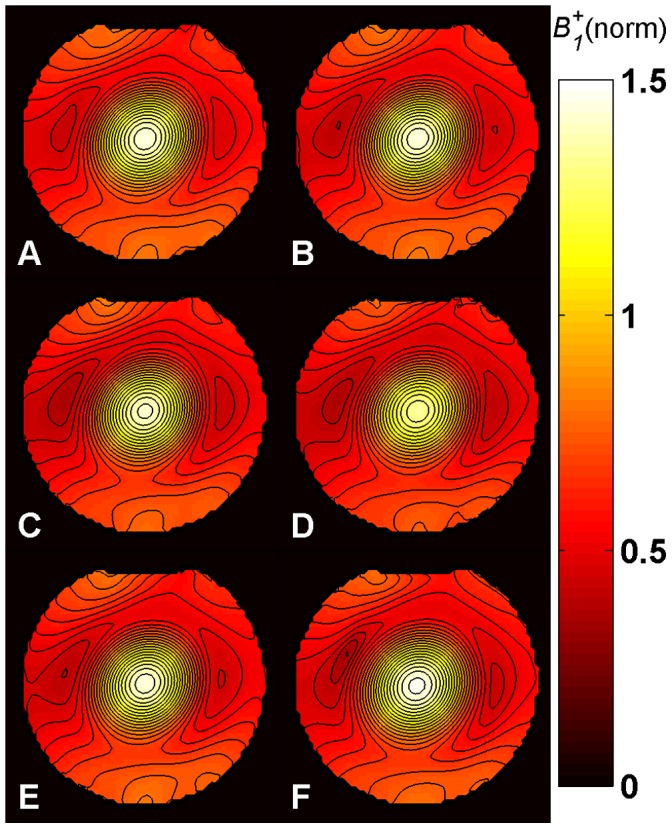
Central axial partition of the 3D B1+ maps obtained with methods A-E in phantom at 7.0 T using a birdcage TX/RX coil. Identical repetition times (TR = 110 ms) and SAR levels were used for all methods. The same partition of the B1+ map acquired for comparison with the DAM with TR = 500 ms is also shown (F). All maps are normalized to their nominal B1+ given in Table 1 in µT. The typical central spot of the birdcage TX/RX coil and the destructive interference patterns around it are visible. The contour plots (with contour increment of 0.05) show that the B1+ distributions obtained from the phase-based methods are consistent with the DAM. Methods: A – Optimized low-flip-angle method , B – Phase-sensitive method , C – ΦFA-CUP method , D – Bloch-Siegert method, E – Orthogonal-pulses method, F – Double Angle method.
The B1+ maps obtained with methods A-E (Figs. 5–6, A–E) are compared to the DAM approach (Figs. 5–6, F).
B0 inhomogeneities can be observed at the air-water interface from the ΔB0 maps shown in Fig. 4 (top), especially at 7.0 T. However, the fit performed using the sensitivity curves provides a very good estimation of B1+ in these regions. Even for the phase-sensitive method (B), the ФFA-CUP method (C) and the orthogonal-pulses method (E) which are most sensitive to frequency offsets. This is confirmed by the contour plots in Figs. 5 and 6. Compared to the DAM no B1+ distortion can be observed in these areas.
All methods revealed sufficient signal, as the T1 of the phantom was short enough (T1 ≈ 70 ms) to allow recovery of the magnetization.
In vivo Studies
The results of the human brain studies at 3.0 T and 7.0 T are summarized in Figs. 7 and 8. The results obtained with methods A–E (Figs. 7–8, A–E) for brain regions are in agreement with the DAM (Figs. 7–8, F). The typical B1+ peak of a birdcage coil can be observed at the center of the brain both at 3.0 T and 7.0 T. At 7.0 T a region of signal void due to destructive interference is visible in the area of the cerebellum. It should be noted that all methods except the Bloch-Siegert method (D) present some regions where the B1+ estimation is not correct, both at 3.0 T and at 7.0 T. This is due to the 3.5 ppm chemical shift between fat and water (corresponding to a resonance frequency difference of 150 Hz/T). The individual phases of water and fat signals are affected by the presence of B1+ inhomogeneities and frequency offsets, as demonstrated by the sensitivity curves (Fig. 3). Since the signal from each pixel is given by the complex sum of these two components, the resulting phase is decoded into a wrong B1+ value during the fitting. In fact, the ΔB0 maps shown in Fig. 4 (bottom) do not account for this effect, as they were acquired with fat and water in phase. Due to air-tissue interfaces, strong B0 offsets were observed in the sphenoid sinuses area, extending into the interior of the brain. The correction fit performs correctly in this region.
Figure 7. B1+ maps in vivo at 3.0 T.
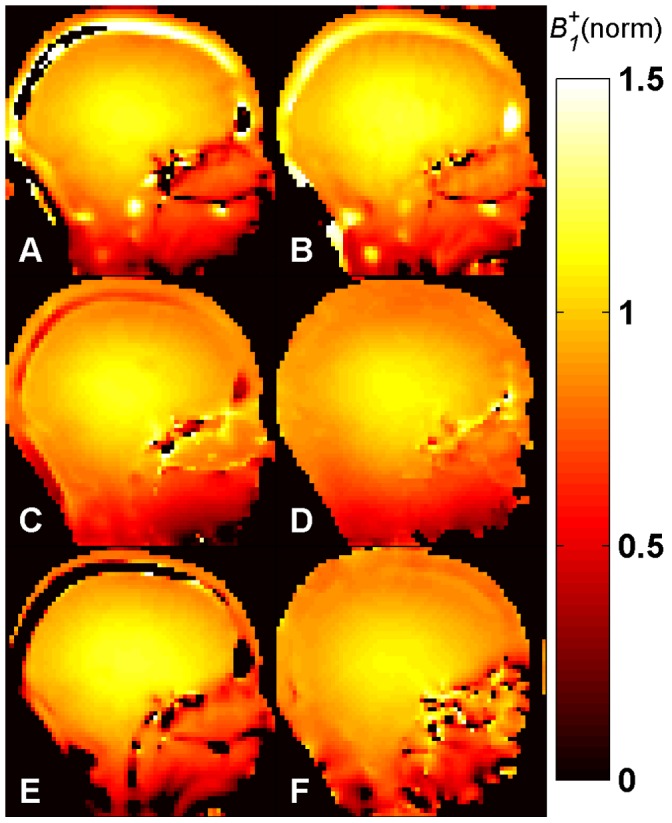
Central sagittal partition of the 3D B1+ maps of the human brain obtained with methods A-E in vivo at 3.0 T using a birdcage TX/RX coil. Identical repetition times (TR = 30 ms) and SAR levels were used for all methods. The central slice of the B1+ map acquired for comparison with the 2D DAM, with TR = 6000 ms, is also shown (F). All maps are normalized to their nominal B1+ given in Table 1 in µT. Methods: A – Optimized low-flip-angle method , B – Phase-sensitive method , C – ΦFA-CUP method , D – Bloch-Siegert method, E – Orthogonal-pulses method, F – Double Angle method.
At 7.0 T the Bloch-Siegert method (D) shows SNR loss in the regions with short T2*, such as the areas nearby the bones.
Discussion
In this work five phase-based methods used for B1+ mapping have been examined carefully at magnetic field strengths of 3.0 T and 7.0 T. The characteristics of each method were analyzed by means of numerical simulations, phantom studies and in vivo experiments.
Although all methods have in common the use of a complex RF-pulse (composite or off-resonance pulse) for excitation, in conjunction with the same gradient-echo readout scheme, it is shown here that the five methods exhibit different sensitivities to B1 + inhomogeneities and frequency offsets. Furthermore they make different use of transverse magnetization and hence reveal different SNR, depending on the TR/T1 ratio. For these reasons, the quality of the B1+ maps obtained from each method depends on the specific experimental conditions (T1, T2*, frequency offset and dynamic range of B1+ in the region of interest) and on the parameters settings (TR, TE, flip angles and duration of the RF-pulse).
In this work, a fixed TR and an identical SAR level were used for all methods to compare their performances under fast imaging conditions. This approach was chosen deliberately since SAR limits dictate the minimum TR achievable, especially at high and ultrahigh magnetic field strengths. Within these limits all phase-based methods support short TR, since full relaxation of the longitudinal magnetization is not required prior to each excitation. Due to this SAR restriction the feasibility of using short TRs varies for each method, and depends primarily on the characteristics for the small nominal flip angle regime. The main challenge in the small flip angle regime is achieving enough B1+ sensitivity, given by the phase accrual. In order to quantify the ability of each method to convert the employed RF-power into the B1+ information, efficiency, which is defined as the specific phase accrual per unit SAR, was examined carefully. The phase-sensitive method (B) showed the best efficiency, followed by the ФFA-CUP method (C), the orthogonal-pulses method (E), the Bloch-Siegert method (D) and the optimized low-flip-angle method (A). According to our results, the use of very short TRs in conjunction with methods which have a low efficiency results in highly noise-corrupted B1+ maps [28].
Another important characteristic for the quality of the resulting B1+ maps is represented by the consumption of longitudinal magnetization. Since the SNR of phase images is directly proportional to that of magnitude images, the amount of longitudinal magnetization available at each repetition should support the phase measurements with enough signal, in order to provide reliable phase images. In this regard, the ФFA-CUP method (C) and the Bloch-Siegert method (D) are superior to the others. In fact the pulses used by these two methods include an initial excitation which is independent from the B1+ sensitization. To optimize the SNR this initial excitation can be set to the Ernst-angle. According to the simulations the phase-sensitive method (B), which provides the highest efficiency, uses the largest transversal magnetization and may be affected by a severe SNR drop when the TR/T1 ratio is too small [28]. The large use of transverse magnetization could be useful if another reading module, such as EPI, is used. However this approach bears the risk to result in geometric distortion artifacts, due to magnetic field inhomogeneities, which pose a significant challenge [29], especially at 7.0 T.
It should be noted that B 1 + mapping is not a problem limited to proton MRI. For instance the phase-sensitive method (B) has been applied to 23Na MRI [30], where the low MRI signal and the short relaxation time T1 require a large use of transverse magnetization, without incurring in saturation effects. On the other hand, the optimized low-flip-angle method (A) and the ФFA-CUP method (C) were originally proposed for low field MRI using hyperpolarized 3He [14], [17], [18], were the frequency offsets are not significant, and the longitudinal magnetization needs to be preserved.
For all methods, except the Bloch-Siegert method (D), the knowledge of ΔB0 is required to perform a correct fitting to obtain the B1+ magnitude. This may require additional scan time. However, the acquisition of a second echo is feasible and affords the ΔB 0 mapping with no extra scan time. In any case, localized B0 shimming would further improve the results. For these methods the presence of the fat-water chemical shift may affect the estimation of B1+, as the ΔB 0 maps do not account for this effect. In this case a fat-water separation approach could be eventually applied to remove artifacts.
All the five methods revealed that the sensitivity change induced by frequency offsets (ΔB0 direction) would be reduced for shorter pulse durations. Also the frequency offsets, at which the discontinuities observed for the optimized low-flip-angle method (A) and the phase-sensitive method (B) occur, could be shifted away from the chosen range of ±1 kHz, as they are inversely proportional to the pulse duration. On the downside this approach would hamper the efficiency ε (Eq. 1), since the SAR is increased for shorter RF-pluses due to the increase in the peak power necessary to achieve the same flip angle.
Among the methods used here, the Bloch-Siegert method (D) was found to be the least sensitive to ΔB0 offsets and chemical shift effects, due to its flat sensitivity curve in the frequency offset direction.
Unlike all the other methods, the Bloch-Siegert method (D) supports also 2D mapping. This can be beneficial when time constraints do not allow for a full 3D acquisition; for example for B1+ mapping of the heart, where scan time constraints dictated by cardiac and respiratory motion need to be managed carefully. On the other hand the Bloch-Siegert method (D) presents a smaller efficiency than the phase-sensitive method (B), the ФFA-CUP method (C) and the orthogonal-pulses method (E), and requires the longest pulse duration among all the methods. This feature results in SNR degradation for short T2* regions, such as interfaces with strong susceptibility gradients.
As our work is focused on the excitation pulse, results are derived using a standard 3D gradient-echo sequence, a Cartesian k-space sampling scheme and a single channel TX/RX coil. However, all the methods are inherently compatible with other 3D-imaging modules and k-space sampling schemes, as long as the phase information is preserved. Therefore all the methods can be accelerated using multi-echo techniques, or k-space undersampling techniques. This can be useful for B1+ mapping applications in other organs, including cardiac or abdominal MRI where physiological motion constraints dictate the viable window of data acquisition.
Conclusion
The B1+ mapping techniques examined here provided characteristics which underline the capabilities of phase-based methods, including the scan time advantage over conventional magnitude-based B1+ mapping methods. All presented methods can be adjusted to provide enough B1+ sensitivity without exceeding the clinical SAR limits. However, some characteristics, such as the sensitivity to B1+ inhomogeneities and frequency offsets and the consumption of longitudinal magnetization, are different for each method. This has an impact on the performance, depending on the specific experimental conditions.
Funding Statement
This study was funded through institutional funding by the Max Delbrück Centrum for Molecular Medicine. The funders had no role in study design, data collection and analysis, decision to publish, or preparation of the manuscript.
References
- 1. Zhu Y (2004) Parallel excitation with an array of transmit coils. Magn Reson Med 51: 775–784. [DOI] [PubMed] [Google Scholar]
- 2. Ullmann P, Junge S, Wick M, Seifert F, Ruhm W, et al. (2005) Experimental analysis of parallel excitation using dedicated coil setups and simultaneous RF transmission on multiple channels. Magn Reson Med 54: 994–1001. [DOI] [PubMed] [Google Scholar]
- 3. Katscher U, Bornert P, Leussler C, van den Brink JS (2003) Transmit SENSE. Magn Reson Med 49: 144–150. [DOI] [PubMed] [Google Scholar]
- 4. Insko EK, Bolinger L (1993) Mapping of the radiofrequency field. J Magn Reson A 103: 83–85. [Google Scholar]
- 5. Stollberger R, Wach P (1996) Imaging of the active B1 field in vivo. Magn Reson Med 35: 246–251. [DOI] [PubMed] [Google Scholar]
- 6. Cunningham CH, Pauly JM, Nayak KS (2006) Saturated double-angle method for rapid B1+ mapping. Magn Reson Med 55: 1326–1333. [DOI] [PubMed] [Google Scholar]
- 7. Yarnykh VL (2007) Actual flip-angle imaging in the pulsed steady state: a method for rapid three-dimensional mapping of the transmitted radiofrequency field. Magn Reson Med 57: 192–200. [DOI] [PubMed] [Google Scholar]
- 8. Klose U (1992) Mapping of the radio frequency magnetic field with a MR snapshot FLASH technique. Med Phys 19: 1099–1104. [DOI] [PubMed] [Google Scholar]
- 9. Dowell NG, Tofts PS (2007) Fast, accurate, and precise mapping of the RF field in vivo using the 180 degrees signal null. Magn Reson Med 58: 622–630. [DOI] [PubMed] [Google Scholar]
- 10. Akoka S, Franconi F, Seguin F, Le Pape A (1993) Radiofrequency map of an NMR coil by imaging. Magn Reson Imaging 11: 437–441. [DOI] [PubMed] [Google Scholar]
- 11. Stanisz GJ, Odrobina EE, Pun J, Escaravage M, Graham SJ, et al. (2005) T1, T2 relaxation and magnetization transfer in tissue at 3T. Magn Reson Med 54: 507–512. [DOI] [PubMed] [Google Scholar]
- 12. Morrell GR, Schabel MC (2010) An analysis of the accuracy of magnetic resonance flip angle measurement methods. Phys Med Biol 55: 6157–6174. [DOI] [PubMed] [Google Scholar]
- 13.Storey P, Wiggins GC, Santoro D, Sodickson DK (2009) Optimization of a low-flip-angle phase-based 3D B1 mapping technique for high field applications. In Proceedings of the 17th Annual Meeting of ISMRM, Honolulu, USA: 374. [Google Scholar]
- 14.Mugler JPI, Miller GW, Altes TA, de Lange EE, Brookeman JR (2005) A Low-Flip-Angle, Phase-Based Method for Accurately Calibrating the Transmitter in Hyperpolarized-Gas MRI. In Proceedings of the 13th Annual Meeting of ISMRM, Miami Beach, USA: 789. [Google Scholar]
- 15.Mugler JPI, Miller GW (2007) Rapid 3D Mapping of the B1 Field Using a Low-Flip-Angle, Phase-Based Method with Improved Sensitivity. In Proceedings of the 15th Annual Meeting of ISMRM, Berlin, Germany: 351. [Google Scholar]
- 16. Morrell GR (2008) A phase-sensitive method of flip angle mapping. Magn Reson Med 60: 889–894. [DOI] [PubMed] [Google Scholar]
- 17.Santoro D, Rivoire J, Meise FM, Terekhov MV, Schreiber WG (2009) Optimized Sensitivity for 3D Mapping of the B1 Field Using a Phase-Based Method. In Proceedings of the 17th Annual Meeting of ISMRM, Honolulu, USA: 2611. [Google Scholar]
- 18. Santoro D, Rivoire J, Meise F, Terekhov M, Salhi Z, et al. (2011) Three-dimensional mapping of the B1 field using an optimized phase-based method: application to hyperpolarized 3He in lungs. Magn Reson Med 65: 1166–1172. [DOI] [PubMed] [Google Scholar]
- 19.Santoro D, Lindel T, Dieringer M, Renz W, Niendorf T (2010) ФFA CUP: PHase based Flip Angle Calibration Using the P0 pulse for proton MRI at 7T. In Proceedings of the 18th Annual Meeting of ISMRM, Stockholm, Sweden: 4943. [Google Scholar]
- 20. Sacolick LI, Wiesinger F, Hancu I, Vogel MW (2010) B1 mapping by Bloch-Siegert shift. Magn Reson Med 63: 1315–1322. [DOI] [PMC free article] [PubMed] [Google Scholar]
- 21.Saranathan M, Khalighi MM, Kerr AB, Rutt B (2011) Fast 3D B1+ mapping using an optimized, asymmetric Bloch-Siegert method. In Proceedings of the 19th Annual Meeting of ISMRM, Montreal, Canada: 577. [Google Scholar]
- 22.Khalighi MM, Rutt BK, Saranathan M, Kerr AB (2011) RF Pulse Optimization for Bloch-Siegert B1+ Mapping. In Proceedings of the 19th Annual Meeting of ISMRM, Montreal, Canada: 4431. [Google Scholar]
- 23. Chang YV (2012) Rapid B1 mapping using orthogonal, equal-amplitude radio-frequency pulses. Magn Reson Med 67: 718–723. [DOI] [PMC free article] [PubMed] [Google Scholar]
- 24. Bloch F, Siegert A (1940) Magnetic resonance for nonrotating fields. Phys Rev 57: 522–527. [Google Scholar]
- 25. Park HW, Kim YH, Cho ZH (1988) Fast gradient-echo chemical-shift imaging. Magn Reson Med 7: 340–345. [DOI] [PubMed] [Google Scholar]
- 26.IEC-60601-2-33 (2010) Medical electrical equipment - Part 2–33: Particular requirements for the basic safety and essential performance of magnetic resonance equipment for medical diagnosis. Edition 30.
- 27.Nehrke K, Bornert P (2012) DREAM-a novel approach for robust, ultrafast, multislice B(1) mapping. Magn Reson Med. [DOI] [PubMed]
- 28.Carinci F, Santoro D, von Samson Himmelstjerna F, Lindel T, Dieringer M, et al. (2011) Characterization of four phase-based methods for 3D B1+ mapping at 3T and 7T. In Proceedings of the 28th annual meeting of the ESMRMB, Leipzig, Germany: 46. [Google Scholar]
- 29. Yang QX, Wang J, Smith MB, Meadowcroft M, Sun X, et al. (2004) Reduction of magnetic field inhomogeneity artifacts in echo planar imaging with SENSE and GESEPI at high field. Magn Reson Med 52: 1418–1423. [DOI] [PubMed] [Google Scholar]
- 30. Allen SP, Morrell GR, Peterson B, Park D, Gold GE, et al. (2011) Phase-sensitive sodium B1 mapping. Magn Reson Med 65: 1125–1130. [DOI] [PMC free article] [PubMed] [Google Scholar]


