

Abstract
Higher-order genome organization shows tissue-specific patterns. However, functional relevance and the mechanisms shaping the genome architecture are poorly understood. Here we report a profound shift from promiscuous to highly selective genome organization that accompanies the effector lineage choice of differentiating T cells. As multipotent naive cells receive antigenic signals and commit to a T helper (Th) pathway, the genome-wide contacts of a lineage-specific cytokine locus are preferentially enriched for functionally relevant genes. Despite the establishment of divergent interactomes and global reprogramming of transcription in Th1 versus Th2, the overall expression status of the contact genes is surprisingly similar between the two lineages. Importantly, during differentiation, the genomic contacts are retained and strengthened precisely at DNA binding sites of the specific lineage-determining STAT transcription factor. In cells from the specific STAT knock-out mouse, the signature cytokine locus is unable to shed the promiscuous contacts established in the naive T cells, indicating the importance of genomic STAT binding. Altogether, the global aggregation of STAT binding loci from genic and nongenic regions highlights a new role for differentiation-promoting transcription factors in direct specification of higher-order nuclear architecture through interacting with regulatory regions. Such subnuclear environments have significant implications for efficient functioning of the mature effector lymphocytes.
Differentiation is a progressive process in which a progenitor cell is altered to become specialized for its physiological function. Contextual input can stimulate appropriate cell differentiation pathways that endow the cells with characteristic morphology and phenotype. This cellular specialization reflects reprogramming of gene expression orchestrated by several mechanisms, including actions of fate-determining transcription factors, modification of chromatin structure, and DNA methylation (Aune et al. 2009; Kanno et al. 2011). Importantly, the dynamic gene reprogramming occurs in the context of a spatially organized nucleus (Joffe et al. 2010). A potential role of nuclear higher-order organization in regulating cell-specific transcription is suggested by fluorescence in situ hybridization (FISH) observations showing that some functionally important genes reposition during lymphocyte differentiation in a manner correlated with expression (Brown et al. 1999; Kosak et al. 2002; Hewitt et al. 2004; Kim et al. 2004; Spilianakis et al. 2005; Joffe et al. 2010). However the functional role of this positioning is not clear. For example, while silent genes tend to reside in inactive subnuclear environments such as heterochromatic regions at nuclear periphery or pericentromeric loci, some activated genes remain close to the periphery, precluding a simple model (Hewitt et al. 2004). Moreover, little is known about the underlying mechanisms that establish the nonrandom nuclear three-dimensional (3D) architecture during differentiation, and how the organization relates to the cell function. Understanding the role of nuclear architecture in regulating the transcriptional program would require comprehensive exploration of the dynamics of chromatin interactions.
Differentiation of multipotent naive CD4+ T cells to mature effector lymphocytes is critical for proper adaptive immune responses. Activation of naive CD4+ T cells from the initial antigen encounter induces specific differentiation into T helper (Th) cells that mount an appropriate phenotype of immune response to the particular pathogen, such as Th1, Th2, and Th17 (Murphy and Reiner 2002; Zhu et al. 2010; Nakayamada et al. 2012). A hallmark of Th1/Th2 distinction is the production and secretion of lineage-specific cytokines by differentiated T cells, interferon gamma (IFNG) for Th1 and interleukin 4 (IL-4) for Th2 (Wilson et al. 2009; Balasubramani et al. 2010; Zhu et al. 2010; Kanno et al. 2011). The commitment of naive cells to either Th1 or Th2 is modulated by the differentiation signals transmitted through members of the signal transducer and activator of the transcription (STAT) protein family (Adamson et al. 2009; Zhu et al. 2010). The early-acting STAT proteins are critical for Th lineage specification, whereas transcription factors such as NFKB, AP-1, and NFAT respond to T-cell receptor (TCR) signaling that occurs universally during differentiation for all Th lineages (Isakov and Altman 2002). These transcription factors modify the gene expression program to direct the proper course of differentiation and enforce the lineage-specific function. Notably, accumulating studies document abundance of nongenic binding sites for most transcription factors, suggesting that the spatial encounters between genomic loci are important for their genome-wide effects (Biddie et al. 2010; Hakim et al. 2010; Wei et al. 2010; John et al. 2011).
In this study, we report a striking global reorganization of the nuclear architecture that occurs in naive T cells as they take on one of the two distinct fates, Th1 or Th2. We provide genetic and molecular evidence that the lineage-inducing transcription factors, STAT proteins, play a critical role in specifying such a functional nuclear architecture through their direct association with genic and nongenic loci.
Results
Lineage-specific interchromosomal association of key genes for Th cell function
To determine the functional features of the Th1/Th2-specific nuclear architecture, we first examined whether genes critical for Th cell function associate preferentially in the relevant Th lineage, by 3D DNA FISH. Th1 cells express high levels of Ifng as well as Furin, encoding a Th1-specific proprotein convertase that enhances IFNG secretion (Pesu et al. 2006). We found that Ifng (chromosome 10) and Furin (chromosome 7) are more proximal in Th1 cells in comparison to Th2 cells where the two genes are silenced (Fig. 1A). To investigate whether there is a similar proximal localization of functionally related genes in Th2 cells, we analyzed the spatial positioning of the cluster of Th2-specific interleukin genes (Il4, Il5, and Il13) and Gata3, the gene encoding GATA binding protein 3, the master transcriptional regulator for the Th2 lineage. Indeed, the Th2 cytokine locus (chromosome 11) is preferentially associated with Gata3 (chromosome 2) in Th2 cells (Fig. 1B). These cell type-specific differences in interchromosomal association were modest but intriguing patterns to warrant a comprehensive characterization of the full environment of these genes. We hypothesized that the T-cell functional branch-out differentiation would be a physiological system, allowing us to assess the potential role of nuclear architecture in cellular function.
Figure 1.

Cell type-specific interchromosomal association between functionally related genes in T lymphocytes. (A) 3D DNA FISH of Ifng and Furin in Th1 and Th2 lymphocytes. Representative projections of images and cumulative frequency of 3D distance are shown. Green foci indicate Ifng; red foci, Furin; and blue, DAPI staining. Scale bar, 5 microns. (n) Number of cells analyzed for Th1 (red curve) and Th2 (blue curve). (B) Similar analysis for the Il4 locus (green foci) and Gata3 (red foci). (C) Ifng 4C contact profiles at the Furin locus showing preferential contact in Th1 cells. (D) Il4 4C contact profiles at the Gata3 locus showing preferential contact in Th2 cells. (E) Th1-specific association of Ifng with Socs2, Il2rb, Traf3ip2, and ANKRD4 loci. Genomic coordinates in Mb (mm8). Th1 in red and Th2 in blue throughout the figures.
The interaction network of Ifng in Th1 lymphocytes is distinct from that in Th2 and contains T-cell-specific genes
For a comprehensive identification of the full spectrum of Ifng contact loci, we performed the genome-wide chromosome conformation capture on chip (4C) assay (Simonis et al. 2006) with Ifng as the bait. We initially focused on Ifng because, as the only gene in the surrounding 300-kb region on the mouse chromosome, it is expected to be a major determinant of the locus positioning. Thus we reasoned that the contact landscape of Ifng may permit a better delineation of the principles underlying Th cell-specific nuclear architecture (Misteli 2007). The Ifng 4C profile indeed reveals that Ifng associates precisely with the Furin locus but not with a flanking region, which could not be ascertained with the resolution of DNA FISH (Fig. 1C). We further confirmed that contact profiles from our 4C analysis reflect quantitative association frequencies by 3D DNA FISH, observing high concordance between these assays (Fig. 1A–D; Supplemental Fig. S1).
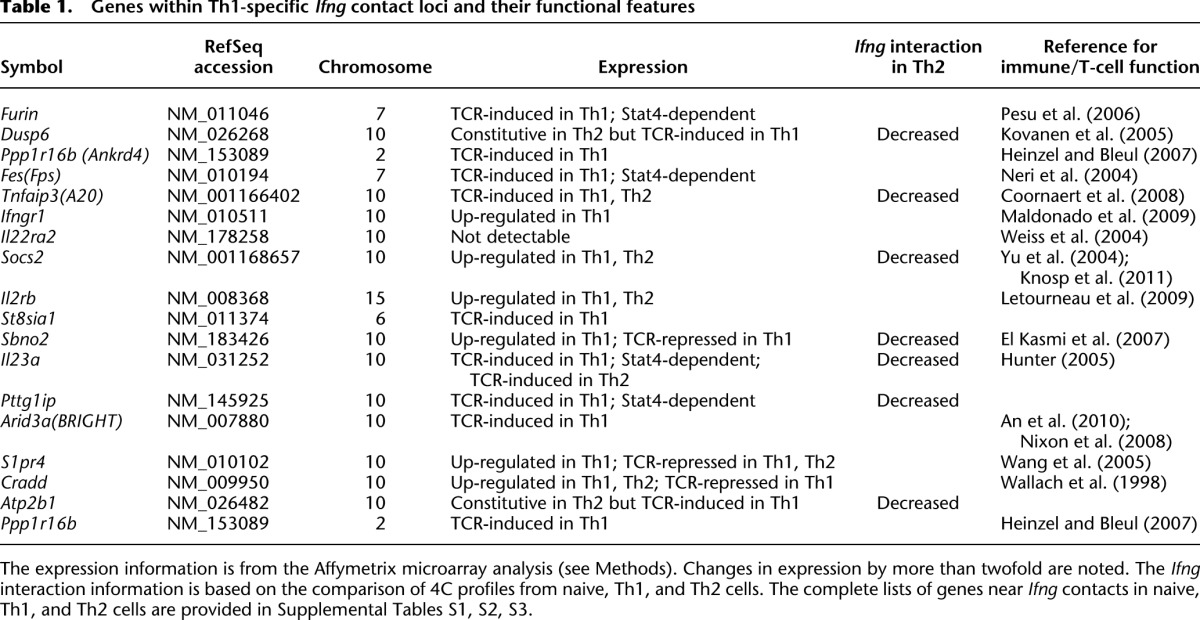
Inspection of the Ifng interactome revealed a large number of Th1-specific genes and other immune pathway genes (e.g., Furin, Ifngr1, Tnfaip3 [also known as A20], Socs2, Il2rb) that interact with Ifng in Th1 cells but not in Th2 cells (Figs. 1E, 2; Table 1; Supplemental Tables S1, S2). Indeed, a gene ontology analysis of all the genes on Ifng contacts from Th1 showed an enrichment for genes involved in immune responses, signaling, and anti-microbial defense responses (Supplemental Fig. S2). For additional functional insight, Affymetrix microarray analysis was performed to monitor gene expression changes during Th1/Th2 differentiation and the response to TCR activation of the differentiated cells. Remarkably, many of these Ifng contact genes were induced by TCR signaling in Th1 (Furin, Dusp6, Fes [also known as Fps], Ppp1r16b [also known as Ankrd4], Arid3a [also known as BRIGHT]). Interestingly, some of the genes in Th1-specific contacts (Dusp6, Atp2b1) are TCR-responsive only in Th1, while not interacting with Ifng and constitutively expressed in Th2. These Th1 genes are silenced but poised to be activated specifically in Th1 cells. These findings together indicate a functional aspect of the spatial association of these genes.
Figure 2.

Lineage-specific reorganization of the Ifng interactome. The genomic map of Ifng contacts in the naive (A), Th1 (B), and Th2 (C) lymphocytes shows the locations of positive 4C probes (P-score > 4; see Methods) marked in a color scale with red corresponding to high contact frequency (log2 ratio of 4C/input DNA). (Gray) Locations of all other probes. (Arrowhead) Location of Ifng. The genes that reside in dramatically gained contact loci in Th1 (B) or lost contact loci in Th2 (C) are listed. (D,E) Examples show selection from pre-existing contacts in naive cells as well as emergence of de novo contacts in the differentiated cells. (*) Retained contacts; (+) gained contacts. (F) The Ifng contact regions that are detected from each cell type. The Venn diagram areas are drawn in proportion to the numbers of probes in each category of overlaps.
Table 1.
Genes within Th1-specific Ifng contact loci and their functional features
The contact repertoires of Ifng in the Th1 and Th2 cell types are highly disjoint such that roughly half of the contacts are cell type-specific (Fig. 2B,C,F). The divergence is formed despite the fact that the majority of the contacts (90% and 93% in Th1 and Th2, respectively) are on the cis chromosome. The interchromosomal interactions are also highly lineage-specific, with only 1% of trans contacts in Th1 shared by Th2. The observed cell type specificity is robust despite the fact that the two Th cell types emerge from the naive T lymphocytes after differentiation for only 1 wk. To understand the mechanism behind the specification of nuclear architecture during lineage commitment, we decided to look into the dynamics of the process and examined the original spatial environment of Ifng in naive T cells.
In naive T cells, transcriptionally inactive Ifng has promiscuous interactions with gene-rich regions
Analysis of Ifng interactome in naive T cells revealed an exceptionally large number of genomic contacts (12,201 positive probes [3.2% of all probes, comprising 419 genomic regions] from naive vs. 5291 [1.4%, 222 regions] and 6254 [1.6%, 256 regions] positive probes from Th1 and Th2, respectively) (Fig. 2). In terms of genes present in the contact loci, the number of Ifng contact genes decreases from 1117 in the naive cells to 638 in Th1 and 506 in Th2 cells. Importantly, the vast majority of the Ifng contacts in the committed cells (88% and 65% of positive probes from Th1 and Th2, respectively) are pre-established in the naive cells (Fig. 2F). A closer examination shows that the contact regions are often broad in naive cells, but are more localized in the differentiated cells (Fig. 2D). These data indicate that the interactome of Ifng undergoes a massive divergent selection during Th1/Th2 cell differentiation, primarily by elimination of promiscuous genomic associations in naive cells.
Despite the predominant trend of reduced interactions, there were genomic loci that acquire Ifng contact specifically in Th1. Interestingly, these contacts harbor many Th1-relevant genes (Fig. 2B,D,E; Supplemental Tables S1–S3). Moreover, interactions with a subset of the genes that come into the subnuclear environment of Ifng during Th1 differentiation are lost instead in Th2-differentiated cells (Fig. 2B,C). In addition, some of the genes that lose contact with Ifng during Th1 differentiation increase interaction with Ifng in Th2. These overlaps between reciprocally gained/lost gene contacts are far greater than expected by chance (P < 10−4, Fisher exact test). These results suggest an exquisitely coordinated lineage specification of the nuclear architecture around the Ifng locus.
A stark contrast was observed for the Ifng interactome when we performed the 4C analysis on 3T3-L1 mouse embryonic fibroblasts, an unrelated cell type (Supplemental Fig. S3). In the fibroblasts, the contact landscape of Ifng is limited to gene-poor regions, despite a comparable number of contact loci (data not shown). Notably, only a negligible fraction of the abundant Ifng contacts in the naive T lymphocytes (5% of positive probes) is shared with 3T3-L1. Comparison of fibroblasts and naive lymphocytes highlights the observation that, even though the Ifng gene is inactive in both cell types, an enormous contact repertoire exists only in the naive T cells and is poised to diverge into lineage-selective profiles.
The Th1-selective nuclear architecture at Ifng requires STAT4
The fate of naive CD4+ T lymphocytes is largely determined by the transcription factors acting downstream from the cytokines that promote differentiation into a specific lineage. STAT4 plays a crucial early role by mediating the signal from the Th1-inducing cytokine IL-12 and activating transcription of T-box expressed in T cells (T-bet). This constitutes a feed-forward regulatory circuit that promotes a fully mature Th1 phenotype and IFNG secretion (Lighvani et al. 2001). Another member of the STAT family, STAT6, responds to IL-4 signaling instead and directs the differentiation toward the Th2 lineage. Given the importance and specificity of STAT4 for Th1 differentiation, we examined its effects on nuclear architecture around Ifng.
To determine whether the Th1 interactome can develop without STAT4, we isolated naive CD4+ T cells from Stat4 knock-out (KO) mice, subjected them to the Th1 differentiation protocol, and analyzed the Ifng contacts by 4C. The global reduction in Ifng interactions was severely hampered in the KO Th1 cells, suggesting incomplete specification of Th1-selective organization (Fig. 3A–C). The absence of STAT4 affected both the gain (downward arrows) and the loss (upward arrows) of Ifng interactions seen in wild-type (WT) cells (Fig. 3; Supplemental Fig. S4). Given that the TCR-mediated molecular pathways are intact in the Stat4 KO T cells, it is noteworthy that the TCR signaling, common to all Th lineages, is not sufficient to generate the Ifng interactome in Th1 cells. We conclude that the nuclear architecture in the Stat4 KO cells is promiscuous and less specialized, resembling the state of undifferentiated cells.
Figure 3.

STAT4 knock-out T cells fail to develop Th1-specific Ifng interactome. (A,B) Examples of Ifng contacts in naive (green), Stat4 KO (pink), and Th1 (red) cells in trans (A) and cis (B). Stat4 KO cells fail to induce (A) or eliminate (B) specific contacts. (Arrows) Contact loci that are disrupted in KO versus WT Th1. (C) The overlaps between contacts from naive, Th1, and Th1-induced Stat4 KO. The areas are drawn in proportion to the numbers of probes in each category of overlaps.
The overall transcriptional activity of Ifng interactome is similar in Th1 and Th2 despite the lineage-specific expression of Ifng and divergent contact selection
The failure of the Stat4-deficient cells to generate Th1-selective Ifng contact repertoire may result from the altered reprogramming of gene expression in the absence of STAT4. To understand the contact reorganization in terms of transcription, we first focused on the dynamic component of the Ifng interactome and looked for any correlation with changes in transcription. We identified the genomic loci that dramatically changed their interactions with Ifng during Th1 differentiation, and analyzed the expression profiles of genes within these loci in naive, Th1, and Stat4 KO cells. The genes that come into contact with the activated Ifng in Th1 were found to be more highly expressed than those that lose interaction (Fig. 4A, box plot). This result is mirrored by a reciprocal pattern in the Th2 lineage, where Ifng is silenced (Fig. 4B, box plot). While the dichotomy is striking, an absolute majority of lost or gained contact genes already have similar levels of expression in the naive cells (Fig. 4, heat maps). For example, the expression of genes that gained Ifng contact did not increase appreciably from naive to Th1. Likewise, the gain of Ifng contact in the Th2 lineage did not confer the genes de novo repression from naive to Th2. Importantly, the transcriptional regulation of these dynamic contact genes is largely intact in the absence of STAT4 (Fig. 4, heat maps, rightmost column). This rules out the possibility that the disrupted Ifng interactome from Stat4 KO is purely due to lack of gene regulation by STAT4.
Figure 4.
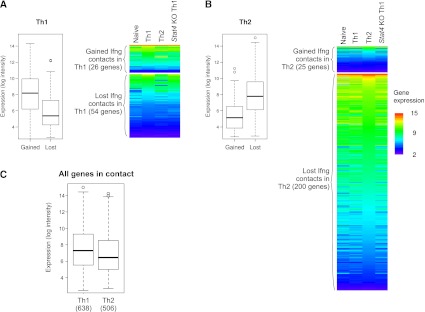
The divergent Ifng contact landscapes in Th1 versus Th2 do not differ significantly in overall transcriptional activity. (A) The expression of the genes on regions that specifically change Ifng interactions was examined in all cell types (see Methods). During Th1 differentiation, Ifng is transcriptionally activated and increases interactions with a set of genes that are robustly expressed in all CD4+ T cells. On the other hand, the loci that lose contact harbor genes whose transcript levels are low throughout. (B) In Th2 cells, the transcriptionally silent Ifng gains numerous interactions with silenced or repressed genes, while losing contact with some highly expressed genes. Box plots show the expression values from the corresponding lineage, Th1 (A) and Th2 (B). The heatmaps include expression data from the other cell types, and are sorted by the expression values in Th1 (A) and Th2 (B) within each category of genes. (C) The expression of all the genes in contact with Ifng in Th1 and Th2 are nonetheless similar. The number in parenthesis indicates the total number of genes in each set.
Unexpectedly, despite the lineage-specific repositioning of genes, the transcriptional activity of the resulting interactome of Ifng is not significantly different between Th1 and Th2 (Fig. 4C). This is because the gene repositioning involved a relatively small number of genes and has a negligible contribution to the overall expression status of Ifng contacts. Thus, the simple concept of Ifng residing in the transcriptionally active compartment in Th1 and in the inactive compartment in Th2 is not valid, even though Ifng is active in Th1 cells but inactive in Th2 cells. These observations indicate that expression alone cannot explain the lineage-specific reorganization of nuclear architecture and the phenotype defect in Stat4 KO T cells, raising the possibility that mechanisms other than expression may play a role.
Changes in Ifng interactions occur at STAT4 binding sites
Given the poor correlation between Ifng interaction dynamics and transcription, we then investigated whether STAT4 may affect nuclear architecture directly. We compared the Ifng 4C data with the STAT4 binding profile in Th1 cells reported recently (Wei et al. 2010). Interestingly, Th1 contact regions are predominantly located at or near STAT4 binding sites (Fig. 5A,B; Supplemental Fig. S4). Moreover, loss of Ifng contact in Th1 tends to coincide with sites that lack STAT4 binding (Fig. 5B, arrow). Vice versa, STAT4 sites are concentrated preferentially on Ifng contacts in Th1, despite the overall reduction of the Ifng interactome from naive to Th1 cells (Fig. 5C). Th1-specific spatial clustering of STAT4 sites is especially dramatic on the cis chromosome: 80% of all STAT4 binding sites on chromosome 10 are located at contact loci in Th1 cells, whereas only 35% of these sites are in contact with Ifng in Th2 cells. Taken together, these results demonstrate that the Ifng interactome developing during Th1 differentiation is selectively enriched for STAT4 binding sites.
Figure 5.
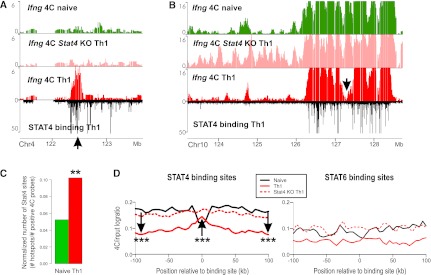
Th1-specific contacts are selected and strengthened at STAT4 binding sites. (A,B) Examples of STAT4 binding (black track) at Ifng contacts in naive (green), Stat4 KO (pink), and Th1 (red) cells in trans (A) and cis (B). (C) The Ifng contact loci have the highest enrichment of STAT4 binding sites in Th1 cells. The plot shows the numbers of Th1-derived STAT4 ChIP-seq sites per positive 4C probe for each 4C data. (**) P-value < 0.01 (permutation test, see Methods). (D) The average profile of Ifng 4C for each cell type centered at STAT4 binding sites. (***) The arrow represents a significant change (t-test P-value < 0.005). The average profile of Ifng 4C for each cell type centered at STAT6 binding sites (in Th2).
For more direct and quantitative appraisal of the role of STAT4 in the nuclear architecture dynamics, we examined the 4C contact profiles at sites bound by STAT4 in Th1 cells. In addition to the enrichment of STAT4 binding sites at Ifng contact loci observed above, Ifng contact probability increases at 61% of all genomic STAT4 sites (4203/6894) (Fig. 5D, STAT4 binding sites plot). Remarkably, the increase is local and precisely at STAT4 binding sites, while the probability of contact with the flanking regions is lower in Th1 (Fig. 5D, black arrows). The larger-scale profiles reveal that the global reduction in Ifng contact probability predominantly occurs in regions flanking these STAT4 sites in Th1, which suggests sharpened repositioning of interaction regions favoring STAT bound sites against the nonspecific backgrounds. Furthermore, the finer repositioning of interaction at STAT4 binding sites was no longer detectable in the Stat4 KO cells (Fig. 5D, dashed curves). The intriguing preference of Ifng interactions for binding sites is not found when we performed the same analysis on a control set of sites from a closely related transcription factor STAT6 that promotes Th2 differentiation instead (Fig. 5D, STAT6 binding sites plot).
On the other hand, the contact profiles of the remaining 39% of STAT4 sites deviate from the pattern described above. These sites are in contact with Ifng in the naive T cells but lose the interaction in Th1 cells, consistent with the global trend from the naive to Th1 (data not shown). It may be relevant to note the observations that lineage-promoting factors not only induce genes that enforce the cell identity but also actively repress genes specific for the other “forbidden” lineages (Usui et al. 2006; Djuretic et al. 2007; Zhuang et al. 2009; Yagi et al. 2010). An alternate plausible possibility is that these STAT4-bound genomic loci that dissociate from Ifng may gain new interactions with other Th1-specific loci. We note that the Th1-specific Ifng interactome contains many but not all Th1 genes. For example, there is no detectable 4C signal at Hlx, Runx3, Twist1, or Zbtb32 (data not shown). Thus it is conceivable that there may be more than one Th1-specific subnuclear hub that congregates STAT4 binding sites in Th1 cells. Together these results strongly suggest that STAT4 binding to the genome contributes to the specification of the nuclear architecture around Ifng during Th1 differentiation.
Reciprocal specification of nuclear architecture around the Il4 locus takes place with Th2 differentiation
To determine if a similar extent of reorganization happens for the Th2 lineage, we analyzed the spatial environment of Il4, a signature cytokine gene highly expressed by Th2 lymphocytes. Il4 manifested a distinct subnuclear environment, with little overlap with Ifng contacts as seen by the disjoint 4C profiles in all cell types (Supplemental Fig. S6B). Nevertheless, many properties found for Ifng were recapitulated in the Il4 4C data (Supplemental Figs. S5, S6). The Il4 interactome also shifts from promiscuous contacts in the naive cells to highly selective partners in Th2 cells (Supplemental Fig. S5). Interestingly, despite the global trend, Il4 gains physical interactions with some Th2-specific genes, including Gata3, Ikzf1, Gatad2a, and Nucb1, in Th2 cells but not in Th1 cells. Ikzf1 encodes Ikaros, a factor that silences T-bet during Th2 differentiation (Thomas et al. 2010). As observed from the Ifng interactome, the overall transcriptional activity of the Il4 contact loci is similar in both cell types, despite their lineage-specific divergence (Supplemental Fig. S6C). Again, this finding is inconsistent with the simple characterization of Il4 interactome based on transcriptional activity.
Mirroring the role of STAT4 in Th1 differentiation, STAT6 responds to the Th2-promoting cytokine IL-4 and trans-activates the signature transcription factor GATA3, enforcing the Th2 lineage (Zhu et al. 2010; Kanno et al. 2011). When we performed the analogous analyses to assess the spatial distribution of STAT6 binding sites in Th2 cells, Il4 contact loci were only slightly enriched for STAT6 sites in Th2, which is not as pronounced as for the Ifng in Th1 (Supplemental Fig. S6D). The more heterogeneous picture may emerge from the immune-irrelevant genes and their ubiquitous activity in the genomic context of Il4 that also contribute to the genome-wide interactions of this locus (Morey et al. 2009). Nonetheless, naive T cells from Stat6 KO mice failed to develop a specialized set of Il4 contact loci under the identical Th2 differentiation condition (Supplemental Fig. S6E,F). We conclude that the absence of STAT6 disrupts the Th2-selective nuclear organization at Il4 in response to Th2-inducing signals.
Discussion
In this study, we show that the T-cell nuclear architecture undergoes a dramatic transition to support the functional specialization of Th effector cells after pathogen encounter. Differentiation of primary CD4+ Th lymphocytes, where multiple lineages branch from the same type of cells, provided a superb model to dissect the functionally relevant changes in nuclear architecture. By comparison with observations from the Th2 lineage, we were able to delineate Th1-specific features of the contact landscape for Ifng. In the naive progenitor cells, genomic interactions of the inactive Ifng locus are surprisingly promiscuous, reflecting a differentiation potential for several permissible lineages. Most of these abundant contacts are lost as lymphocytes commit to the Th1 lineage, giving rise to a highly selective subnuclear environment for Ifng. This is reminiscent of a similar pattern observed for expression: Pluripotent stem cells switch from a broad spectrum of expressed genes to a more restricted program during differentiation, shutting down unnecessary genes while maintaining those relevant for cell function (Terskikh et al. 2003; Efroni et al. 2008). Some genes gain contact specifically in Th1 cells and, interestingly, are important for Th1 function. Many of these strengthened Th1 contacts are eliminated from the neighborhood of Ifng in the Th2 lineage, further highlighting the exquisite cell type specificity of their interactions.
We observe a lack of correlation between nuclear reorganization and transcriptional activity during Th differentiation. Monitoring the dynamics of nuclear organization and the transcriptional program in parallel allowed us to assess the potential role of transcription in driving lineage-specific contact changes. However, as naive cells differentiate to Th1 cells where Ifng becomes active, the locus does not transition into a highly active compartment. Similarly, the interactome of Th2-activated Il4 gene has minimal changes in global expression status before and after differentiation. Moreover, the dynamic contact genes themselves do not exhibit a coordinately regulated expression pattern that correlates with gain or loss of interaction with the cytokine locus. Perhaps the most striking finding that violates the transcription-based model of nuclear organization is that the massive gene-rich repertoire of interactions with Ifng exists in naive cells but not in fibroblasts, even though Ifng is silenced in both cell types. Furthermore, Ifng 4C was not correlated with H3K4me3 and H3K27me3 marks published previously (Wei et al. 2009; data not shown). Consistent with this finding, perturbation of post-translational histone modifications was reported to have no impact in shaping higher-order structures (Splinter et al. 2011; Nora et al. 2012), despite the apparent correlation of their profiles with genome conformation (Lieberman-Aiden et al. 2009; Dixon et al. 2012). These results support that a simple dichotomy based on active and inactive nuclear spatial compartments does not explain the functional reorganization during Th differentiation, pointing to additional mechanisms that underlie the cell type-specific transition of nuclear architecture.
We present genetic and molecular evidence that STAT proteins play a critical role in establishing the functional nuclear architecture of effector Th cells. In the absence of STATs, the highly selective interactome fails to develop. This may be partly due to the abolished transcription of lineage-enforcing genes that are normally activated by STATs. Along this line, a tissue-specific transcription factor was shown to be important for the nuclear organization in erythrocytes (Schoenfelder et al. 2009). But questions still remain whether the factor acts directly or via regulation of gene expression. Different from studies that focused on post-differentiation state, our dynamics-conscious analysis has allowed us to identify, for the first time, contact partner selection as the predominant mechanism behind the formation of a mature architecture during terminal differentiation. An important novel insight is that transcription factor binding (STAT binding to chromatin), rather than transcriptional activity, is a critical factor in shaping the spatial configuration of the genome. STAT4 seems to have a direct role in functional organization of the nuclear architecture, as indicated by the strengthened interactions that occur precisely at its binding sites in Th1. We show that gene expression status is not likely to drive the establishment of nuclear architecture, despite the confounding correlation with the interactome. Our study raises a new paradigm with a potential role for transcription factors as nuclear organizers. Undoubtedly, future studies will need to address the relative contributions of numerous chromatin binding factors to the various hierarchical levels of genome organization (Dixon et al. 2012; Lin et al. 2012; Sexton et al. 2012).
What could be functional implications from a nuclear organization driven by binding of chromatin regulators? One possibility is that such a nuclear architecture may bring together a set of genes that may not necessarily be transcribed immediately but possess the potential to be regulated in response to relevant stimuli. Consistent with this model, many TCR-responsive genes associate with Ifng in the mature cells before transcriptional activation by TCR stimulation. Similar association has recently been observed for hormone-responsive genes before transcriptional activation (Hakim et al. 2011). STAT proteins, like many transcription factors, bind to numerous intergenic regions at considerable distances from any known gene (Wei et al. 2010). The marked spatial clustering of STAT4 binding sites in Th1 cells supports a high local concentration of STAT4 proteins within a close 3D neighborhood of Ifng in the nucleus, potentially facilitating transcriptional regulation (Hakim et al. 2010, 2011; Wang et al. 2011). Recent reports have implicated the presence of regulatory elements, observed as DNase I hypersensitive sites (DHSs), as the most prominent genomic feature within physical DNA interaction regions (Lieberman-Aiden et al. 2009; Hakim et al. 2011; Yaffe and Tanay 2011). In the context of Th cell differentiation, we identify STAT4 as a chromatin factor that binds to such regulatory elements that affect nuclear architecture. STAT4 may be one of several factors that act on the regulatory elements, because cell type-specific regulatory sites can be visited by multiple transcription factors in a combinatorial and cooperative fashion (e.g. Ram et al. 2011; Rao et al. 2011; Siersbaek et al. 2011; Voss et al. 2011). Indeed, some STAT4 binding sites are also bound by T-bet in Th1 (Sekimata et al. 2009; Nakayamada et al. 2011). Structural proteins like CTCF and cohesin are also involved in the long-range association of Ifng with nearby regulatory loci (Hadjur et al. 2009; Sekimata et al. 2009). The contribution of these factors in the establishment of large-scale genome folding remains to be explored, but the fact that many STAT4 binding sites are inaccessible in naive cells (Nakayamada et al. 2011) suggests that STAT4 activation may be an important pioneering event in Th1-specific genome organization. Taken together, these results support that STAT proteins are a major determinant of lineage-specific higher-order structure of the genome.
Our findings elucidate a STAT4-mediated mechanism critical in the formation of a functional nuclear architecture at the Ifng locus. The reorganized interactome represents an important physical mark of committed cells that is hard to reverse, which in turn contributes to the maintenance of the distinct cellular identity. These data provide a basis for understanding how lineage-specific transcription factors not only regulate gene expression but also play a prominent role in shaping a nuclear architecture that supports specialized effector function in cellular differentiation (Fig. 6).
Figure 6.

Selection of contact loci during Th1 differentiation favoring spatial clustering of STAT4 binding sites. A model depicts the transition of the subnuclear interactome of Ifng during Th1 differentiation. In the naive progenitor cells, Ifng is silenced and has promiscuous contacts. Th1-inducing cytokines activate STAT4, and the transcription factor binds to regulatory elements in the genome. Ifng interactome is reorganized predominantly by retaining and strengthening contacts that harbor STAT4 binding sites. The resulting subnuclear environment of Ifng in Th1 supports a high local concentration of STAT4 and other cooperating factors.
Methods
Mice, cell isolation, culture, differentiation
C57BL/6J mice and Stat6 KO mice were purchased from Jackson Laboratory. Stat4 KO mice were provided by Dr. M. Kaplan. All mice were handled and housed in accordance with the guidelines of the National Institutes of Health Animal Care and Use Committee. Splenic and lymph node T cells were obtained by disrupting organs of 8- to 12-wk-old mice. All cell cultures were performed in RPMI supplemented with 10% fetal calf serum, 2 mM glutamine, 100 IU/mL penicillin, 0.1 mg/mL streptomycin, 10 mM Hepes, 1 mM sodium pyruvate, and 2.5 μM β-mercaptoethanol. T cells were enriched with a CD4+ T-cell kit and AutoMacs isolator (Miltenyi Biotec). Naive CD4+ T cells were isolated by flow cytometry, staining with CD4, CD62L, CD44, and CD25 antibodies. Naive T cells were first cultured in the presence of plate-bound anti-CD3 and anti-CD28 (10 μg/mL each) under Th1 (IL-12 [10 ng/mL] and anti-IL-4 [10 μg/mL]) or Th2 (IL-4 [10 ng/mL], anti-IFNG [10 μ?g/mL]) conditions for 3 d and then cultured further in IL-2 (50 U/mL) in combination with IL-12 (Th1) or IL-4 (Th2) and grown an additional 4 d. Cytokines were purchased from R&D Systems. Anti-CD3 and anti-CD28 were from eBioscience and other antibodies were from BD Biosciences.
3D DNA FISH analysis
Cultured T lymphocytes were set on a poly-L-lysine–coated cover slip (BD Biosciences) by centrifugation at 1000 RPM for 5 min. We followed our previously described 3D FISH protocol after fixation in 4% PFA for 10 min (Hakim et al. 2011). Probes were prepared by labeling bacterial artificial chromosomes (BACs) with biotin (Roche; Biotin-Nick translation mix) or digoxigenin (Roche; DIG-Nick translation mix). For each BAC, single colonies were grown and verified by PCR. Biotin-labeled probes were detected by Fluorescein Avidin (Vector), and digoxigenin-labeled probes were detected with anti-Dig-Rhodamin (Roche) diluted 1:200.
BAC probes were used as follows: Ifng, RP24-368M14; Furin, RP23-377F13; Il4, RP23-449L19; and Gata3, RP24-402N11. BACs used for 4C validation (Supplemental Figs. S1 and S6) are as follows: RP23-428D6, RP24-305D11, RP23-13J24, RP24-239H10, RP23-223C18, and RP24-319B9. Image acquisition and analysis was performed according to the method previously described (Hakim et al. 2011). Briefly, to determine 3D distances, images were analyzed by a custom automated computer algorithm. This algorithm assigns the 3D spatial position of each locus at the center (brightest pixel) of the FISH focus and then calculates the distances between all the possible pairs from the different color channels. The algorithm generates final outputs from the closest pair in each nucleus. Cumulative distributions of FISH distances up to 1 micron are presented in Figure 1 and Supplemental Figures S1 and S6, since 4C contact frequency is highly correlated with FISH in this distance range (Hakim et al. 2011).
Chromosome conformation capture on chip
The 4C assay was performed according to the method previously described (Simonis et al. 2006; Hakim et al. 2011). 3C ligation junctions DNA library, reflecting in vivo spatial proximity, was generated with HindIII (New England Biolabs). For circularization, the ligation junctions were digested with Csp6I (Fermentas). Baits were amplified with inverse PCR primers (shown from 5′ to 3′) as follows: Ifng, Ifng_4C2F aagccagtttgtcatcatgcand Ifng_4C2R tggcacgcttaatgatcaaa; Il4, Il4_4C_C ggtctcaacccccagctagt and Il4_4C_H ccttgaactcagactcacaagc. Each experiment was independently performed twice.
Statistical analyses of 4C
The primary analysis of 4C microarray data was performed according to the method previously described (Hakim et al. 2011). Briefly, 4C signal for each condition was taken to be the average of the quantile-normalized 4C/input log ratios from biological duplicates. Statistically significant enrichment of high signal probes was assessed by a χ2 test on the 100-kb running window centered at the probe. 4C probes were considered “positive” if the χ2 P-score (−log10 P) is greater than 4. In the Venn diagrams, positive 4C probes were used for counting. A genomic map of contacts presents the positive 4C probes, marked in a color scale based on log2 4C/input DNA. Contiguous probe-clusters in Supplemental Tables S1 through S3 were obtained by merging positive 4C probes within 100 kb on the chromosome. In all the genome browser shots, enrichment of 4C signal is presented by P-score profiles. The genes on contact regions were obtained by retrieving those whose transcription start site (from UC Santa Cruz “RefSeq Genes” annotation table at http://genome.ucsc.edu/cgi-bin/hgTables) is within 10 kb of positive probes.
The probes for the genomic loci that dramatically change interactions with Ifng during Th differentiation in a lineage-specific manner were identified using the following criteria:
• Gained contacts in Th1: Th1 P-scoreɛ−ɛnaive P-score > 6, Th2 P-score < 2, and 3T3 L-1 P-score < 2; 89 probes total.
• Lost contacts in Th1: naive P-scoreɛ−ɛTh1 P-score > 6, | Th2 P-score − naive P-score | < 3; 578 probes total.
• Gained contacts in Th2: Th2 P-scoreɛ−ɛnaive P-score > 6, Th1 P-score < 2, and 3T3 L-1 P-score < 2; 230 probes total.
• Lost contacts in Th2: naive P-scoreɛ−ɛTh2 P-score > 6, | Th1 P-scoreɛ−ɛnaive P-score | < 3; 882 probes total.
The genes in contact loci (Fig. 4) were obtained by retrieving those whose transcriptional unit (5′ start to 3′ end) overlaps with or lies within 10 kb of a 4C probe.
To compare raw 4C profiles from different samples (Supplemental Fig. S1), we obtained a fixed resolution profile of each data by computing the average 4C log ratio over a window of size 100 kb, sliding along the genome at 50-kb increments.
Affymetrix expression microarray analysis
Total cellular RNA from naive, Th1, and Th2 cells was extracted with mirVana kit (Applied Biosystems/Ambion) in accordance with the manufacturer's instructions. Approximately 10 μg of RNA was labeled and hybridized to GeneChip Mouse Genome 430 2.0 arrays (Affymetrix) in accordance with the manufacturer's protocols. Raw data in CEL files were preprocessed using Affymetrix Expression Console software with “RMA” and its quantile normalization method. We profiled expression of naive, Th1, and Th2 cells without TCR stimulation, and incorporated previous data for TCR-stimulated cells (Wei et al. 2010) by quantile-normalizing the combined set. In Figure 4 heat maps, we show TCR-unstimulated expression values of all the Affymetrix probe sets that correspond to the relevant genes, and therefore, the number of rows is greater than the number of nonredundant genes, since some genes are represented by multiple probe sets on the microarray.
Integration of ChIP-seq data
For the STAT4 binding profile in Th1 cells, STAT4 ChIP-seq raw data were used from a previous study (Wei et al. 2010). Unmerged FDR 0% ChIP hotspots were computed from both WT and STAT4 KO control ChIP-seq 25-mer read data (Baek et al. 2012). After removing regions overlapping the nonspecific STAT4 KO ChIP hotspots, WT STAT4 hotspots were further filtered by selecting those whose tag density is above the median value. This resulted in 8868 STAT4 hotspots that represent robust binding sites. For comparison, STAT6 binding data from the same study was treated analogously to produce 5803 STAT6 hotspots. Figure 5C was generated by the following procedure: First, all STAT4 hotspots that overlap with or lie within 10 kb of positive 4C probes were retrieved. The normalized number of STAT4 sites was calculated by dividing the total number of hotspots found in the previous step by the number of positive 4C probes (excluding the 10-Mb bait region). For Figure 5D, we performed the following steps. First, all the STAT4 binding sites that are covered by the NimbleGen probes (hotspots within 10 kb of any NimbleGen 4C probe) were included for analysis. We excluded sites on the 10-Mb-wide bait region surrounding the Ifng gene where the 4C signal is nearly maximal. Then STAT4 sites were further selected by requiring that the mean of the middle three bins (at the center of the STAT4 hotspot) increases from the naive to Th1 profile. For each of the selected STAT4 site, 4C log ratios were computed with the resolution of 10-kb bins that span the 200-kb genomic region centered at the STAT4 hotspot. Shown in the plots are the average profiles over these STAT4 hotspots. The same procedure was applied to STAT6 binding sites as a control.
Data access
All the data have been submitted to the NCBI Gene Expression Omnibus (GEO) (http://www.ncbi.nlm.nih.gov/geo/) under accession no. GSE38717.
Acknowledgments
We thank John J. O'Shea and Yuka Kanno for their advice throughout the project and critical reading of the manuscript; Anindya Indrawan for technical help; Daoud Meerzaman and Robert L. Walker for help with the microarray scanner; Tatiana Karpova for help with microscopy; and Karen Meaburn for critical comments on the manuscript. Fluorescence imaging was performed at the National Cancer Institute Fluorescence Imaging Facility. This work was supported in part by the Intramural Research Program of the National Institutes of Health, National Cancer Institute, Center for Cancer Research.
Footnotes
[Supplemental material is available for this article.]
Article published online before print. Article, supplemental material, and publication date are at http://www.genome.org/cgi/doi/10.1101/gr.147652.112.
References
- Adamson AS, Collins K, Laurence A, O'Shea JJ 2009. The current STATus of lymphocyte signaling: New roles for old players. Curr Opin Immunol 21: 161–166 [DOI] [PMC free article] [PubMed] [Google Scholar]
- An G, Miner CA, Nixon JC, Kincade PW, Bryant J, Tucker PW, Webb CF 2010. Loss of Bright/ARID3a function promotes developmental plasticity. Stem Cells 28: 1560–1567 [DOI] [PMC free article] [PubMed] [Google Scholar]
- Aune TM, Collins PL, Chang S 2009. Epigenetics and T helper 1 differentiation. Immunology 126: 299–305 [DOI] [PMC free article] [PubMed] [Google Scholar]
- Baek S, Sung MH, Hager GL 2012. Quantitative analysis of genome-wide chromatin remodeling. Methods Mol Biol 833: 433–441 [DOI] [PMC free article] [PubMed] [Google Scholar]
- Balasubramani A, Mukasa R, Hatton RD, Weaver CT 2010. Regulation of the Ifng locus in the context of T-lineage specification and plasticity. Immunol Rev 238: 216–232 [DOI] [PMC free article] [PubMed] [Google Scholar]
- Biddie SC, John S, Hager GL 2010. Genome-wide mechanisms of nuclear receptor action. Trends Endocrinol Metab 21: 3–9 [DOI] [PMC free article] [PubMed] [Google Scholar]
- Brown KE, Baxter J, Graf D, Merkenschlager M, Fisher AG 1999. Dynamic repositioning of genes in the nucleus of lymphocytes preparing for cell division. Mol Cell 3: 207–217 [DOI] [PubMed] [Google Scholar]
- Coornaert B, Baens M, Heyninck K, Bekaert T, Haegman M, Staal J, Sun L, Chen ZJ, Marynen P, Beyaert R 2008. T cell antigen receptor stimulation induces MALT1 paracaspase-mediated cleavage of the NF-κB inhibitor A20. Nat Immunol 9: 263–271 [DOI] [PubMed] [Google Scholar]
- Dixon JR, Selvaraj S, Yue F, Kim A, Li Y, Shen Y, Hu M, Liu JS, Ren B 2012. Topological domains in mammalian genomes identified by analysis of chromatin interactions. Nature 485: 376–380 [DOI] [PMC free article] [PubMed] [Google Scholar]
- Djuretic IM, Levanon D, Negreanu V, Groner Y, Rao A, Ansel KM 2007. Transcription factors T-bet and Runx3 cooperate to activate Ifng and silence Il4 in T helper type 1 cells. Nat Immunol 8: 145–153 [DOI] [PubMed] [Google Scholar]
- Efroni S, Duttagupta R, Cheng J, Dehghani H, Hoeppner DJ, Dash C, Bazett-Jones DP, Le GS, McKay RD, Buetow KH, et al. 2008. Global transcription in pluripotent embryonic stem cells. Cell Stem Cell 2: 437–447 [DOI] [PMC free article] [PubMed] [Google Scholar]
- El Kasmi KC, Smith AM, Williams L, Neale G, Panopoulos AD, Watowich SS, Hacker H, Foxwell BM, Murray PJ 2007. Cutting edge: A transcriptional repressor and corepressor induced by the STAT3-regulated anti-inflammatory signaling pathway. J Immunol 179: 7215–7219 [DOI] [PubMed] [Google Scholar]
- Hadjur S, Williams LM, Ryan NK, Cobb BS, Sexton T, Fraser P, Fisher AG, Merkenschlager M 2009. Cohesins form chromosomal cis-interactions at the developmentally regulated IFNG locus. Nature 460: 410–413 [DOI] [PMC free article] [PubMed] [Google Scholar]
- Hakim O, Sung MH, Hager GL 2010. 3D shortcuts to gene regulation. Curr Opin Cell Biol 22: 305–313 [DOI] [PMC free article] [PubMed] [Google Scholar]
- Hakim O, Sung MH, Voss TC, John S, Splinter E, Sabo PJ, Thurman RE, Stamatoyannopoulos JA, de Laat W, Hager GL 2011. Diverse gene reprogramming events occur in the same spatial clusters of distal regulatory elements. Genome Res 21: 697–706 [DOI] [PMC free article] [PubMed] [Google Scholar]
- Heinzel K, Bleul CC 2007. The Foxn1-dependent transcripts PCOLCE2 and mPPP1R16B are not required for normal thymopoiesis. Eur J Immunol 37: 2562–2571 [DOI] [PubMed] [Google Scholar]
- Hewitt SL, High FA, Reiner SL, Fisher AG, Merkenschlager M 2004. Nuclear repositioning marks the selective exclusion of lineage-inappropriate transcription factor loci during T helper cell differentiation. Eur J Immunol 34: 3604–3613 [DOI] [PubMed] [Google Scholar]
- Hunter CA 2005. New IL-12-family members: IL-23 and IL-27, cytokines with divergent functions. Nat Rev Immunol 5: 521–531 [DOI] [PubMed] [Google Scholar]
- Isakov N, Altman A 2002. Protein kinase Cθ in T cell activation. Annu Rev Immunol 20: 761–794 [DOI] [PubMed] [Google Scholar]
- Joffe B, Leonhardt H, Solovei I 2010. Differentiation and large scale spatial organization of the genome. Curr Opin Genet Dev 20: 562–569 [DOI] [PubMed] [Google Scholar]
- John S, Sabo PJ, Thurman RE, Sung MH, Biddie SC, Johnson TA, Hager GL, Stamatoyannopoulos JA 2011. Chromatin accessibility pre-determines glucocorticoid receptor binding patterns. Nat Genet 43: 264–268 [DOI] [PMC free article] [PubMed] [Google Scholar]
- Kanno Y, Vahedi G, Hirahara K, Singleton K, O'Shea JJ 2011. Transcriptional and epigenetic control of T helper cell specification: Molecular mechanisms underlying commitment and plasticity. Annu Rev Immunol 30: 707–731 [DOI] [PMC free article] [PubMed] [Google Scholar]
- Kim SH, McQueen PG, Lichtman MK, Shevach EM, Parada LA, Misteli T 2004. Spatial genome organization during T-cell differentiation. Cytogenet Genome Res 105: 292–301 [DOI] [PubMed] [Google Scholar]
- Knosp CA, Carroll HP, Elliott J, Saunders SP, Nel HJ, Amu S, Pratt JC, Spence S, Doran E, Cooke N, et al. 2011. SOCS2 regulates T helper type 2 differentiation and the generation of type 2 allergic responses. J Exp Med 208: 1523–1531 [DOI] [PMC free article] [PubMed] [Google Scholar]
- Kosak ST, Skok JA, Medina KL, Riblet R, Le Beau MM, Fisher AG, Singh H 2002. Subnuclear compartmentalization of immunoglobulin loci during lymphocyte development. Science 296: 158–162 [DOI] [PubMed] [Google Scholar]
- Kovanen PE, Young L, Al-Shami A, Rovella V, Pise-Masison CA, Radonovich MF, Powell J, Fu J, Brady JN, Munson PJ, et al. 2005. Global analysis of IL-2 target genes: Identification of chromosomal clusters of expressed genes. Int Immunol 17: 1009–1021 [DOI] [PubMed] [Google Scholar]
- Letourneau S, Krieg C, Pantaleo G, Boyman O 2009. IL-2- and CD25-dependent immunoregulatory mechanisms in the homeostasis of T-cell subsets. J Allergy Clin Immunol 123: 758–762 [DOI] [PubMed] [Google Scholar]
- Lieberman-Aiden E, van Berkum NL, Williams L, Imakaev M, Ragoczy T, Telling A, Amit I, Lajoie BR, Sabo PJ, Dorschner MO, et al. 2009. Comprehensive mapping of long-range interactions reveals folding principles of the human genome. Science 326: 289–293 [DOI] [PMC free article] [PubMed] [Google Scholar]
- Lighvani AA, Frucht DM, Jankovic D, Yamane H, Aliberti J, Hissong BD, Nguyen BV, Gadina M, Sher A, Paul WE, et al. 2001. T-bet is rapidly induced by interferon-γ in lymphoid and myeloid cells. Proc Natl Acad Sci 98: 15137–15142 [DOI] [PMC free article] [PubMed] [Google Scholar]
- Lin YC, Benner C, Mansson R, Heinz S, Miyazaki K, Miyazaki M, Chandra V, Bossen C, Glass CK, Murre C 2012. Global changes in the nuclear positioning of genes and intra- and interdomain genomic interactions that orchestrate B cell fate. Nat Immunol 13: 1196–1204 [DOI] [PMC free article] [PubMed] [Google Scholar]
- Maldonado RA, Soriano MA, Perdomo LC, Sigrist K, Irvine DJ, Decker T, Glimcher LH 2009. Control of T helper cell differentiation through cytokine receptor inclusion in the immunological synapse. J Exp Med 206: 877–892 [DOI] [PMC free article] [PubMed] [Google Scholar]
- Misteli T 2007. Beyond the sequence: Cellular organization of genome function. Cell 128: 787–800 [DOI] [PubMed] [Google Scholar]
- Morey C, Kress C, Bickmore WA 2009. Lack of bystander activation shows that localization exterior to chromosome territories is not sufficient to up-regulate gene expression. Genome Res 19: 1184–1194 [DOI] [PMC free article] [PubMed] [Google Scholar]
- Murphy KM, Reiner SL 2002. The lineage decisions of helper T cells. Nat Rev Immunol 2: 933–944 [DOI] [PubMed] [Google Scholar]
- Nakayamada S, Kanno Y, Takahashi H, Jankovic D, Lu KT, Johnson TA, Sun HW, Vahedi G, Hakim O, Handon R, et al. 2011. Early Th1 cell differentiation is marked by a Tfh-like cell transition. Immunity 35: 919–931 [DOI] [PMC free article] [PubMed] [Google Scholar]
- Nakayamada S, Takahashi H, Kanno Y, O'Shea JJ 2012. Helper T cell diversity and plasticity. Curr Opin Immunol 24: 297–302 [DOI] [PMC free article] [PubMed] [Google Scholar]
- Neri S, Cattini L, Facchini A, Pawelec G, Mariani E 2004. Microsatellite instability in in vitro ageing of T lymphocyte clones. Exp Gerontol 39: 499–505 [DOI] [PubMed] [Google Scholar]
- Nixon JC, Ferrell S, Miner C, Oldham AL, Hochgeschwender U, Webb CF 2008. Transgenic mice expressing dominant-negative bright exhibit defects in B1 B cells. J Immunol 181: 6913–6922 [DOI] [PMC free article] [PubMed] [Google Scholar]
- Nora EP, Lajoie BR, Schulz EG, Giorgetti L, Okamoto I, Servant N, Piolot T, van Berkum NL, Meisig J, Sedat J, et al. 2012. Spatial partitioning of the regulatory landscape of the X-inactivation centre. Nature 485: 381–385 [DOI] [PMC free article] [PubMed] [Google Scholar]
- Pesu M, Muul L, Kanno Y, O'Shea JJ 2006. Proprotein convertase furin is preferentially expressed in T helper 1 cells and regulates interferon γ. Blood 108: 983–985 [DOI] [PMC free article] [PubMed] [Google Scholar]
- Ram O, Goren A, Amit I, Shoresh N, Yosef N, Ernst J, Kellis M, Gymrek M, Issner R, Coyne M, et al. 2011. Combinatorial patterning of chromatin regulators uncovered by genome-wide location analysis in human cells. Cell 147: 1628–1639 [DOI] [PMC free article] [PubMed] [Google Scholar]
- Rao NA, McCalman MT, Moulos P, Francoijs KJ, Chatziioannou A, Kolisis FN, Alexis MN, Mitsiou DJ, Stunnenberg HG 2011. Coactivation of GR and NFKB alters the repertoire of their binding sites and target genes. Genome Res 21: 1404–1416 [DOI] [PMC free article] [PubMed] [Google Scholar]
- Schoenfelder S, Sexton T, Chakalova L, Cope NF, Horton A, Andrews S, Kurukuti S, Mitchell JA, Umlauf D, Dimitrova DS, et al. 2009. Preferential associations between co-regulated genes reveal a transcriptional interactome in erythroid cells. Nat Genet 42: 53–61 [DOI] [PMC free article] [PubMed] [Google Scholar]
- Sekimata M, Perez-Melgosa M, Miller SA, Weinmann AS, Sabo PJ, Sandstrom R, Dorschner MO, Stamatoyannopoulos JA, Wilson CB 2009. CCCTC-binding factor and the transcription factor T-bet orchestrate T helper 1 cell-specific structure and function at the interferon-Y locus. Immunity 31: 551–564 [DOI] [PMC free article] [PubMed] [Google Scholar]
- Sexton T, Yaffe E, Kenigsberg E, Bantignies F, Leblanc B, Hoichman M, Parrinello H, Tanay A, Cavalli G 2012. Three-dimensional folding and functional organization principles of the Drosophila genome. Cell 148: 458–472 [DOI] [PubMed] [Google Scholar]
- Siersbaek R, Nielsen R, John S, Sung MH, Baek S, Loft A, Hager GL, Mandrup S 2011. Extensive chromatin remodelling and establishment of transcription factor ‘hotspots’ during early adipogenesis. EMBO J 30: 1459–1472 [DOI] [PMC free article] [PubMed] [Google Scholar]
- Simonis M, Klous P, Splinter E, Moshkin Y, Willemsen R, de Wit E, van Steensel B, de Laat W 2006. Nuclear organization of active and inactive chromatin domains uncovered by chromosome conformation capture-on-chip (4C). Nat Genet 38: 1348–1354 [DOI] [PubMed] [Google Scholar]
- Spilianakis CG, Lalioti MD, Town T, Lee GR, Flavell RA 2005. Interchromosomal associations between alternatively expressed loci. Nature 435: 637–645 [DOI] [PubMed] [Google Scholar]
- Splinter E, de Witt E, Nora EP, Klous P, van de Werken HJ, Zhu Y, Kaaij LJ, van Ijcken W, Gribnau J, Heard E, et al. 2011. The inactive X chromosome adopts a unique three-dimensional conformation that is dependent on Xist RNA. Genes Dev 25: 1371–1383 [DOI] [PMC free article] [PubMed] [Google Scholar]
- Terskikh AV, Miyamoto T, Chang C, Diatchenko L, Weissman IL 2003. Gene expression analysis of purified hematopoietic stem cells and committed progenitors. Blood 102: 94–101 [DOI] [PubMed] [Google Scholar]
- Thomas RM, Chen C, Chunder N, Ma L, Taylor J, Pearce EJ, Wells AD 2010. Ikaros silences T-bet expression and interferon-γ production during T helper 2 differentiation. J Biol Chem 285: 2545–2553 [DOI] [PMC free article] [PubMed] [Google Scholar]
- Usui T, Preiss JC, Kanno Y, Yao ZJ, Bream JH, O'Shea JJ, Strober W 2006. T-bet regulates Th1 responses through essential effects on GATA-3 function rather than on IFNG gene acetylation and transcription. J Exp Med 203: 755–766 [DOI] [PMC free article] [PubMed] [Google Scholar]
- Voss TC, Schiltz RL, Sung MH, Yen PM, Stamatoyannopoulos JA, Biddie SC, Johnson TA, Miranda TB, John S, Hager GL 2011. Dynamic exchange at regulatory elements during chromatin remodeling underlies assisted loading mechanism. Cell 146: 544–554 [DOI] [PMC free article] [PubMed] [Google Scholar]
- Wallach D, Kovalenko AV, Varfolomeev EE, Boldin MP 1998. Death-inducing functions of ligands of the tumor necrosis factor family: A Sanhedrin verdict. Curr Opin Immunol 10: 279–288 [DOI] [PubMed] [Google Scholar]
- Wang W, Graeler MH, Goetzl EJ 2005. Type 4 sphingosine 1-phosphate G protein-coupled receptor (S1P4) transduces S1P effects on T cell proliferation and cytokine secretion without signaling migration. FASEB J 19: 1731–1733 [DOI] [PubMed] [Google Scholar]
- Wang W, Li GW, Chen C, Xie XS, Zhuang X 2011. Chromosome organization by a nucleoid-associated protein in live bacteria. Science 333: 1445–1449 [DOI] [PMC free article] [PubMed] [Google Scholar]
- Wei G, Wei L, Zhu J, Zang C, Hu-Li J, Yao Z, Cui K, Kanno Y, Roh T, Watford WT, et al. 2009. Global mapping of H3K4me3 and H3K27me3 reveals specificity and plasticity in lineage fate determination of differentiating CD4+ T cells. Immunity 30: 155–167 [DOI] [PMC free article] [PubMed] [Google Scholar]
- Wei L, Vahedi G, Sun HW, Watford WT, Takatori H, Ramos HL, Takahashi H, Liang J, Gutierrez-Cruz G, Zang C, et al. 2010. Discrete roles of STAT4 and STAT6 transcription factors in tuning epigenetic modifications and transcription during T helper cell differentiation. Immunity 32: 840–851 [DOI] [PMC free article] [PubMed] [Google Scholar]
- Weiss B, Wolk K, Grunberg BH, Volk HD, Sterry W, Asadullah K, Sabat R 2004. Cloning of murine IL-22 receptor alpha 2 and comparison with its human counterpart. Genes Immun 5: 330–336 [DOI] [PubMed] [Google Scholar]
- Wilson CB, Rowell E, Sekimata M 2009. Epigenetic control of T-helper-cell differentiation. Nat Rev Immunol 9: 91–105 [DOI] [PubMed] [Google Scholar]
- Yaffe E, Tanay A 2011. Probabilistic modeling of Hi-C contact maps eliminates systematic biases to characterize global chromosomal architecture. Nat Genet 43: 1059–1065 [DOI] [PubMed] [Google Scholar]
- Yagi R, Junttila IS, Wei G, Urban JF Jr, Zhao K, Paul WE, Zhu J 2010. The transcription factor GATA3 actively represses RUNX3 protein-regulated production of interferon-γ. Immunity 32: 507–517 [DOI] [PMC free article] [PubMed] [Google Scholar]
- Yu CR, Mahdi RM, Ebong S, Vistica BP, Chen J, Guo Y, Gery I, Egwuagu CE 2004. Cell proliferation and STAT6 pathways are negatively regulated in T cells by STAT1 and suppressors of cytokine signaling. J Immunol 173: 737–746 [DOI] [PubMed] [Google Scholar]
- Zhu J, Yamane H, Paul WE 2010. Differentiation of effector CD4 T cell populations. Annu Rev Immunol 28: 445–489 [DOI] [PMC free article] [PubMed] [Google Scholar]
- Zhuang Y, Huang Z, Nishida J, Brown M, Zhang L, Huang H 2009. A continuous T-bet expression is required to silence the interleukin-4-producing potential in T helper type 1 cells. Immunology 128: 34–42 [DOI] [PMC free article] [PubMed] [Google Scholar]