

Abstract
In many ant species, sibling larvae follow alternative ontogenetic trajectories that generate striking variation in morphology and behavior among adults. These organism-level outcomes are often determined by environmental rather than genetic factors. Therefore, epigenetic mechanisms may mediate the expression of adult polyphenisms. We produced the first genome-wide maps of chromatin structure in a eusocial insect and found that gene-proximal changes in histone modifications, notably H3K27 acetylation, discriminate two female worker and male castes in Camponotus floridanus ants and partially explain differential gene expression between castes. Genes showing coordinated changes in H3K27ac and RNA implicate muscle development, neuronal regulation, and sensory responses in modulating caste identity. Binding sites of the acetyltransferase CBP harbor the greatest caste variation in H3K27ac, are enriched with motifs for conserved transcription factors, and show evolutionary expansion near developmental and neuronal genes. These results suggest that environmental effects on caste identity may be mediated by differential recruitment of CBP to chromatin. We propose that epigenetic mechanisms that modify chromatin structure may help orchestrate the generation and maintenance of polyphenic caste morphology and social behavior in ants.
Colonial division of labor into reproductive (e.g., queen) and functionally sterile (worker) castes is a hallmark strategy for social organization employed by all eusocial insects (Wilson 1953; Wheeler 1986; Hölldobler and Wilson 1990). A subset of ant species (Hymenoptera: Formicidae) have evolved further subdivision of workers into specialized castes, whereby signals initiated during larval development activate alternative ontogenies that generate complex variation in morphology, behavior, and lifespan among adults (Hölldobler and Wilson 1990). Importantly, these caste-determining signals often derive from environmental—physical, nutritional (e.g., royal jelly), social—cues rather than genetic factors (Wheeler 1986, 1991; Schwander et al. 2010; Kamakura 2011; Rajakumar et al. 2012). This environmentally regulated production of stereotypical phenotypes from a single genotype (polyphenism) makes ants an ideal system to study epigenetic mechanisms that generate and maintain phenotypic plasticity (Stearns 1989; Nijhout 1999; West-Eberhard 2003). Little is currently known about molecular mechanisms mediating ant polyphenisms (Evans and Wheeler 2001; Smith et al. 2008; Gadau et al. 2012), although DNA methylation (Kucharski et al. 2008; Elango et al. 2009; Lyko et al. 2010) and insulin and endocrine signaling (Ament et al. 2008; Kamakura 2011; Mutti et al. 2011; Rajakumar et al. 2012) have been implicated in the social, yet evolutionarily distinct lineage of honeybees.
Here, we report the investigation of a role for histone post-translational modifications (PTMs) in modulating social insect caste identity (Alarcón et al. 2004; Levenson and Sweatt 2005; Berger 2007; Peleg et al. 2010; Nègre et al. 2011; Roudier et al. 2011; Spannhoff et al. 2011) using the Florida carpenter ant Camponotus floridanus, which features a polyphenism involving two female worker castes called majors and minors (Wilson 1953; Dupuy et al. 2006; Lucas and Sokolowski 2009). We recently assembled a high-quality draft of the ∼240 megabase C. floridanus genome, which is predicted to encode ∼17,000 protein-coding genes (Bonasio et al. 2010). While models for many of these genes remain incomplete, 84% were validated with expressed sequence tag (EST) or RNA-seq data and annotated by homology comparisons to several insect genomes. Using these gene annotations and assembly, we first performed a comprehensive assessment of caste differences in gene expression and chromatin structure between major, minor, and male adults using pooled head and thoracic tissues; this broad approach considers both allometric and tissue-specific caste variation. We sequenced chromatin immunoprecipitation (ChIP) samples by caste for histone H3, seven PTMs on H3, including mono- and trimethylation of lysine 4 (H3K4me1, H3K4me3), H3K27me3, H3K36me3, H3K9me3, acetylation of lysines 9 and 27 (H3K9ac, H3K27ac), and RNA Polymerase II (Pol II), along with whole-genome inputs (Supplemental Fig. 1; Supplemental Table 1). Based on observations from these pooled samples, we also sequenced ChIP samples for the acetyltransferase and transcriptional coactivator CREB binding protein (CBP) in majors and minors, as well as RNA, H3, H3K27ac, and input samples from brain tissue isolated from majors and minors. To analyze these data, we developed a novel Bayesian probability model that estimates quantitative per-nucleotide ChIP enrichment scores normalized by histone H3 as a proxy for nucleosome density (for PTM samples) and by DNA input as a proxy for chromatin accessibility (for all samples) (Supplemental Figs. 2, 3; Supplemental Methods). Using a probabilistic model allowed us to utilize both unique and non-unique mapped reads (Supplemental Table 1), which provides high sensitivity and specificity for comprehensive analysis of chromatin organization (Supplemental Fig. 4). The scores obtained by this method comprise our caste-specific, genome-wide chromatin maps.
Results
Genome-wide prevalence of histone PTMs in ants
Since chromatin structure has not been studied in social insects, we first assessed the genome-wide prevalence of PTMs in ants by identifying discrete regions of interest (ROIs) that exhibit significant PTM enrichment across spans of DNA in the C. floridanus genome (P < 0.05); as expected, these ROIs average about one nucleosome in length (196 bp) (Supplemental Fig. 5). By counting nucleotides that comprise ROIs and averaging over castes, we obtained conservative estimates of genome-wide PTM prevalence, with H3K4me1 showing the greatest (36.5% ± 3.8%) and H3K9ac the least (10.8% ± 1.3%) prevalence (Fig. 1A) (see Supplemental Fig. 6A for more lenient per-nucleotide estimates). PTM ROIs show a modest 1.6-fold enrichment for genic DNA, with 57% of each PTM's total ROI overlapping protein-coding (exons, introns, UTRs) and noncoding genes on average (the C. floridanus genome is ∼35% genic) (Fig. 1A, top). Different PTMs generally show similar genic prevalence (49%–59%), with the exception of H3K9me3, whose apparent depletion in intergenic and repetitive regions (Fig. 1A) is most likely due to the poor representation of heterochromatic DNA in our current genome assembly, potentially limited recovery of heterochromatin by sonication, and reduced sensitivity of ROI identification in highly repetitive regions, where H3K9me3 is expected (Supplemental Text 1; Supplemental Fig. 4, bottom). To calibrate these estimates of PTM prevalence, we compared them with similar estimates for H3K4me3, H3K9ac, H3K27ac, and H3K27me3 from Drosophila female adults (Nègre et al. 2011). Despite confounding technical differences (ant ROIs were normalized to total histone H3 and input whereas fly ROIs were normalized to input only; fly data additionally included abdomen), we found a strong correlation between species (R = 0.84), indicating broadly consistent PTM patterns.
Figure 1.

Genome-wide patterns of histone PTMs in Camponotus floridanus. (A) Prevalence of histone PTMs and RNA Pol II, partitioned into genic (Exon, Intron, 5′ and 3′ UTRs, 2-kb promoter), Noncoding, and Intergenic groups. Prevalence was computed by counting nucleotides covered by significant regions of interest (ROIs; P < 0.05) and averaging over major, minor, and male estimates. Prevalence over repetitive DNA, defined here as sequences appearing multiple times in the genome, is shown below (see Supplemental Fig. 6C for specific classes of repetitive elements); by this definition, ∼22% of the genome is repetitive (Supplemental Methods). An ROI is considered repetitive if the majority of nucleotide loci delimited by this ROI are repetitive. Error bars denote 1 standard error (SE) over castes. (B) Quantitative profiles of ChIP enrichment across gene loci,  ,…,
,…,  for ChIP samples p, averaged over castes and all protein-coding genes that contain significant PTM prevalence (14,368 genes). Error bars denote SE over genes. (TSS) Transcription start site; (Exon) first (1), internal (i), and last (n) exons; (TTS) transcription termination site; (kb) kilobase. (C) Visualization of the 351-dimensional ChIP-seq data set summarized for 9861 protein-coding genes, grouped by k-means clustering into k = 4 significant clusters (chromatin domains) using AIC model selection and a Euclidean distance measure. Columns were grouped by hierarchical clustering with a Euclidean distance measure. (Middle) ChIP enrichment profiles averaged over gene loci from each chromatin domain. On right, average expression levels for genes in each chromatin domain, separated by caste. Error bars denote SE over genes. (FPKM) Fragments per kilobase per million (mapped) reads (proxy for mRNA expression level).
The majority (82%) of our 17,061 protein-coding gene models are associated with all PTMs (i.e., with significant ChIP enrichment over ≥25% of gene body ±2 kb). A total of 99.9% of these genes also show significant Pol II enrichment, consistent with previous observations of extensive transcription in pooled tissue samples (Fig. 1B; Bonasio et al. 2010). Clustering genes by their ChIP enrichment profiles revealed four chromatin domains (Fig. 1C) that exhibit significantly different mean expression levels along with changes in repressive (H3K9me3) and activating (H3K4me3, H3K36me3, H3K9ac, H3K27ac) PTMs. These domains are comprised of distinct and significant gene ontology (GO) categories that roughly demarcate repressed (domains 1, 2), housekeeping (domain 3), and developmental/physiological (domain 4) functions (FDR < 0.01, Supplemental Table 2). In addition, enrichment for Pol II near transcription start sites (TSSs) in the repressed domains suggests that many genes are bound by engaged or promoter-paused Pol II (Fig. 1C, green lines). In fact, 61% of genes with extremely low expression (FPKM < 0.05; n = 2617) contain significant ROIs for Pol II at promoters, whereas only 5% contain exonic ROIs. Another interesting finding is that compared with other PTMs, H3K27ac shows the greatest proportion of ROIs over 2-kb proximal promoters genome-wide (9.8%, P < 0.001) with slightly more than Pol II (9.2%) (Fig. 1A,B). Since H3K27ac is required to recruit Pol II to many genes in mammals (Jin et al. 2011), this observation suggested that H3K27ac might have a role in controlling gene expression in ants.
These results revealed that ants exhibit distinct PTM patterns that demarcate protein-coding (Fig. 1; Supplemental Fig. 7) as well as noncoding and repetitive (Supplemental Fig. 6B,C) gene classes in a manner consistent with patterns observed in model organisms (Nègre et al. 2011; Roudier et al. 2011). These chromatin maps offer a unique potential to examine organism-level, chromatin-based gene regulation in a social insect.
Gene-proximal chromatin structure distinguishes ant castes
Viewed at low resolution, ant chromatin maps appear similar among castes (Fig. 2A; Supplemental Fig. 8A). At fine resolution, however, we identified significant patterns of qualitative and quantitative variation (Fig. 2B; Supplemental Fig. 8). We also found that individual genes and their regulatory regions often exhibit pronounced differences in PTM enrichment by caste; for example, a neurotransmitter-gated acetylcholine receptor subunit (Cflo_05605) displays greater H3K27ac in minors than majors (Fig. 2C) and greater mRNA levels (see Fig. 3D, below). Indeed, comparing biological replicate experiments for H3K27ac within caste revealed less variation genome-wide than comparisons between castes for any of the PTMs (Supplemental Fig. 9A).
Figure 2.
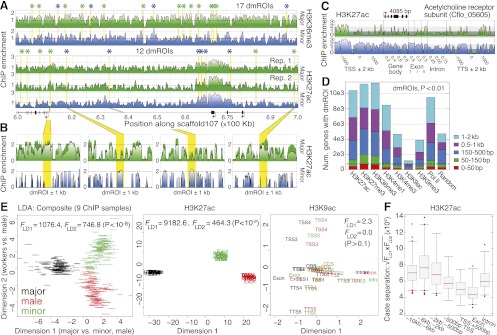
Histone PTMs discriminate ant castes. (A) High-resolution profiles for H3K36me3 and H3K27ac spanning 600–700 kb on scaffold107. Asterisks denote significant differentially marked regions of interest (dmROIs) between majors and minors (P < 0.01) and are colored by enriched caste (major, green; minor, blue). (B) Example dmROIs for H3K27ac (yellow) with 1-kb flanking sequence. Error bars denote SE over two biological replicates. (C) Comparison of major (top) and minor (bottom) ChIP enrichment profiles for H3K27ac over a single gene locus (Cflo_05605), including 2-kb flanking intergenic sequence. (TSS) Transcription start site; (Exon) first (1), internal (i), and last (n) exons; (TTS) transcription termination site; (kb) kilobase. (D) Numbers of genes with TSS-proximal dmROIs (50 bp–2 kb). The expected number of genes for each distance cutoff is shown on right, using randomly sampled coordinates (average of 100 replicates shown). (Dashed line) Expected cutoff for dmROIs within 150 bp of a gene TSS. (E) Two-dimensional linear discriminant (LD) analysis of caste, using ChIP enrichment for 9944 protein-coding genes (13 genic regions, nine ChIP samples per gene). Similar analyses for H3K27ac and H3K9ac also shown on right; Supplemental Figure 10D shows a similar plot for H3K27me3. Data points are labeled by genic region and/or ChIP sample and are colored by caste as indicated. (F) Caste separation  was assessed near genes as shown by randomly sampling 10,000 loci and performing LD analysis, as done in E. Each distribution shows n > 30 replicates. (Boxes) 25th–75th percentiles; (whiskers) 5th–95th percentiles; (points) outliers. (bp) Base pairs.
Figure 3.
Changes in H3K27ac reveal caste-specific transcriptome states. (A) Meta-gene average ChIP enrichment profiles for five PTMs, pooling caste data. ChIP enrichment profiles are grouped into five expression categories (20th percentiles of the genome-wide distribution of gene expression levels). R2 values indicate ordinary least-squares regression fit of gene-proximal (gene body ± 2 kb) ChIP enrichment data to log2(FPKM+1) expression (Supplemental Table 4). Error bars denote SE over genes. (TSS) Transcription start site; (Exon) first (E1), internal (Ei), and last (En) exons; (TTS) transcription termination site; (kb) kilobase. (B) Relationship between the difference in log2(FPKM+1) expression levels (y-axis) and the difference in H3K27ac ChIP enrichment (x-axis) between majors and minors. ChIP enrichment data were fitted by linear regression to mRNA expression using 11,459 genes. “High-confidence” genes contain no missing data requiring imputation across gene loci. “Diff. RNA” genes have significant differential expression (FDR < 0.15) and are significant in a χ2 multivariate outlier analysis. “Caste-specific” genes also exhibit significant ChIP enrichment and are grouped by false discovery rate (0.25 < FDR < 0.01). See Supplemental Methods for further details. Numbers of significant GO categories enriched using caste-biased genes (i.e., passing multivariate outlier analysis but not necessarily with significant changes in expression or H3K27ac) from each quadrant are shown (FDR < 0.01). (C) ChIP enrichment profiles for H3K27ac over caste-specific gene loci (FDR < 0.25) for 40 major-specific genes (top) and 79 minor-specific genes (bottom). Error bars reflect 1 SE over genes. (D) Validation of caste-specific genes from B. RNA levels (black bars) were measured by RT-qPCR and normalized to GAPDH levels, which shows similar expression both among castes and among biological replicates within caste (i.e., similar standard errors; data not shown). H3K27ac enrichment (gray bars) were measured in 5′ promoters by ChIP-qPCR and normalized to total H3. See Supplemental Table 10 for primer sequences. Average and standard deviation over five independently founded ant colonies are shown. Significance assessed by two-sample, unequal variance t-test: (*) P < 0.05; (**) P < 0.01; (***) P < 0.001. (E) Pearson correlations of between-caste differences in ChIP enrichment between pairs of PTMs, RNA Pol II, and mRNA expression using either all genes (n = 11,459; bottom right diagonal) or caste-specific genes (n = 119; top left diagonal). Reported values indicate the averages from major vs. minor and male vs. female comparisons. (Yellow) R = +1; (dark blue) R = −1.
We then examined PTM variation between castes genome-wide based on positional, qualitative, and quantitative patterns. Analysis of ROIs shared between castes (shROI) revealed significant positional similarity (80% overlap vs. 78% expected, P < 10−10) averaging over PTMs and caste comparisons (Supplemental Fig. 9B, green vs. red). However, overlap of shROIs between castes is significantly lower than expected compared with biological replicates (purple, average 88%, P < 10−10), indicating possible changes in nucleosome positioning among castes (Schones et al. 2008). Next, we identified ROIs that exhibit significant differential ChIP enrichment between castes (P < 0.01) (Fig. 2B; Supplemental Fig. 9C–F). These differentially marked ROIs (dmROIs) comprise 16.6% of all identified ROIs, cover nearly 18% of the genome, and are enriched near protein-coding genes, especially in distal promoters and introns (Supplemental Fig. 9G). In fact, over 8000 genes have dmROIs for Pol II, H3K27ac, H3K4me1, H3K27me3, and H3K36me3 within 2 kb of their TSS (Fig. 2D), and TSSs show a median distance of 200 bp from dmROIs (Supplemental Fig. 9H). Thus, PTM variation between castes is concentrated in noncoding regions near genes in a manner suggestive of caste-specific gene regulation (Heintzman et al. 2009; Kim et al. 2010).
Finally, we investigated whether ant castes may be differentially characterized by quantitative changes in genome-wide, gene-proximal ChIP enrichment. We averaged ChIP enrichment in each of 13 genic regions spanning gene bodies ±2 kb (Supplemental Fig. 10A) and performed linear discriminant (LD) analysis to evaluate whether castes exhibit coherent genome-wide changes in these regions. Strikingly, mean changes in enrichment discriminate castes in just two dimensions (directions of greatest caste variation) (P < 10−8) (Fig. 2E, left); this is not seen when randomly shuffling samples among castes (Supplemental Fig. 10B,C; see also Supplemental Fig. 10E for LD analysis of noncoding and repetitive loci). Pol II shows the strongest discrimination (P < 10−8), implicating transcriptional regulation in caste identity. Most PTMs also show significant effects; for example, H3K27ac shows striking discrimination of caste (P < 10−8), whereas H3K9ac shows poor discrimination (P = 0.13) (Fig. 2E, middle and right). Interestingly, males show similar separation as female workers, despite pronounced morphological differentiation and a haploid genome; this is consistent with similar numbers of dmROIs among castes (Supplemental Fig. 9D). Comparing gene-proximal regions, intergenic and intronic sequences provide approximately twofold greater discrimination than the +1 nucleosome and exons (Fig. 2F), consistent with weaker discrimination and fewer genic dmROIs for the classic TSS-specific PTMs H3K4me3 and H3K9ac (see Fig. 2D). This suggests that caste variation is both PTM specific and spatially distributed. Analyzing individual PTMs restricted to the most significant (noncoding) regions largely recapitulated these results (Supplemental Table 3). Thus, patterns of caste variation reflect distinct chromatin configurations exhibited by ant castes, notably over gene-proximal, noncoding regions that may correspond to regulatory sequences in the vicinity of genes.
Caste-differential gene expression reflects changes in chromatin structure, notably H3K27ac
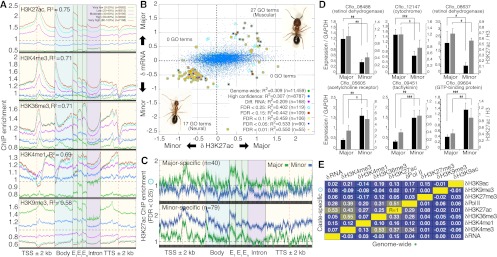
Having observed gene-proximal caste variability for most PTMs, we next examined the relationship between PTM organization and the transcriptome (Supplemental Fig. 11). Pooling all caste data for PTMs and RNA, we found that ChIP enrichment strongly predicts mRNA expression by linear regression (average R2 = 0.68) (Supplemental Table 4; Supplemental Fig. 12). H3K27ac and Pol II show the greatest fit individually (R2 = 0.75 and 0.74, respectively) and correlate with each other across gene loci (Ravg = 0.62), with a maximum over TSSs genome-wide (Rmax = 0.75) (Fig. 3A, top). Ninety-seven percent of expression variation explained by H3K27ac can be attributed to changes in proximal promoters and introns, consistent with LD analysis (see above). H3K4me3, H3K36me3, and H3K4me1 explain similar, but less variation (0.69 ≤ R2 ≤ 0.71) (Fig. 3A, middle), and H3K9me3 explains the least (R2 = 0.58) (Fig. 3A, bottom). Combining all seven PTMs into one regression model yielded the maximum R2 of 0.76, representing a significant but small improvement compared with H3K27ac alone (P < 10−15, Supplemental Table 4). Thus, PTM organization strongly predicts overall transcriptome levels for all castes, and H3K27ac is the best predictor.
Next, we asked whether differences in gene expression levels between castes are proportional to differences in ChIP enrichment. Remarkably, the combined effect of all PTM differences explains 92% of genome-wide variation in major–minor differential expression and 62% of male–female variation (Supplemental Fig. 13A; Supplemental Table 5). While all PTMs contribute significant effects (P < 0.001), H3K27ac has the largest effect (R2 = 0.31) (Fig. 3B). Focusing on genes that exhibit significant changes in both expression level and H3K27ac enrichment (caste-specific genes) (Fig. 3C; Supplemental Table 6) yielded even stronger correlation between caste-differential gene expression and ChIP enrichment for H3K27ac (0.40 ≤ R2 ≤ 0.55) (Fig. 3B; see Supplemental Fig. 13B for analogous male vs. female worker comparison) but not other PTMs (Supplemental Table 5). Moreover, H3K27ac correctly classifies the direction of expression change for 87% (major vs. minor) and 76% (male vs. female) of caste-specific genes (Supplemental Fig. 14) and, in fact, identifies the subset of genes with the most extreme differential expression (Supplemental Fig. 15). Repeating this analysis using an independent H3K27ac ChIP-seq biological replicate revealed similar results (data not shown).
We identified 110 GO categories for a broader set of 1771 genes whose caste-differential expression correlates with H3K27ac changes (FDR < 0.05); categories include transcription factor activity and muscle development (majors), synaptic transmission (minors), carbohydrate transport (males), and sensory perception (females) (Supplemental Table 7). All but six categories are distinct among castes and are consistent with increased body size in majors (see Fig. 3B), foraging activity in minors (Lucas and Sokolowski 2009)—which involves linking sensory cues to behavioral responses via long-term memory (Alarcón et al. 2004; Levenson and Sweatt 2005; Peleg et al. 2010)—and high-energy demands of flight in males (Montooth et al. 2003). We validated the caste-specificity of several genes representative of these categories by RT-qPCR for RNA and ChIP-qPCR for H3K27ac using five independently founded ant colonies (Fig. 3D). Thus, one PTM, namely H3K27ac, differentially targets genes participating in distinct biological processes associated with caste-specific morphological and behavioral changes.
Not surprisingly, these data reveal complexity in gene-proximal chromatin structure beyond H3K27ac. All PTMs and several interactions between PTMs in our combined regression analysis show significant effects (Supplemental Table 5). Caste changes in H3K4me3 and H3K36me3 as well as Pol II correlate moderately with changes in H3K27ac and with each other both genome-wide and for caste-specific genes, despite showing weaker correlations with RNA (Fig. 3E). Also, 62% of H3K27ac-correlated genes cluster in chromatin domain 4 (P < 10−10; Supplemental Table 8), which features strong enrichment of H3K4me3, H3K36me3, and H3K9ac—all PTMs associated with gene activation. Interestingly, we did not find obvious correlations with RNA for caste changes in the activating PTMs H3K4me3 and H3K9ac or the repressive PTMs H3K27me3 and H3K9me3, although methylation and acetylation on H3K9 and H3K27 show antagonistic enrichment for the most significant ROIs (Supplemental Text 2; Supplemental Fig. 16). We speculate these modifications may have tissue-specific effects or developmental functionality (e.g., Tie et al. 2009) not captured by our pooled tissue experimental design. Finally, PTM changes between males and females largely parallel changes between the female workers, suggesting similar chromatin regulation in all castes (Supplemental Figs. 13, 14). However, PTM changes do explain differential expression between female workers better than between sexes, suggesting a possible role for dosage compensation mechanisms (which have been associated with a PTM not considered in this study, H4K16ac, in Drosophila) to regulate phenotypic differentiation of haploid males (Larschan et al. 2011). Overall, these results argue that histone modifications, notably H3K27ac, play a role in modulating caste-specific transcriptome states in C. floridanus ants.
Ant brains exhibit additional caste-specific variation
To evaluate the extent of caste differences within a single tissue, we examined RNA and H3K27ac ChIP samples from whole brains of majors and minors. As expected, some genes show brain-specific expression (Supplemental Fig. 17B) as well as caste-specific brain expression (Supplemental Fig. 17A,C,D). Many of these genes were not identified as significant in pooled tissue analysis and reveal up-regulation of a juvenile hormone esterase (Cflo_06990), metabotropic glutamate receptor mGluR2 (Cflo_02863) (Fig. 4A), and antibacterial protein Hymenoptaecin (Cflo_05640) in minor brains and hexamerin proteins (Cflo_07104, Cflo_12693) and the yolk protein vitellogenin (Cflo_10669) (Fig. 4A) in major brains. Notably, caste-specific expression of vitellogenin is consistent with observations of differential regulation of foraging activity and lifespan via Vitellogenin titer in honeybees (Seehuus et al. 2006; Corona et al. 2007; Nelson et al. 2007).
Figure 4.
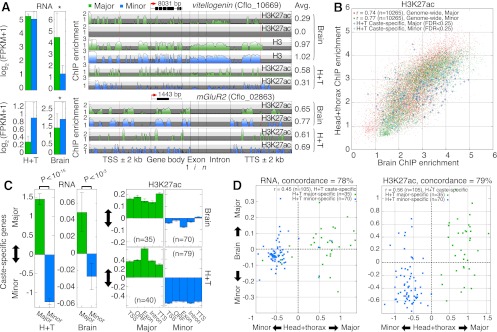
Ant brains exhibit caste-specific variability. (A) mRNA expression and ChIP enrichment tracks from brain and head+thorax (H+T) samples for two gene loci, vitellogenin and mGluR2. Asterisks denote significant differential expression (FDR < 0.25). Total H3 brain samples are shown for vitellogenin for reference. Gene length is indicated above each gene model. Average ChIP enrichment across each gene locus is reported on right. (TSS) Transcription start site; (Exon) first (1), internal (i), and last (n) exons; (TTS) transcription termination site; (kb) kilobase. (B) Scatterplot comparisons of H3K27ac ChIP enrichment between brain and H+T tissues, shown separately for major and minor data. Caste-specific genes identified from H+T data are highlighted in blue to show their enrichment in brain tissue. Pearson correlation coefficients are reported for each caste. (C) Mean changes in RNA (left) and H3K27ac ChIP enrichment (right) for H+T caste-specific genes (over TSS, CDS, Exon, Intron, and TTS), measured in brains and in H+T. Error bars indicate SE over genes. P-values estimated using a two-tailed Mann-Whitney U-test. (D) Scatterplot comparisons of major vs. minor differences in RNA (left) and H3K27ac (right) between H+T and brain tissue samples, for H+T caste-specific genes. Concordance statistics report the percentage of H+T caste-specific genes that exhibit the same direction of change (major or minor) in brain and H+T samples. (FPKM) Fragments per kilobase per million (mapped) reads (proxy for mRNA expression level).
Overall, RNA and H3K27ac levels exhibit strong genome-wide correlation between brain and head+thorax (H+T) tissues (R = 0.67 and 0.75, respectively, pooling caste data) (Fig. 4B; Supplemental Fig. 17B). The strong correlation of chromatin structure between pooled and single adult tissues is consistent with the possibility that caste-specific chromatin patterns established during larval development might be epigenetically maintained into adulthood (Tie et al. 2009). Furthermore, the caste-specific genes we identified from H+T data correlate well with caste differences from brains for RNA (R = 0.45) and H3K27ac (R = 0.56) and show 78% and 79% concordance with the direction of change in brains, respectively (Fig. 4C,D). Thus, when focusing on a single, albeit heterogeneous tissue, we observe significant transcriptome and chromatin variation between worker castes that is both revealing of brain-specific variation and broadly consistent with data from pooled tissues.
Since our pooled tissue data captures both tissue-specific and allometric (i.e., differences in tissue proportions between castes) caste variation, we used a regression model to estimate the proportion of H+T variation that likely results from tissue-specific effects (Supplemental Methods). Distributing caste differences over 50 tissues (the estimated number for insects) (Valentine et al. 1994) explains <29% of observed caste differences for all PTMs on average (Fig. 5) (see Supplemental Fig. 18 for complete results). These estimates are consistent with empirical concordance of caste-specific genes; for example, our regression estimate that 77% of H+T caste variation is tissue specific for H3K27ac (Fig. 5) is similar to our empirical estimate of 79% comparing H+T and brain tissues (see Fig. 4D, right). Thus, while allometry may contribute to the observed differences in chromatin structure between castes, the majority of PTM variation is likely due to tissue-specific differences.
Figure 5.

Estimates of the percentage of tissue-specific caste variation present in H+T data when comparing majors and minors. Shown are proportions of variation (in the distribution of ChIP enrichment differences for all protein-coding genes) explained by a linear regression model allowing allometry in 50 independent tissue types. Results for 250 simulated tissue-specific ChIP enrichment matrices are shown for each ChIP sample. See Supplemental Figure 18 for complete results and Supplemental Methods for more details. (Boxes) 25th–75th percentiles; (whiskers) 5th–95th percentiles; (points) outliers. Adjusted R2 values estimated by weighted least squares, with the same weights used for caste differential regression of RNA and ChIP data in Figure 3B.
CBP exhibits caste-differential colocalization with H3K27ac
We then investigated the mechanism that may determine the strong correlation between H3K27ac enrichment and mRNA levels. Histone acetylation can alter gene activity by increasing DNA accessibility either directly by changing chromatin structure via neutralizing DNA's ionic affinity to histones, or indirectly by establishing a binding surface for effector protein recruitment (Berger 1999). Thus, establishing caste-specific transcriptome states may involve opening chromatin via histone acetyltransferases (HATs) that are recruited to specific genes by transcription factors (TFs). In Drosophila, most H3K27ac is catalyzed by the acetyltransferase and transcriptional coactivator CBP (CREB binding protein) (Tie et al. 2009). Similar to Drosophila, ant genomes encode a single CBP enzyme with a HAT domain (and other conserved domains) (Supplemental Fig. 19) and lack the paralog EP300 found in vertebrates. Therefore, we investigated a possible role for CBP in mediating caste-specific H3K27ac patterning in ants.
Consistent with our hypothesis of differential recruitment, we found similar chromatin patterns at the CBP locus in all castes and similar CBP mRNA levels, suggesting that differences in CBP protein abundance are unlikely to account for its putative differential activity; other HATs and histone deacetylases (HDACs) show a similar pattern (Supplemental Fig. 20). ChIP-seq analysis revealed enrichment for 22,353 CBP ROIs in both castes, the majority of which are caste specific (83%, Supplemental Fig. 21A). CBP ROIs are enriched in distal promoters (2–50 kb) and introns (P < 0.01) (Supplemental Fig. 21B)—the same general regions that harbor the greatest PTM variation between castes (i.e., dmROIs; see Supplemental Fig. 9G). Consistent with observations in insects (Nègre et al. 2011) and in mammals (Heintzman et al. 2009; Kim et al. 2010), we found enrichment at CBP ROIs for H3K4me1, H3K27ac, and Pol II, depletion for H3K9ac and H3K27me3, and changes in CBP, H3K27ac, and H3K4me1 enrichment by caste (Supplemental Fig. 21C). Strikingly, 92% of CBP ROIs are located within 2 kb of a dmROI, and the median distance to a dmROI is 346 bp, compared with a random expectation of over 14 kb (P < 10−16) (Fig. 6A); indeed, CBP ROIs are closest to dmROIs for H3K27ac. We then used LD analysis to compare the degree of variation in H3K27ac between castes in CBP-bound versus non-CBP-bound regions, and found significantly greater H3K27ac variation at CBP-bound regions (P < 0.05) (Fig. 6B). These results suggest that the major foci of variation between C. floridanus castes may result from the differential recruitment of CBP to enhancer sequences.
Figure 6.

CBP colocalizes with dmROIs and identifies putative transcription factor binding partners. (A) Cumulative distribution of distance (kb) from a CBP ROI to the nearest dmROI. “All” curve computed using the pool of all dmROIs for PTMs and Pol II (n = 161,401). “Random” curve computed using the average distribution obtained by randomly generating 161,401 ROIs with the observed ROI length distribution (n = 100 replicates). Error bars for “Random” curve denote SE over replicates. Dashed line marks 2-kb distance, which accounts for 92% of CBP ROIs. (B) Linear discriminant (LD) analysis for H3K27ac ChIP enrichment using all 22,353 CBP ROIs (diamonds in cartoon). F-value denotes observed caste separation of H3K27ac at CBP ROIs. Boxplot shows distribution of 250 random F-values obtained by LD analysis using the same number of ROIs drawn randomly genome-wide with lengths from Supplemental Figure 21A but excluding CBP ROIs. (C) Mean difference in ChIP enrichment between majors and minors for sets of major-specific, minor-specific, and remaining (nonspecific) genes. Error bars denote SE over genes. Asterisks denote significant deviation from 0 (one sample t-test, P < 0.01). R-values denote Pearson correlation of CBP versus H3K27ac or H3K9ac across caste-specific gene loci (gene body ±2kb), using ChIP enrichment values fitted by linear regression with RNA. (D) Nine TF motifs significantly enriched in promoters (2 kb) of caste-specific genes from worker and sex comparisons (FDR < 0.1). Seven of these motifs (denoted by asterisks) are also enriched in DNA sequences denoted by all CBP ROIs (FDR < 0.05). Four nonenriched TFs are shown as controls.
We also considered the relationship between CBP enrichment and gene expression and found that gene-proximal CBP enrichment positively correlates with expression levels genome-wide (R2 = 0.63), as expected. Importantly, we also found significant enrichment for CBP ROIs (P < 10−3), as well as significant quantitative differences in CBP enrichment between castes near caste-specific genes (Fig. 6C). Changes in CBP enrichment correlate with changes in H3K27ac (R = 0.35) but not H3K9ac (R = 0.06) across caste-specific genes. These results indicate that CBP differentially associates with genes that exhibit caste-differential expression and H3K27ac enrichment.
Finally, we searched proximal promoters (≤2 kb) of caste-specific genes for transcription factor (TF) binding sites that might explain the locus-specific recruitment of CBP (Supplemental Text 3). We identified binding sites for nine TFs including CREB, Mothers against dpp (Mad, a TGF-β receptor-SMAD), Medea (its co-SMAD), Brinker (Mad repressor), and Trithorax-like (Trl, or GAGA factor) (FDR < 0.1) (Fig. 6D). Notably, CREBA (also known as CREB), MAD, and TRL interact with CBP in Drosophila (Kwok et al. 1994; Waltzer and Bienz 1999; Bantignies et al. 2000; Petruk et al. 2001), and Trl is chromatin remodeler and mediator of epigenetic cell memory (Poux et al. 2002; Bejarano and Busturia 2004; Ringrose and Paro 2007; Tie et al. 2009). Subsequent analysis of DNA sequences corresponding to empirical CBP ROIs confirmed colocalization of Mad, Medea, Brinker, and Trl, as well as TATA-binding protein (TBP), Hairy, and Bric-à-brac 1 (FDR < 0.05). These results are consistent with our hypothesis that locus- and caste-specific CBP activity may be caused in part by its differential recruitment by TFs.
CBP shows evolutionarily expanded binding near developmental and neuronal genes
Our results suggest that CBP activity could modulate caste-specific transcriptome states through enhancer regulation, since CBP binding sites are enriched for H3K4me1, H3K27ac, and TF motifs (Fig. 6D; Supplemental Fig. 21C), a combination that is predictive of transcriptional enhancers (Heintzman et al. 2009; Kim et al. 2010). Interestingly, we found that H3K4me1 shows dramatically greater prevalence in ants (28% after conservatively masking repetitive ant ROIs) (see Fig. 1A) compared with flies (2%) (Nègre et al. 2011), suggesting that several genes may have acquired enhancer-based gene regulation during evolution of the ant lineage. To test this, we reanalyzed available ChIP-seq data for CBP in Drosophila adult females (i.e., from pooled tissues at a comparable developmental stage) (Nègre et al. 2011) and identified a comparable number of ROIs as in C. floridanus, relative to genome size; that is, 1.4-fold fewer CBP ROIs for a 1.7-fold smaller genome (Fig. 7A). In addition, orthologous genes (n = 7042) have similar numbers of CBP ROIs between species (Fig. 7B), both among exons and introns (data not shown). This indicates that comparison of CBP ROIs between species is not biased by methodological differences (e.g., different antibodies). We then examined between-species differences in the number of CBP ROIs associated with each orthologous gene, considering 50 kb of distal promoter sequence. Overall, 1219 orthologous genes exhibit more CBP ROIs in ants than flies. GO analysis of the 105 genes with at least 13 more ROIs in ants than flies (one standard deviation) revealed enrichment for 50 categories (FDR < 0.05) of genes involved in development (e.g., canoe, cricklet, Mes2) and neuronal function (e.g., CAMKIIB, Dscam2, glutamate receptor IR76b, Neprilysin 3, Synaptotagmin 12, Synaptogamin 14) (Supplemental Table 9). On average, CBP-enriched genes show greater enrichment for CBP, H3K4me1, and H3K27ac in minors (compared with majors) at CBP ROIs (Fig. 7C). These genes also exhibit greater caste variation in RNA expression compared with all orthologs (P < 0.02) or to genes showing evolutionary reduction of CBP ROIs (P < 0.005); this relationship holds for both H+T and brain tissue samples (Fig. 7D). These results suggest that evolution of gene regulation by the enhancer-binding activity of CBP may have played an important role in facilitating development of phenotypically distinct worker castes.
Figure 7.

Genes with evolutionarily increased CBP binding exhibit increased caste variability. (A) Comparison of significant CBP ROIs identified by the same method and parameters using adult female ChIP-seq data for D. melanogaster and C. floridanus. Total significant ROIs are indicated on left (P < 0.05) and total assembled genome sizes are indicated (in megabase pairs, Mb) on right. (Uextra and mitochondrial chromosomes are excluded for Drosophila). (B) Distributions of CBP ROIs occurring within open reading frames (ORFs; exons+introns) of orthologous genes (n = 7042 orthologs). (C) Comparison of mRNA expression (left) and ChIP enrichment (right) between majors and minors for 601 genes showing more than five CBP ROIs in ants compared with flies; similar results found using different cutoffs (data not shown). Error bars denote SE over genes. ChIP enrichment profiles are shown for CBP, H3K4me1, and H3K27ac averaged over the CBP ROIs located within 50 kb of these ant CBP-enriched genes. (FPKM) Fragments per kilobase per million (mapped) reads (proxy for mRNA expression level). (D) Absolute difference in log2(FPKM+1) mRNA expression between majors and minors for 7042 orthologs (gray), 1219 genes with at least one more CBP ROI in ants than flies (green), and 5562 genes with at least one more CBP ROI in flies than ants (red). RNA-seq data from head+thorax and brain tissues are shown. P-values estimated using a two-tailed Mann-Whitney U-test.
Discussion
Changes in chromatin organization among adult ant castes are pervasive, globally coordinated among tissues, and potentially modulated by CBP. Since caste fate is initially determined during larval development among genetically equivalent siblings, we hypothesize that mechanisms that modulate chromatin structure, including transcription factor and enhancer mediated gene regulation, may underlie the generation of caste differences in larvae and epigenetic maintenance of caste morphology and social behavior in adults. These mechanisms may have been evolutionarily favored to facilitate development of specialized worker castes, both because worker morphology emerges as a quantitative response to environmental stimuli (Wilson 1953; Wheeler 1986; Kamakura 2011; Rajakumar et al. 2012) and because histone acetylation and CBP have well-established roles in insect development (Waltzer and Bienz 1999; Petruk et al. 2001) and in behavior, learning, and memory (Alarcón et al. 2004; Peleg et al. 2010). Our results also suggest that activation of chromatin by CBP via H3K27ac may be a more prevalent means for modulating polyphenic gene expression in worker castes than chromatin repression (e.g., by PRC1/2 via H3K27me3) (Tie et al. 2009). Furthermore, they raise the possibility that regulation of histone acetylation in general might modulate caste identity in both ants and honeybees, as royal jelly (fed to queen-destined larvae) contains a HDAC inhibitor (Spannhoff et al. 2011), in addition to factors that modulate DNA methylation (Kucharski et al. 2008) and insulin and endocrine signaling (Kamakura 2011; Mutti et al. 2011).
These results tentatively suggest that histone PTMs and DNA methylation may have complementary roles in the regulation of social insect caste identity. In C. floridanus and in honeybee, methylation of CpG dinucleotides accumulates predominantly over exons of active genes, where changes in DNA methylation among castes are linked to alternative mRNA splicing, but not necessarily changes in mRNA levels (Lyko et al. 2010; Bonasio et al. 2012). Intriguingly however, some ant genes show changes in DNA methylation associated with monoallelic expression, suggesting that ants might utilize DNA methylation for a kind of imprinting regulation (see Ferguson-Smith 2012). In contrast, we found that histone PTMs strongly correlate with gene expression levels and that changes in PTM enrichment between castes accumulate in noncoding, regulatory regions near genes, especially for H3K27ac (Fig. 2D,F; Supplemental Fig. 9G) and partially explain changes in mRNA levels. These observations suggest a general role for chromatin structure in the regulation of gene expression plasticity. It will be intriguing to see whether common mechanistic relationships emerge from future comparisons of DNA methylation and histone PTMs in ants and other social insects.
In conclusion, our findings implicate chromatin structure as an important factor associated with ant caste specification and suggest several avenues for further investigation, including discovery of additional caste-specific PTMs, perturbation of HATs, HDACs, and the bromodomain-containing proteins (including CBP) that recognize acetylated lysines (Filippakopoulos et al. 2010; Borah et al. 2011), and genomic comparison of PTMs, DNA methylation, and associated enzymes across social and solitary insects (Gadau et al. 2012). Such studies would further characterize the specific role of chromatin in generating and maintaining plasticity in the morphology and behavior of social insects and could provide significant insight into epigenetic mechanisms involved in other organismal and cellular differentiation systems.
Methods
Chromatin immunoprecipitation and ChIP-seq library preparation
Chromatin immunoprecipitation (ChIP) libraries were prepared from pools of major, minor, and male ants after removing the abdomen (head and thorax, H+T) or dissecting whole brains. H+T samples were obtained from a single lab-reared colony established by one single-mated queen collected in the Florida Keys. For brain samples, we pooled tissue from two colonies. Our chromatin immunoprecipitation (ChIP) protocol is based on existing protocols (Amberg et al. 2000; Nègre et al. 2006), but has been optimized for ants. Tissue material was collected and homogenized first on dry ice, then on ice in cross-linking buffer (60 mM KCl, 1 5mM NaCl, 4 mM MgCl2, 0.1% Triton X-100, 50 mM HEPES at pH 7.5 with protease inhibitor) with 1.8% formaldehyde for 10 min. For CBP, additional long chain cross-linking was carried out first with 500 mM EGS (Ethylene Glycol-bis Succinimidylsuccinate, fresh made in DMSO) for 10 min, followed by 1.8% formaldehyde cross-linking for 10 min (Zeng et al. 2006). Cross-linking was terminated by adding 2.5 M glycine to a final concentration of 125 mM for 5 min. Cuticles were discarded and homogenate was transferred to a new tube and centrifuged for 3 min, 4000g at 4°C. Pellet was washed once with lysis buffer (50 mM HEPES-KOH at pH 7.5, 140 mM NaCl, 1 mM EDTA, 0.5% Triton X-100, 0.1% Na-deoxycholate, 0.5% N-lauroylsarcosine with protease inhibitors) and centrifuged again. The resulting pellet was resuspended in lysis buffer and sonicated using a Bioruptor (Diagenode) for 10 min with 30 sec on and 30 sec off cycles. Samples were centrifuged for 10 min, 20,000g at 4°C and supernatant collected as starting material for ChIP.
A 30-μL mixture of protein A and protein G beads (Invitrogen) was used to immunoprecipitate each sample. Beads were washed three times with blocking buffer (0.25% BSA in PBS) then incubated with 5 μg of antibodies in 500 μL of blocking buffer for 4 h to allow antibody binding. Following binding, beads were washed three times with blocking buffer. A total of 500 μg of chromatin was added to beads for each ChIP and incubated overnight at 4°C. Beads were washed sequentially with following buffers: twice with lysis buffer, once with FA-500mM buffer (50 mM HEPES-KOH at pH7.5, 500 mM NaCl, 1 mM EDTA, 0.1% TritonX-100), twice with LiCl buffer (10 mM Tris-HCl at pH8.0, 0.25 M LiCl, 1 mM EDTA, 0.5% NP40), and once with TE at pH 8.0. Beads were then eluted three times with 100 μL of TES buffer each (50 mM Tris-HCl at pH 8.0, 10 mM EDTA, 1% SDS) at 65°C for 15 min. 12 μL of 5 M NaCl was added to the pooled eluate, which was then incubated at 65°C overnight to reverse the cross-linking. Samples were treated with 5 μL of 20mg/mL protease K at 37°C for 1 h, and DNA was subsequently purified. These ChIP samples (purified DNA) were used for high throughput sequencing or quantitative real-time PCR (qPCR). Sequencing libraries were constructed according to the manufacturer's instructions (Illumina) and sequenced using the Illumina GAII× and HiSeq 2000 platforms (see Supplemental Table 1).
Quantitation and normalization of ChIP-seq data
ChIP-seq data are comprised of single-end reads and were mapped to the C. floridanus reference genome (v3.0) using Bowtie (Langmead et al. 2009), allowing 1 mismatch and up to 50 alignments per read (“-v 1 -k 50–best”). Read and alignment statistics are presented in Supplemental Table 1. Mapped reads likely generated by spurious PCR amplification of DNA templates were removed from all samples based on sequence similarity criteria, as described in the Supplemental Methods. Also, to reduce computational complexity, only the top five alignments per mapped (ranked by mismatches) read were used for quantitation.
Quantitation of ChIP-seq read maps was carried out using custom software written in Python and C. Briefly, estimates of per-nucleotide ChIP enrichment were computed using a Bayesian probability model and are defined as  , where
  is the log2 ChIP enrichment score for PTM p in caste c at nucleotide locus l.
  is the posterior probability that p binds locus l in caste c given the three caste-specific aligned read sets Rc for PTM p, total histone H3 n, and input i and converted to an enrichment score using the phred-like transformation
  . Posterior probabilities were estimated using both unique and non-unique reads (see Simola and Kim 2011), controlling for several sources of bias, including differences in nucleosome density and DNA accessibility within and between castes (using caste-specific total histone H3 and input data), read length and fragment length variation among samples, and variation in overall read coverage among samples and among castes. These ChIP enrichment scores are proportional to standard ChIP/background enrichment ratios (Supplemental Figure 2). To normalize for variation in ChIP enrichment score distributions among castes for the same sample p,
  were centered by the genome-wide mean enrichment
  and scaled by the standard deviation. See Supplemental Methods for additional details.
RNA-seq library preparation and quantitation
RNA-seq data for C. floridanus majors, minors, and males were taken from Bonasio et al. (2010) and reanalyzed together with additional biological replicate RNA-seq data for majors and minors. These additional replicates were prepared as described in Bonasio et al. (2010). Two independent RNA-seq biological replicates were also prepared from whole brains dissected from majors and minors, pooling individuals from two colonies. Brain samples were prepared as follows. Total RNA was isolated from dissected ant brains using QIAzol lysis reagent (Qiagen). PolyA mRNA was purified from total RNA samples using PolyT beads (Invitrogen mRNA Direct Kit). Sequencing libraries were constructed using the NEBNext mRNA Library Prep Kit (New England Biolabs) according to the manufacturer's instructions.
Raw data for all RNA-seq samples were mapped using Bowtie+Tophat (Langmead et al. 2009) allowing one mismatch and up to 50 alignments per read (“-v 1 -k 50–best”) and default parameter values otherwise. Expression levels for previously annotated gene models (Bonasio et al. 2010) were quantified with these RNA-seq maps using Cufflinks (Trapnell et al. 2010), correcting for fragment bias (“–frag-bias-correct”) and uncertain alignment location (“–multi-read-correct”) and default parameter values otherwise.
qPCR validation of caste-specific genes
ChIP and RNA samples were prepared for qPCR or reverse transcription qPCR (RT-qPCR) from material collected from five different colonies for each caste using pools of several individuals. RNA samples were normalized to GAPDH, and H3K27ac samples were normalized to total H3. GAPDH was selected as a stably expressed normalization control for RT-PCR based on empirical testing, using pools of head and thoracic tissues from different castes and colonies; i.e., comparing GAPDH expression between replicates of the same caste and between castes showed similar standard errors; data not shown.
Data access
Sequencing data from this study have been deposited in the NCBI Gene Expression Omnibus (GEO) (http://www.ncbi.nlm.nih.gov/geo/) under accession number GSE37523.
Acknowledgments
We thank K. Haight for ant colony maintenance; the Perelman School of Medicine Next-Generation Sequencing Core and Penn Genome Frontiers Institute for sequencing and computational support; and T. Linksvayer, P. Shah, and L. Zwiebel for helpful comments and advice on an earlier draft of this manuscript. D.F.S. was supported in part by a postdoctoral training grant from the University of Pennsylvania Department of Cell and Developmental Biology. R.B. was supported in part by a postdoctoral fellowship from the Helen Hay Whitney Foundation. This work was funded by a Hughes Medical Institute Collaborative Innovation Award #2009005 to D.R., S.L.B., and J.L.
Footnotes
[Supplemental material is available for this article.]
Article published online before print. Article, supplemental material, and publication date are at http://www.genome.org/cgi/doi/10.1101/gr.148361.112.
References
- Alarcón JM, Malleret G, Touzani K, Vronskaya S, Ishii S, Kandel ER, Barco A 2004. Chromatin acetylation, memory, and LTP are impaired in CBP+/− mice: A model for the cognitive deficit in Rubinstein-Taybi syndrome and its amelioration. Neuron 42: 947–959 [DOI] [PubMed] [Google Scholar]
- Amberg DC, Burke DJ, Strathern JN 2000. Methods in yeast genetics: A Cold Spring Harbor laboratory course manual, pp. 149–154. Cold Spring Harbor Laboratory Press, Cold Spring Harbor, NY [Google Scholar]
- Ament SA, Corona M, Pollock HS, Robinson GE 2008. Insulin signaling is involved in the regulation of worker division of labor in honey bee colonies. Proc Natl Acad Sci 105: 4226–4231 [DOI] [PMC free article] [PubMed] [Google Scholar]
- Bantignies F, Goodman RH, Smolik SM 2000. Functional interaction between the coactivator Drosophila CREB-binding protein and ASH1, a member of the trithorax group of chromatin modifiers. Mol Cell Biol 20: 9317–9330 [DOI] [PMC free article] [PubMed] [Google Scholar]
- Bejarano F, Busturia A 2004. Function of the trithorax-like gene during Drosophila development. Dev Biol 268: 327–341 [DOI] [PubMed] [Google Scholar]
- Berger SL 1999. Gene activation by histone and factor acetyltransferases. Curr Opin Cell Biol 11: 336–341 [DOI] [PubMed] [Google Scholar]
- Berger SL 2007. The complex language of chromatin regulation during transcription. Nature 447: 407–412 [DOI] [PubMed] [Google Scholar]
- Bonasio R, Zhang G, Ye C, Mutti NS, Fang X, Qin N, Donahue G, Yang P, Li Q, Li C, et al. 2010. Genomic comparison of the ants Camponotus floridanus and Harpegnathos saltator. Science 329: 1068–1071 [DOI] [PMC free article] [PubMed] [Google Scholar]
- Bonasio R, Li Q, Lian J, Mutti NS, Jin L, Zhao H, Zhang P, Wen P, Xiang H, Ding Y, et al. 2012. Genome-wide and caste-specific DNA methylomes of the ants Camponotus floridanus and Harpegnathos saltator. Curr Biol 22: 1755–1764 [DOI] [PMC free article] [PubMed] [Google Scholar]
- Borah JC, Mujtaba S, Karakikes I, Zeng L, Muller M, Patel J, Moshkina N, Morohashi K, Zhang W, Gerona-Navaroo G, et al. 2011. A small molecule binding to the coactivator creb-binding protein blocks apoptosis in cardiomyocytes. Chem Biol 18: 531–541 [DOI] [PMC free article] [PubMed] [Google Scholar]
- Corona M, Velarde RA, Remolina S, Moran-Lauter A, Wang Y, Hughes KA, Robinson GE 2007. Vitellogenin, juvenile hormone, insulin signaling, and queen honey bee longevity. Proc Natl Acad Sci 104: 7128–7133 [DOI] [PMC free article] [PubMed] [Google Scholar]
- Dupuy F, Sandoz JC, Giurfa M, Josens MR 2006. Individual olfactory learning in Camponotus ants. Anim Behav 72: 1081–1091 [Google Scholar]
- Elango N, Hunt BG, Goodisman MA, Yi SV 2009. DNA methylation is widespread and associated with differential gene expression in castes of the honeybee, Apis mellifera. Proc Natl Acad Sci 106: 11206–11211 [DOI] [PMC free article] [PubMed] [Google Scholar]
- Evans JD, Wheeler DE 2001. Gene expression and the evolution of insect polyphenisms. Bioessays 23: 62–68 [DOI] [PubMed] [Google Scholar]
- Ferguson-Smith AC 2012. Genomic imprinting: The emergence of an epigenetic paradigm. Nat Rev Genet 12: 565–575 [DOI] [PubMed] [Google Scholar]
- Filippakopoulos P, Qi J, Picaud S, Shen Y, Smith WB, Fedorov O, Morse EM, Keates T, Hickman TT, Felletar I, et al. 2010. Selective inhibition of BET bromodomains. Nature 468: 1067–1073 [DOI] [PMC free article] [PubMed] [Google Scholar]
- Gadau J, Helmkampf M, Nygaard S, Roux J, Simola DF, Smith CR, Suen G, Wurm Y, Smith CD 2012. The genomic impact of 100 million years of social evolution in seven ant species. Trends Genet 28: 14–21 [DOI] [PMC free article] [PubMed] [Google Scholar]
- Heintzman ND, Hon GC, Hawkins RD, Kheradpour P, Stark A, Harp LF, Ye Z, Lee LK, Stuart RK, Ching CW, et al. 2009. Histone modifications at human enhancers reflect global cell-type-specific gene expression. Nature 459: 108–112 [DOI] [PMC free article] [PubMed] [Google Scholar]
- Hölldobler B, Wilson EO 1990. The ants. The Belknap Press of Harvard University Press, Cambridge, MA [Google Scholar]
- Jin Q, Yu LR, Wang L, Zhang Z, Kasper LH, Lee JE, Wang C, Brindle PK, Dent SY, Ge K 2011. Distinct roles of GCN5/PCAF-mediated H3K9ac and CBP/p300-mediated H3K18/27ac in nuclear receptor transactivation. EMBO J 30: 249–262 [DOI] [PMC free article] [PubMed] [Google Scholar]
- Kamakura M 2011. Royalactin induces queen differentiation in honeybees. Nature 473: 478–483 [DOI] [PubMed] [Google Scholar]
- Kim TK, Hemberg M, Gray JM, Costa AM, Bear DM, Wu J, Harmin DA, Laptewicz M, Barbara-Haley K, Kuersten S, et al. 2010. Widespread transcription at neuronal activity-related enhancers. Nature 465: 182–187 [DOI] [PMC free article] [PubMed] [Google Scholar]
- Kucharski R, Maleszka J, Foret S, Maleszka R 2008. Nutritional control of reproductive status in honeybees via DNA methylation. Science 319: 1827–1830 [DOI] [PubMed] [Google Scholar]
- Kwok RP, Lundblad JR, Chrivia JC, Richards JP, Bächinger HP, Brennan RG, Roberts SG, Green MR, Goodman RH 1994. Nuclear protein CBP is a coactivator for the transcription factor CREB. Nature 370: 223–226 [DOI] [PubMed] [Google Scholar]
- Langmead B, Trapnell C, Pop M, Salzberg SL 2009. Ultrafast and memory-efficient alignment of short DNA sequences to the human genome. Genome Biol 10: R25. [DOI] [PMC free article] [PubMed] [Google Scholar]
- Larschan E, Bishop EP, Kharchenko PV, Core LJ, Lis JT, Park PJ, Kuroda MI 2011. X chromosome dosage compensation via enhanced transcriptional elongation in Drosophila. Nature 471: 115–118 [DOI] [PMC free article] [PubMed] [Google Scholar]
- Levenson JM, Sweatt JD 2005. Epigenetic mechanisms in memory formation. Nat Rev Neurosci 6: 108–118 [DOI] [PubMed] [Google Scholar]
- Lucas C, Sokolowski MB 2009. Molecular basis for changes in behavioral state in ant social behaviors. Proc Natl Acad Sci 106: 6351–6356 [DOI] [PMC free article] [PubMed] [Google Scholar]
- Lyko F, Foret S, Kucharski R, Wolf S, Falckenhayn C, Maleszka R 2010. The honey bee epigenomes: Differential methylation of brain DNA in queens and workers. PLoS Biol 8: e1000506. [DOI] [PMC free article] [PubMed] [Google Scholar]
- Montooth KL, Marden JH, Clark AG 2003. Mapping determinants of variation in energy metabolism, respiration and flight in Drosophila. Genetics 165: 623–635 [DOI] [PMC free article] [PubMed] [Google Scholar]
- Mutti NS, Dolezal AG, Wolschin F, Mutti JS, Gill KS, Amdam GV 2011. IRS and TOR nutrient-signaling pathways act via juvenile hormone to influence honey bee caste fate. J Exp Biol 214: 3977–3984 [DOI] [PMC free article] [PubMed] [Google Scholar]
- Nègre N, Lavrov S, Hennetin J, Bellis M, Cavalli G 2006. Mapping the distribution of chromatin proteins by ChIP on chip. Methods Enzymol 410: 316–341 [DOI] [PubMed] [Google Scholar]
- Nègre N, Brown CD, Ma L, Bristow CA, Miller SW, Wagner U, Kheradpour P, Eaton ML, Loriaux P, Sealfon R, et al. 2011. A cis-regulatory map of the Drosophila genome. Nature 471: 527–531 [DOI] [PMC free article] [PubMed] [Google Scholar]
- Nelson CM, Ihle KE, Fondrk MK, Page RE, Amdam GV 2007. The gene vitellogenin has multiple coordinating effects on social organization. PLoS Biol 5: e62. [DOI] [PMC free article] [PubMed] [Google Scholar]
- Nijhout HF 1999. Control mechanisms of polyphenic development in insects. Bioscience 49: 181–192 [Google Scholar]
- Peleg S, Sananbenesi F, Zovoilis A, Burkhardt S, Bahari-Javan S, Agis-Balboa RC, Cota P, Wittnam JL, Gogol-Doering A, Opitz L, et al. 2010. Altered histone acetylation is associated with age-dependent memory impairment in mice. Science 7: 753–756 [DOI] [PubMed] [Google Scholar]
- Petruk S, Sedkov Y, Smith S, Tillib S, Kraevski V, Nakamura T, Canaani E, Croce CM, Mazo A 2001. Trithorax and dCBP acting in a complex to maintain expression of a homeotic gene. Science 294: 1331–1334 [DOI] [PubMed] [Google Scholar]
- Poux S, Horard B, Sigrist CJ, Pirrotta V 2002. The Drosophila Trithorax protein is a coactivator required to prevent reestablishment of Polycomb silencing. Development 129: 2483–2493 [DOI] [PubMed] [Google Scholar]
- Rajakumar R, San Mauro D, Dijkstra MB, Huang MH, Wheeler DE, Hiou-Tim F, Khila A, Cournoyea M, Abouheif E 2012. Ancestral developmental potential facilitates parallel evolution in ants. Science 335: 79–82 [DOI] [PubMed] [Google Scholar]
- Ringrose L, Paro R 2007. Polycomb/Trithorax response elements and epigenetic memory of cell identity. Development 134: 223–232 [DOI] [PubMed] [Google Scholar]
- Roudier F, Ahmed I, Bérard C, Sarazin A, Mary-Huard T, Cortijo S, Bouyer D, Caillieux E, Duvernois-Berthet E, Al-Shikhley L 2011. Integrative epigenomic mapping defines four main chromatin states in Arabidopsis. EMBO J 30: 1928–1938 [DOI] [PMC free article] [PubMed] [Google Scholar]
- Schones DE, Cui K, Cuddapah S, Roh TY, Barski A, Wang Z, Wei G, Zhao K 2008. Dynamic regulation of nucleosome positioning in the human genome. Cell 132: 887–898 [DOI] [PMC free article] [PubMed] [Google Scholar]
- Schwander T, Lo N, Beekman M, Oldroyd BP, Keller L 2010. Nature versus nurture in social insect caste differentiation. Trends Ecol Evol 25: 275–282 [DOI] [PubMed] [Google Scholar]
- Seehuus SC, Norberg K, Gimsa U, Krekling T, Amdam GV 2006. Reproductive protein protects functionally sterile honey bee workers from oxidative stress. Proc Natl Acad Sci 103: 962–967 [DOI] [PMC free article] [PubMed] [Google Scholar]
- Simola DF, Kim J 2011. Sniper: Improved SNP discovery by multiply mapping deep sequenced reads. Genome Biol 12: R55. [DOI] [PMC free article] [PubMed] [Google Scholar]
- Smith CR, Toth AL, Suarez AV, Robinson GE 2008. Genetic and genomic analyses of the division of labour in insect societies. Nat Rev Genet 9: 735–748 [DOI] [PubMed] [Google Scholar]
- Spannhoff A, Kim YK, Raynal NJ, Gharibyan V, Su MB, Zhou YY, Li J, Castellano S, Sbardella G, Issa JP, et al. 2011. Histone deacetylase inhibitor activity in royal jelly might facilitate caste switching in bees. EMBO Rep 12: 238–243 [DOI] [PMC free article] [PubMed] [Google Scholar]
- Stearns SC 1989. The evolutionary significance of phenotypic plasticity. Bioscience 39: 436–445 [Google Scholar]
- Tie F, Banerjee R, Stratton CA, Prasad-Sinha J, Stepanik V, Zlobin A, Diaz MO, Scacheri PC, Harte PJ 2009. CBP-mediated acetylation of histone H3 lysine 27 antagonizes Drosophila Polycomb silencing. Development 136: 3131–3141 [DOI] [PMC free article] [PubMed] [Google Scholar]
- Trapnell C, Williams BA, Pertea G, Mortazavi A, Kwan G, van Baren MJ, Salzberg SL, Wold BJ, Pachter L 2010. Transcript assembly and quantification by RNA-seq reveals unannotated transcripts and isoform switching during cell differentiation. Nat Biotechnol 28: 511–515 [DOI] [PMC free article] [PubMed] [Google Scholar]
- Valentine JW, Collins AG, Meyer CP 1994. Morphological complexity increase in metazoans. Paleobiol 20: 131–142 [Google Scholar]
- Waltzer L, Bienz L 1999. A function of CBP as a transcriptional co-activator during Dpp signalling. EMBO J 18: 1630–1641 [DOI] [PMC free article] [PubMed] [Google Scholar]
- West-Eberhard MJ. 2003. Developmental plasticity and evolution. Oxford University Press, Oxford, New York. [Google Scholar]
- Wheeler DE 1986. Developmental and physiological determinants of caste in social Hymenoptera: Evolutionary implications. Am Nat 128: 13–34 [Google Scholar]
- Wheeler DE 1991. The developmental basis of worker caste polymorphism in ants. Am Nat 138: 1218–1238 [Google Scholar]
- Wilson EO 1953. The origin and evolution of polymorphism in ants. Q Rev Biol 28: 136–156 [DOI] [PubMed] [Google Scholar]
- Zeng PY, Vakoc CR, Chen ZC, Blobel GA, Berger SL 2006. In vivo dual cross-linking for identification of indirect DNA-associated proteins by chromatin immunoprecipitation. Biotechniques 41: 694–698 [DOI] [PubMed] [Google Scholar]