

Abstract
The objective was to demonstrate decision-analytic modeling in support of Child Welfare policymakers considering implementing evidence-based interventions. Outcomes included permanency (e.g., adoptions) and stability (e.g., foster placement changes). Analyses of a randomized trial of KEEP -- a foster parenting intervention -- and NSCAW-1 estimated placement change rates and KEEP's effects. A microsimulation model generalized these findings to other Child Welfare systems. The model projected that KEEP could increase permanency and stability, identifying strategies targeting higher-risk children and geographical regions that achieve benefits efficiently. Decision-analytic models enable planners to gauge the value of potential implementations.
Keywords: Child Welfare, Foster Home Care, Public Policy, Evidence-Based Practice, Computer Simulation
Introduction
In 2007, approximately 3.2 million allegations of child maltreatment involving over 5.8 million children occurred in the US. Child Welfare agencies (CWAs) investigated 1.8 million allegations and substantiated 24.1% involving 794,000 children (“Child Maltreatment 2007,” 2007). The type and quality of services provided to youth in CWAs have profound implications for their physical and mental well-being, chances for stable and permanent homes, government budgets and broader societal costs. Despite the development of effective, evidence-based parenting interventions that could improve the quality of CWAs′ services (Chamberlain, Leve, & DeGarmo, 2007; Chamberlain et al., 2008; Chamberlain & Reid, 1991, 1994; Eddy & Chamberlain, 2000; Edwards & Lutzker, 2008; Gershater-Molko, Lutzker, & Wesch, 2003; Leve & Chamberlain, 2004; Lutzker, Frame, & Rice, 1982; Price et al., 2008), such interventions have not been widely adopted. Child Welfare policymakers face challenges when considering implementing such interventions: gathering and synthesizing available data; translating it into actionable information (Aarons, Hurlburt, & Horwitz, 2011); and weighing the merits of implementing those interventions (Horwitz, Chamberlain, Landsverk, & Mullican, 2010). Findings on evidence-based parenting interventions′ impact on outcomes and costs in CWAs are encouraging but scarce, and rarely calculate their relative value. Therefore, in addition to the implementation issues mentioned previously and the real-world operational challenges faced by Child Welfare administrators, to increase the rates of implementation of evidence-based parent interventions, research is needed that translates study findings into projections of long-term benefits and costs that take account of how CWAs operate.
The tools of decision science are well-suited to supporting Child Welfare policymakers as they confront the challenges of complex, real-world operations and consider implementing new interventions (Claxton, 1999; Gold, 1996; Jackson, Bojke, Thompson, Claxton, & Sharples, 2011; Kuntz & Weinstein, 2001; Lilford, Pauker, Braunholtz, & Chard, 1998; Parmigiani, 2002). Such analyses identify policies and interventions that are most likely to achieve a set of desired objectives given current uncertainties. They employ computer-based models that simulate the long-term, systemic impact of specific alternative courses of action facing decision makers, and they allow for comparisons among these competing alternatives. From these models come recommendations about the best action to take. Despite the successful use of decision-analytic models to consider complex policy decisions for the long-term management of conditions including HIV/AIDS and diabetes (“Cost-effectiveness of intensive glycemic control, intensified hypertension control, and serum cholesterol level reduction for type 2 diabetes,” 2002; Gaspoz et al., 2002; Goldhaber-Fiebert, Stout, Salomon, Kuntz, & Goldie, 2008; Ruiz, 2001), they have rarely been used to consider long-term implications of interventions for children in the US Child Welfare system. A systematic review of 2,640 articles (Goldhaber-Fiebert, Snowden, Wulczyn, Landsverk, & Horwitz, 2011) finds that, although such approaches have been advocated for use in Child Welfare for 20 years (Dubowitz, 1990), their use is rare. The few existing models often use simple extrapolation and have not been published in the peer-reviewed literature (Goldhaber-Fiebert, et al., 2011).
To address the challenges faced by Child Welfare policymakers in choosing to implement evidence-based interventions, we apply decision-analytic modeling to project long-term effects of implementing a promising parenting intervention supported by research data. The current study represents a significant advance over the existing research evaluating interventions to improve services and outcomes for youth in the Child Welfare system. It integrates randomized controlled trial data on a parenting intervention with nationally-representative data on children in US CWAs and applies a detailed microsimulation model to consider the impact of implementing the intervention on a number of child outcomes. Extending the model to include multiple interventions, additional system performance indicators and child outcomes could provide a new level of decision support for Child Welfare decision makers.
Methods
Summary
This study demonstrates the use of decision-analytic modeling to assess youth outcomes relevant to Child Welfare administrators considering the trade-offs of implementing KEEP (Keeping Foster Parents Supported and Trained), a promising parenting intervention with research evidence aimed at increasing placement stability (“California Evidence-Based Clearinghouse for Child Welfare,”). It highlights the advantages and feasibility of this approach with respect to a broader set of evidence-based interventions. We focus on stated goals of the Child Welfare system – stability of foster placements and positive transitions to permanency – that have the potential to impact on mental health outcomes for children.
We estimate rates of placement transitions in the Child Welfare system by analyzing data from a randomized controlled trial (RCT) evaluating the effectiveness of KEEP (Chamberlain, Price, Leve, et al., 2008; Price, et al., 2008) and a nationally-representative observational study, National Survey of Child and Adolescent Well-Being (NSCAW-1). Using the RCT, we estimate KEEP's effects on these rates. We construct a microsimulation model to apply KEEP to US Child Welfare populations represented in NSCAW-1, tracking the paths of many simulated children through foster care and projecting long-term effects of KEEP. It is likely that the consequences of averted placement changes due to KEEP endure well beyond the RCT follow-up period. Furthermore, the RCT was conducted in one county, and state Child Welfare systems differ in terms of placement changes and exit rates from foster care. We use the microsimulation to compare three broad but realistic options: 1) not implementing KEEP; 2) implementing KEEP for all foster homes; 3) targeting KEEP to subpopulations who, based on the extant literature, may benefit more.
Study populations
An RCT of KEEP (Price, et al., 2008) evaluated its delivery to kinship and non-kinship foster parents (n=700) caring for children aged 5-12 in San Diego County, California. This RCT found that foster parents randomly assigned to KEEP as contrasted with those in the comparison condition reported significantly fewer behavior problems (Chamberlain, Price, Leve, et al., 2008). KEEP trains and supports foster parents in groups through a 16-week curriculum based on social learning theory (Price, et al., 2008). The KEEP curriculum promotes the increase of positive reinforcement, consistent use of non-harsh discipline, and the importance of close monitoring as well as strategies for avoiding power struggles, managing peer relationships, and improving school success (Price, et al., 2008). KEEP uses trained paraprofessionals to deliver the 16-week intervention; videotapes all sessions; and corrects deviations from model fidelity via weekly supervisory calls (Chamberlain, Price, Reid, & Landsverk, 2008). The study followed the placement status of an index child in each home over 200 days, comparing placement change rates for children in KEEP and non-KEEP foster homes.
NSCAW-1 is a nationally-representative study of US children who had been referred to and investigated by Child Welfare agencies (Webb, 2010). NSCAW-1 contains longitudinal data on 5,501 children (age 0-14 at baseline) beginning in 1999-2000 and followed for 36 months. NSCAW-1 contains information on rates of foster care placement change and exits along with detailed measures of child and family well-being. To ensure comparability between KEEP and NSCAW-1 analyses, NSCAW-1 analyses were restricted to children who would have been eligible for the KEEP RCT (unweighted n=348).
Outcomes
Primary outcomes were rates of placement change for children in foster care. Placement changes included: 1) positive exits from foster care (e.g., reunification with biological parents, long-term guardianship, and adoption); 2) negative exits from foster care (e.g., placement in a group care setting); 3) foster home changes (i.e., replacement in a different foster home).
Intervention strategies
We compared universal implementation of KEEP to not implementing KEEP (the status quo) for foster parents caring for 5-12 year-olds. Because selective implementation may be an attractive alternative, we explored refined strategies including: 1) targeting KEEP to foster homes housing children at higher-risk for negative exits and placement changes; 2) implementing KEEP on a state-by-state basis to examine whether specific characteristics influence the results.
Analysis
We estimated Cox proportional hazard models for placement changes using the KEEP RCT data and the NSCAW-1 data. Estimation with the KEEP RCT focused on KEEP's impact on placement changes. Estimation with NSCAW-1 focused on nationally-representative rates of foster care placement changes and exits without KEEP.
For the KEEP RCT, covariates included: baseline placement type (kinship or non-kinship foster home); child's age; child's sex; child's primary language (English or Spanish); days in current placement at baseline; ever having prior placements; and whether the child was in a foster home that received KEEP. Additionally, consistent with the original KEEP analysis (Price, et al., 2008), we included an interaction between being in a KEEP foster home and the number of prior foster placements when considering rates of negative exit. This interaction estimated whether KEEP was especially effective among children at greatest risk.
For NSCAW-1, covariates included: baseline placement type (kinship or non-kinship foster home); child's age; child's sex; child's race/ethnicity (black, white, Hispanic, other); reason for placement (physical or sexual abuse, neglect, other); Child Behavior Checklist (CBCL) score (≥64 denoting clinically significant levels of child symptomatology or <64); having any prior Child Welfare placements; having foster placements in the previous year; US geographic region.
Microsimulation model
The microsimulation comprises a computer-based model representing paths of foster children through the Child Welfare system (Figure 1). The model's goals are to extend beyond the time horizon of the original KEEP study, consider a population that is nationally-representative, and assess the implications of multiple foster placement changes over 3 years and KEEP's potential to have compounding effects on these placement changes.
Figure 1. Decision-Analytic Microsimulation Model of Children's Paths through Foster Care.
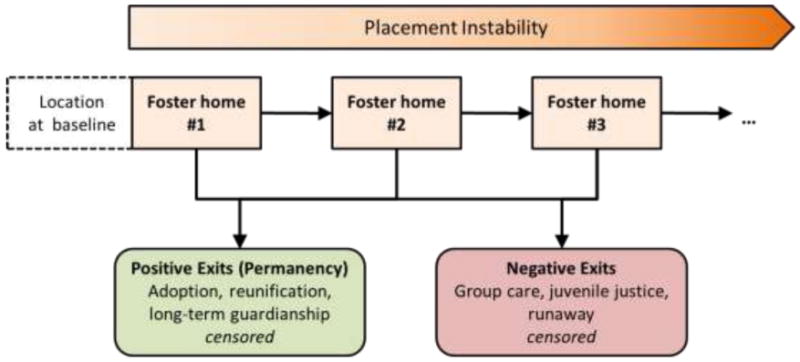
The model diagram illustrates potential paths of each child in foster care. Children aged 5-12 enter the model with particular sets of baseline characteristics (e.g., sex, kinship/non-kinship foster care, race, etc.) representative of the US Child Welfare System. For each child, the microsimulation applies daily risks of exits from foster care and of placement change to another foster home (denoted by the black arrows). Otherwise, they remain in their current placement. Risks of exit and placement change are conditional on each child's baseline characteristics and whether the child resides in a foster home receiving KEEP. Upon placement change, the child's characteristics are updated and subsequent risks reflect this (e.g., the child is now older and has a longer history of placement changes).
The microsimulation begins with a large group of children (1,000,000 simulated individuals) entering the model. To represent the US foster care population, each simulated individual is assigned characteristics based on bootstrap sampling from the characteristics and correlations of characteristics in the actual NSCAW-1 sample including the geographic region and consequently the Child Welfare system to which they pertain. Next, the microsimulation exposes each child to daily risks of each type of placement change (see Appendix). Risks are conditional on a child's characteristics (including the type of foster home he is currently in and which Child Welfare system he is in), being in a foster home receiving the KEEP intervention, and the current time in the model. The statistical models estimated above form the inputs for computing these risks with coefficients for all covariates from the NSCAW-1 regressions except coefficients for the effect of being in a KEEP foster home which come from the KEEP RCT regressions. Children exit the model if they experience a positive or negative exit from a foster home. However, unlike in the Cox models, the microsimulation continues to follow children who change foster home placements, updating their placement history and other baseline characteristics and thereby altering their future risks of additional placement changes and exits. The microsimulation produces synthetic, time-to-event data, and outcomes are then computed with this synthetic data using standard statistics (e.g., the cumulative risk of negative exit is defined as the number of children with negative exits divided by the size of the total starting cohort). In terms of assigning KEEP to foster homes, the microsimulation performs the entire 1,000,000 child simulation in both the presence and absence of the KEEP intervention, essentially equivalent to random assignment of the KEEP intervention. We propagate the uncertainty from the KEEP and NSCAW-1 analyses on which the model is based via bootstrapping all regression model coefficients (see Statistical Methods).
Sensitivity analyses
We performed sensitivity analyses exploring the impacts of: 1) potential differences in KEEP's effect (potentially due to less than perfect fidelity of implementing KEEP) outside the clinical trial setting and in the Child Welfare systems of other states and regions; 2) potential attenuation of KEEP's effect for follow-up periods longer than the duration of the original KEEP trial (200 days), given that projections of NSCAW-1 are for 1,095 days. To examine the potential differences in KEEP's effect, we increased or decreased it between 50% and 150%, multiplying the regression coefficients for being in a KEEP treatment foster home by (0.50, 0.75, 1.00, 1.25, and 1.50) and then performing the fully bootstrapped microsimulations described above. To examine the potential attenuation of KEEP's effect, we linearly reduced the regression coefficients for being in a KEEP treatment foster home from 100% of their base case value at day 200 to either being fully attenuated (0% of their base case value) or partially attenuated (50% of their base case value) at day 1,095 and again performed the fully bootstrapped microsimulations described above.
Statistical methods
The NSCAW study used a complex sampling design (e.g., case weights and clustering) (see http://www.ndacan.cornell.edu). We included standard adjustments for sampling design and weights (Levy & Lemeshow, 2008) in all analyses, which were undertaken in SAS, SUDAAN, and Stata.
Microsimulation projections included both point estimates and confidence intervals. Uncertainty reflected in these confidence intervals is based on bootstrapping the statistical analyses of KEEP and NSCAW-1. From our Cox proportional hazard model results, we bootstrapped 1,000 sets of each of our regression coefficients and baseline hazard functions using the covariance matrices. We generated the microsimulation's confidence intervals by repeating all simulations with each of these 1,000 sets of coefficients and baseline hazard functions for each intervention strategy. The 5th and 95th percentiles of simulated outcomes across the 1,000 bootstrap samples form the 95% confidence interval. The microsimulation model is implemented in the C++ programming language (Law & Kelton, 2000; Matsumoto & Nishimura, 1998).
Institutional review
Both the original KEEP RCT and NSCAW-1 studies were approved by relevant human subjects committees. For this analysis, Stanford University's Human Subjects Committee determined that the secondary analysis of de-identified data was exempt from additional review (April 19, 2010).
Results
Analyses of empirical data on foster placement changes
The 5-12 year-olds in foster care at baseline in the KEEP RCT and NSCAW-1 had similar mean ages (8.8 years and 8.7 years) and sex ratios (48% and 44% male) (Table 1). As the KEEP sample was drawn from San Diego county and NSCAW was nationally-representative, the two differed in terms of kinship foster care placement at baseline (greater in KEEP), race/ethnicity (more Hispanic children in KEEP), and having had a prior Child Welfare placement (higher in KEEP). Notably, NSCAW-1 provides a rich set of variables surrounding the children's prior experience (e.g., reason for foster placement) as well as their level of behavioral symptomatology (e.g., CBCL scores) that have been shown to be predictive for subsequent outcomes.
Table 1.
Baseline population characteristics*
| KEEP RCT n=700 |
NSCAW-1 n=394** |
|
|---|---|---|
| Child's age (years) (SD) | 8.8 (2.2) | 8.7 (2.3) |
| Male (%) | 48% | 44% |
| Placed in kinship foster care (%) | 34% | 19% |
| Foster homes receiving KEEP (%) | 53% | 0% |
| Any prior placements (%) | 87% | 57% |
| Prior placements at baseline (SD) | 2.9 (2.9) | na |
| Days in current placement (SD) | 468 (829) | na |
| Spanish is primary language (%) | 28% | na |
| Reason for placement | ||
| Physical/sexual abuse | na | 48% |
| Neglect | na | 43% |
| Other | na | 9% |
| High CBLC (≥64) | na | 47% |
| Race/ethnicity | ||
| White | 22% | 48% |
| Black | 21% | 33% |
| Hispanic | 33% | 14% |
| Other | 24% | 5% |
| Geographic location (NSCAW)*** | ||
| Region 1 (%) | 22% | |
| Region 2 (%) | 12% | |
| Region 3 (%) | 3% | |
| Region 4 (%) | 7% | |
| Region 5 (%) | 5% | |
| Region 6 (%) | 4% | |
| Region 7 (%) | 1% | |
| Region 8 (%) | 6% | |
| Region 9 (%) | 41% |
na means not available in the data set
All NSCAW data shown are weighted and adjusted for the survey design
Region 9 is a composite of child welfare agencies from 38 states and the District of Columbia. All other regions represent individual states.
Despite differences between KEEP and NSCAW-1, the Kaplan-Meier survival estimates for the control arm of KEEP and for an equivalently selected population from NSCAW-1 are similar through KEEP's follow-up period (Figure 2), indicating that extrapolating KEEP to NSCAW-1 is reasonable. Furthermore, predictors of exits from foster homes and placement changes were largely consistent between KEEP and NSCAW-1 (Table 2). Older children were significantly less likely to have positive exits than younger children, and in the NSCAW sample were more likely to have negative exits. Children with greater numbers of prior Child Welfare placements were more likely to have negative exits from their baseline foster home. Children in kinship foster care at baseline were less likely to have a placement change.
Figure 2. Rates of Foster Care Placement Change and Exit Observed in the KEEP study and NSCAW-1.
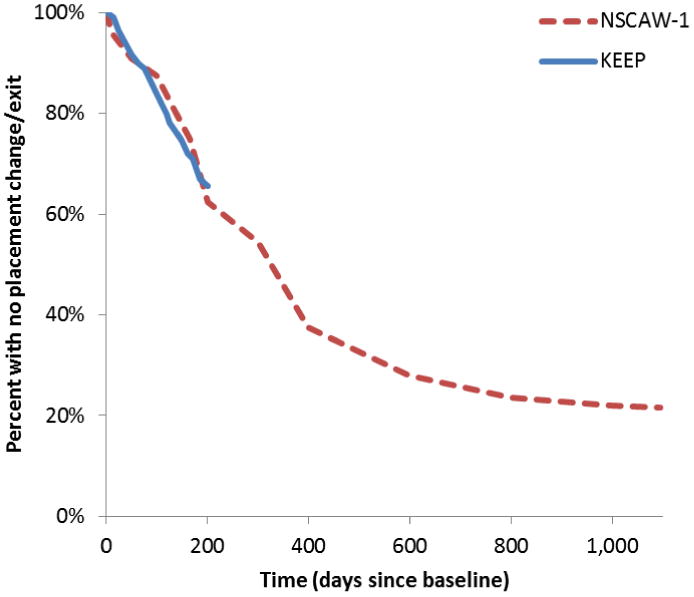
The graph shows Kaplan-Meier survival curves characterizing the rates of foster care placement changes and positive and negative exits for the KEEP and NSCAW-1 studies. The NSCAW-1 sample (red dashed line) provides follow-up data through 1,095 days (3 years), while the KEEP sample (blue solid line) provides follow-up data through 200 days.
Table 2.
Predictors of rates of foster care exits and placement changes in KEEP and NSCAW-1*
| KEEP Analysis | ||||||
|---|---|---|---|---|---|---|
|
| ||||||
| Positive Exits HR [95% CI] |
Negative Exits HR [95% CI] |
Placement Changes HR [95% CI] |
||||
| Foster home receiving KEEP | 2.27 | [1.41 - 3.65] | 3.25 | [0.71 - 14.94] | 0.83 | [0.50 - 1.40] |
| Interaction of KEEP and number prior placements | 0.80 | [0.63 - 1.02] | ||||
| Child's age | 0.88 | [0.79 - 0.97] | 0.90 | [0.73 - 1.12] | 0.95 | [0.85 - 1.07] |
| Male | 0.70 | [0.45 - 1.10] | 1.19 | [0.47 - 3.06] | 0.73 | [0.43 - 1.22] |
| Placed in kinship foster care | 0.62 | [0.37 - 1.02] | 0.31 | [0.07 - 1.40] | 0.33 | [0.16 - 0.67] |
| Number of prior placements | 1.29 | [1.10 - 1.52] | ||||
| Any prior placement history | 0.81 | [0.44 - 1.48] | 1.65 | [0.66 - 4.14] | ||
|
| ||||||
| Observations | 609 | 609 | 609 | |||
| Events | 80 | 18 | 59 | |||
| LR test | p<0.01 | p=0.025 | p<0.01 | |||
| NSCAW Analysis | ||||||
|
| ||||||
| Positive Exits HR [95% CI] |
Negative Exits HR [95% CI] |
Placement Changes HR [95% CI] |
||||
|
| ||||||
| Child's age | 0.76 | [0.67 – 0.87] | 1.46 | [1.07 - 2.01] | 0.97 | [0.78 - 1.21] |
| Male | 0.80 | [0.38 – 1.68] | 1.45 | [0.72 - 2.92] | 1.42 | [0.84 - 2.40] |
| Race/ethnicity | ||||||
| Black | 0.43 | [0.14 - 1.31] | 1.69 | [0.43 - 6.73] | 1.59 | [0.44 - 5.74] |
| Hispanic | 2.98 | [1.38 - 6.42] | 0.41 | [0.16 - 1.04] | 1.79 | [0.54 - 5.87] |
| Other | 3.00 | [1.09 - 8.26] | 0.39 | [0.03 - 5.00] | 0.92 | [0.14 - 5.94] |
| Placed in kinship foster care | 2.77 | [1.39 - 5.52] | 1.47 | [0.20 - 10.82] | 0.80 | [0.37 - 1.75] |
| Reason for placement | ||||||
| Physical/Sexual Abuse | 2.93 | [0.73 - 11.79] | 0.84 | [0.29 - 2.40] | 0.68 | [0.29 - 1.59] |
| Neglect | 1.35 | [0.36 - 5.07] | 0.28 | [0.08 - 1.00] | 0.51 | [0.19 - 1.34] |
| High CBLC (≥64) | 0.61 | [0.37 - 1.00] | 6.61 | [2.80 - 15.59] | 2.45 | [1.01 - 5.96] |
| Any prior placement history | 0.43 | [0.23 - 0.08] | 0.81 | [0.36 - 1.84] | 1.15 | [0.50 - 2.63] |
| Geographic location | ||||||
| Region 1 | 0.59 | [0.30 - 1.19] | 6.18 | [2.36 - 16.20] | 2.56 | [1.13 - 5.83] |
| Region 2 | 0.54 | [0.12 - 2.48] | 5.52 | [1.55 - 19.69] | 0.20 | [0.06 - 0.64] |
| Region 3 | 0.64 | [0.13 - 3.02] | 0.52 | [0.13 - 2.08] | 1.23 | [0.38 - 4.02] |
| Region 4 | 1.75 | [0.08 - 3.72] | 0.83 | [0.22 - 3.14] | 1.45 | [0.17 - 12.40] |
| Region 5 | 0.38 | [0.01 - 1.11] | 0.03 | [0.00 - 0.38] | 0.47 | [0.10 - 2.35] |
| Region 6 | 0.31 | [0.09 - 1.01] | 1.29 | [0.03 - 4.96] | 0.57 | [0.17 - 1.93] |
| Region 7 | 0.45 | [0.06 - 3.70] | 0.05 | [0.14 - 1.79] | 1.13 | [0.26 - 4.87] |
| Region 8 | 0.23 | [0.07 - 0.74] | 2.91 | [0.76 - 11.15] | 0.43 | [0.10 - 1.84] |
|
| ||||||
| Observations | 321 | 321 | 321 | |||
| Events | 121 | 45 | 88 | |||
| Weighted observations | 71,298 | 71,298 | 71,298 | |||
| LR test | p<0.01 | p<0.01 | p<0.01 | |||
Cox proportional hazard model estimates; HR = Hazard rate
In NSCAW-1, both individual behavioral characteristics and geographical location also predicted exits from and placement changes within foster care. Children with higher CBCL scores were significantly less likely to have positive exits and significantly more likely to have negative exits. There were substantial differences in the rates of placement changes in different geographic regions, indicating that children in some states were less likely to have positive exits, more likely to have negative exits, and more likely to have foster care placement changes than otherwise similar children in other states.
KEEP altered rates of placement change, significantly increasing positive exits (Table 2). It also significantly reduced a combined measure of negative exits and lateral moves (results not shown). When these two outcomes were disaggregated, significance was attenuated but the direction of effect was the same – fewer placement changes in foster homes receiving the KEEP intervention and fewer negative exits for children with histories of more prior placement changes in KEEP foster homes.
Simulating the effects of KEEP on US Child Welfare populations
Applying KEEP's effects to the rates of foster placement change and exit for 5-12 year-olds in foster care represented by NSCAW-1, the microsimulation predicts that, over 3 years, most children will leave the foster homes in which they currently reside (any placement change: 78% [73-84%]). On average, they will have 0.60 [0.30-1.27] placement changes within foster care, and many will have negative exits from foster care (23% [15-32%]) (Figure 3).
Figure 3. Modeled Effects of KEEP on Foster Care Stability and Permanency Outcomes.
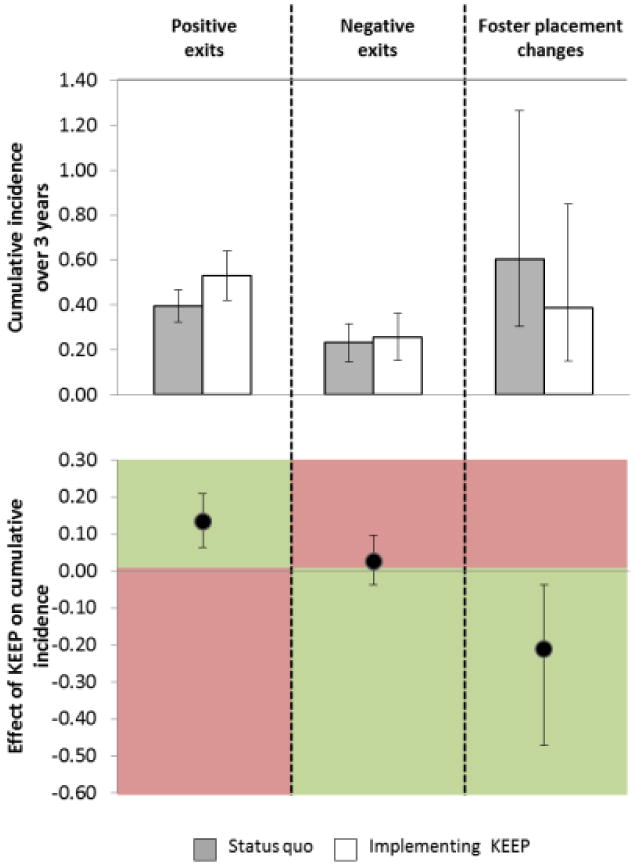
The upper panel shows the absolute proportions of children in the US Child Welfare system experiencing positive or negative exits from foster care over a 3 year period along with the average number of placement changes they experience while in foster care. The gray bars represent outcomes in the current status quo for the Child Welfare system whereas the white bars represent these same outcomes if KEEP were implemented. The lower panel shows changes in outcomes due to KEEP. Because increases in positive exits are considered beneficial while decreases in negative exits and placement changes are considered beneficial, the regions of the graph that are considered beneficial are colored green and those that are harmful are colored red.
The microsimulation also predicts that KEEP could produce substantial beneficial effects, increasing rates of positive exits from foster care and reducing placement changes within foster care without significantly altering rates of negative exits (Figure 3). KEEP increased the proportion of children who had a positive exit from foster care from 40% to 53% (absolute difference: 13% [5-22%]), and decreased the average number of lateral moves from 0.60 to 0.39 (absolute difference: 0.21 [0.04-0.47]).
As shown in Table 3, targeting KEEP to foster homes with higher-risk children (e.g., those age above 9, residing in non-kinship foster homes, and with CBCL scores ≥64) provides differentially higher benefits in terms of increased placement stability compared to lower-risk children. Without KEEP, lower-risk children have 0.30 [0.13-0.53] placement changes on average and higher-risk children have 0.95 [0.28- 2.62], three times as many placement changes on average are prevented by targeting KEEP to a higher-risk child compared to a lower risk child (reductions of 0.29 vs. 0.11).
Table 3.
Differential effects of KEEP across subpopulations
| Low-risk and high-risk children | |||||
|---|---|---|---|---|---|
|
| |||||
| 3-year cumulative incidence [95% CI] | |||||
|
|
|||||
| Low-risk children | High-risk children | ||||
| Status quo | Positive exits (%) | 60% | [50 - 70%] | 18% | [10 - 28%] |
| Negative exits (%) | 4% | [0.01 - 0.11] | 51% | [27 - 70%] | |
| Placement changes (#) | 0.30 | [0.13 - 0.53] | 0.95 | [0.28 - 2.62] | |
|
| |||||
| With KEEP | Change in positive exits (%) | 16% | [9 - 23%] | 9% | [1 - 17%] |
| Change in negative exits (%) | 1% | [-1 - 5%] | 3% | [-7 - 12%] | |
| Change in placement changes (#) | -0.11 | [-0.24 - -0.03] | -0.29 | [-0.79 - -0.00] | |
| State Child Welfare systems | |||||
|
| |||||
| 3-year cumulative incidence [95% CI] | |||||
|
|
|||||
| State A | State B | ||||
|
| |||||
| Status quo | Positive exits (%) | 38% | [16 - 69%] | 48% | [13 - 73%] |
| Negative exits (%) | 38% | [0 - 65%] | 21% | [0 - 48%] | |
| Placement changes (#) | 0.08 | [0.00 - 0.24] | 0.73 | [0.02 - 2.17] | |
|
| |||||
| With KEEP | Change in positive exits (%) | 10% | [1 - 20%] | 12% | [3 - 22%] |
| Change in negative exits (%) | 2% | [-7 - 11%] | 1% | [-6 - 12%] | |
| Change in placement changes (#) | -0.03 | [-0.10 - 0.00] | -0.29 | [-0.95 - -0.00] | |
In assessing its benefits, the decision to implement KEEP will likely vary by state, as the model predicts substantially different outcomes across regions included in NSCAW-1. For example, in microsimulations restricted to children from region 2 (State A) and region 4 (State B), the proportions of children with positive exits and negative exits from foster care and the average number of placement changes within foster care in State A are 1.3, 0.6, and 9.1 times those of State B. KEEP's potential to alter these risks also differs across states, with significantly larger potential to decrease average numbers of placement changes in State B (0.29) compared to State A (0.03).
Sensitivity analyses
Even if the effect of KEEP on positive and negative exits and foster placement changes were as low as 50% or as high as 150% of that observed in the original randomized trial when implemented in other systems serving the U.S. Child Welfare population, its simulated beneficial effects (increases in positive exits and reductions in lateral moves) remain substantial (Figure 4). Notably, while the cumulative risk of negative exits rises somewhat depending on changes in KEEP's effectiveness, negative exits remain infrequent relative to increases in positive exits and decreases in foster placement changes. If KEEP's effects attenuated, tapering from the trial-measured effect to no effect between day 200 and day 1,095 of follow-up, substantial increases in positive exits and reductions in foster placement changes persist (Figure 5), suggesting that KEEP's impacts on these measures occur in large part relatively soon after being introduced into a foster home.
Figure 4. The Relationship of Changes to KEEP's Effect Size and ModeledFoster Care Stability and Permanency Outcome.
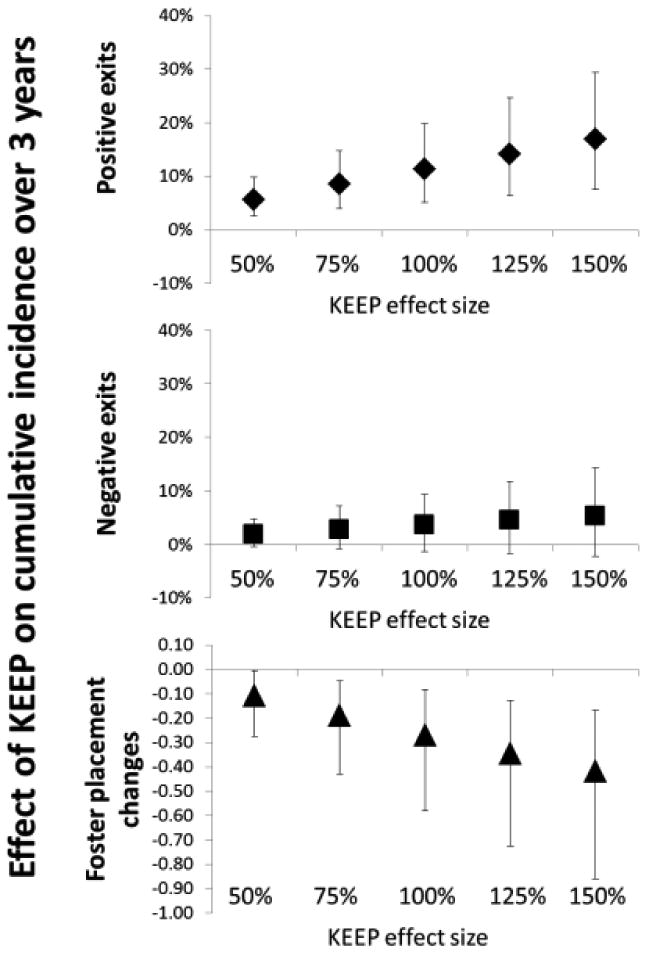
Each panel shows KEEP's impact in terms of changes in the proportion of children in the US Child Welfare system experiencing positive or negative exits from foster care over a 3 year period along with the average number of placement changes they experience while in foster care (cumulative incidences). KEEP's effect size is modified by multiplying KEEP's regression coefficients by 0.5 through 1.5 and repeating the bootstrap microsimulation as described in the Methods section.
Figure 5. Attenuation of KEEP's Effect for Follow-up beyond the Duration of the Original Randomized Trial.
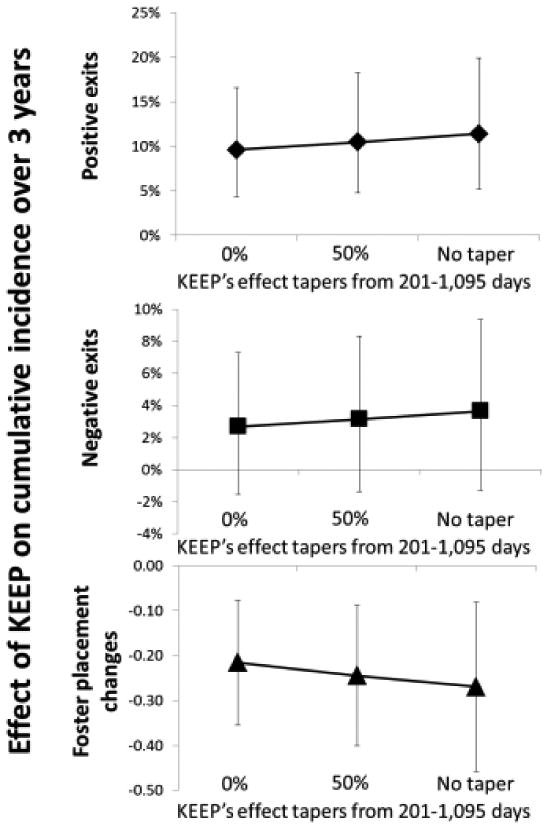
Each panel shows KEEP's impact in terms of changes in the proportion of children in the US Child Welfare system experiencing positive or negative exits from foster care over a 3 year period along with the average number of placement changes they experience while in foster care (cumulative incidences). For follow-up beyond 200 days (i.e., the duration of the original KEEP RCT), KEEP's effect size is reduced by tapering it from its full effect at 201 days to no effect (0%), half the effect (50%), or full effect (no taper, 100%) by the end of the 1,095 days of follow-up and multiplying these follow-up time-specific changes by KEEP's regression coefficients and repeating the bootstrap microsimulation as described in the Methods section.
Discussion
If KEEP were implemented for foster homes currently housing 5-12 year-olds in Child Welfare systems in the US, it could increase the proportion of children who were adopted, reunified, and placed in long-term guardianship while simultaneously enhancing stability through reductions in placement changes. If KEEP were targeted to higher-risk children, it could produce even greater improvements in placement stability. Thus, a promising research-based parenting intervention of reasonably low intensity has the potential to improve outcomes for vulnerable children. These effects are particularly important because of their potential relationship to public expenditures on higher-end services, longer-term mental health outcomes and other risks that children served by Child Welfare currently face.
The model-based decision science approach used here provides insights about potential benefits of implementing evidence-based interventions. It represents an applied example of a framework focused on better supporting the decision making for Child Welfare administrators. Extending the framework could provide significant additional value to policymakers.
Incorporating additional data sources would allow the model to better reflect the experiences of children in systems as large and diverse as Child Welfare systems in the US, enhancing external validity. Two such sources are: 1) NSCAW-2, a second longitudinal cohort of children investigated by child welfare agencies initiated in February, 2008 using a design very similar to NSCAW-1 providing detailed profiles of children as they move through the Child Welfare system; and 2) the Multistate Foster Care Data Archive (MFCDA), a repository of all individual-level, longitudinal administrative data from 23 states (Wulczyn, Chen, & Hislop, 2007). Linking NSCAW-2 and MFCDA with statistical matching techniques would provide an even more powerful approach that leveraged MFCDA's comprehensiveness and scale with NSCAW-2's wide range of clinically-relevant individual measurements (D'Orazio, Di Zio, & Scanu, 2006).
Analyses considering system-wide dissemination must concern themselves with issues of program fidelity as interventions are scaled-up (Chamberlain, Price, Reid, et al., 2008; Welsh, Sullivan, & Olds, 2010). In this study, our approach assumed that estimated effects of KEEP generalized to NSCAW-1. Along with adjustments for sample differences, this assumption is plausible for present purposes. However, as populations become increasingly dissimilar and as program fidelity declines, more sophisticated techniques will be required.
Rigorous cost estimates are needed to assess the value that interventions deliver. Costs should reflect true economic costs (Corso & Lutzker, 2006; Gold, 1996), representing both resources used for delivering interventions and averted downstream expenditures. Recent research has developed the available range of costs estimates for Child Welfare systems in the U.S. (Chamberlain et al., 2011).
While placement changes and more restrictive placements are in and of themselves important policy outcomes in the context of Child Welfare, policymakers are also interested in the potential long-term effects of intervention implementation. Evidence on the causal relationship between placement changes and longer-term outcomes is mixed, but as more, high-quality studies address this important topic, extrapolating model outcomes based on the evidence will be critical. For the sake of illustration, we consider how modeled outcomes might translate into changes in subsequent behavioral problems (Rubin et al., 2008) and associated mental health conditions (Petty et al., 2008); cost savings due to averted mental health conditions (Rubin et al., 2004); and subsequent delinquency and juvenile justice involvement in later teen years (Ryan & Testa, 2005; Thornberry, Smith, Rivera, Huizinga, & Stouthamer-Louber, 1999). Placement instability (>2 placement changes over a year) is associated with higher mental health costs in subsequent years (adjusted Odds Ratio 2.01 [1.50-3.05]), defined as being in the top 10% of claims (average annual claims approximately $12,000) vs. the bottom 90% of claims (average annual claims approximately $250). For foster children with placement instability, the risk of high mental health claims was 17.6% (expected mental health costs $2,320), compared to 9.3% for those with greater stability (expected mental health costs $1,340). As the microsimulation-predicted effect of KEEP on reduced placement instability was 10% of these children, the per-child cost savings could be nearly $100 per year for mental health services alone (0.10*[$2,320-$1,340]). For males, greater placement stability is significantly associated with lower subsequent delinquency rates. In 2003, roughly 2,200,000 juveniles were arrested with approximately 25% of these for violent or substantial property crimes (Snyder & Sickmund, 2006). Juvenile delinquents are also at substantially elevated risks for physical and mental health problems and lower educational attainment and lifetime earnings (Rumberger & Larson, 1998). Based on studies of placement stability and delinquency (Ryan & Testa, 2005) and the effect of KEEP in the microsimulation, KEEP might reduce the risk of delinquency through age 16 from 10.6% to 9.7% (absolute reduction 0.9%; relative reduction 10%). A fruitful area of future research is the consideration of possible cascading, societal benefits that accrue from improved placement stability.
Evaluating program benefits holistically requires combining multiple outcomes, making a cost-benefit approach appealing (Beatty, 2009; Ungar, 2010). Nonetheless, where health outcomes are a major focus in their own right, cost-utility approaches employing Quality Adjusted Life Years are suitable (Gold, 1996). Recent work has focused on estimating utility values to compute QALYs for a wide range of childhood conditions (Carroll & Downs, 2009; Petrou & Kupek, 2009; Prosser, 2009; Prosser & Corso, 2007; Ungar, 2010).
As evidence-based parenting interventions are scaled up, macro-level system effects could alter their effectiveness (Wulczyn, Zimmerman, & Skyles, 2002). For example, because organizations that contract to provide beds in group care must maintain a minimum occupancy to remain profitable, reductions in group care placements due to KEEP could reduce the availability of beds for the albeit smaller number of children still requiring them. An example of this is the importance of regions in the analyses. Clearly, systems effects, whether they are availability of placements homes or availability of residential beds, affect placement changes. The integration of child-level modeling of interventions in the context of system models that incorporate such macro-level feedbacks is worth considering.
As with all data and studies, the present work has limitations. NSCAW-1, although the most comprehensive representative data on children who have been investigated by CWAs, cannot, with a few exceptions, be used for detailed state-specific analyses. Linking NSCAW's detailed measures with state-specific administrative data is necessary for these analyses to be useful for state planning purposes.
Although KEEP was evaluated in a large clinical trial and is based on previous studies and a well-validated interventional framework, the clinical trial data we use originate only from San Diego county. Although unlikely, it is conceivable that features of this county contributed to KEEP's positive effects. It is also possible that other features of the foster families trained in locations outside of San Diego or the training of paraprofessionals who deliver the KEEP intervention with less fidelity than those trained as part of the San Diego trial (Chamberlain, Price, Reid, et al., 2008) could alter outcomes. Sensitivity analyses suggest that changes in effectiveness and attenuation would have to be substantial to result in large differences in cumulative reductions in positive exits and foster placement changes (Figures 4 and 5).
Likewise, there are limitations to the use of decision-analytic microsimulation modeling as a tool for supporting policy decisions. Models themselves are built upon data and assumptions which, if invalid, ca alter outputs and the conclusions drawn from them. Yet, it is important to note that assumptions guide decisions made in the absence of formal models. Decision makers′ assumptions form implicit models, an decisions are made without formal statement and evaluation of assumptions. Constructing an explicit model is itself a form of evidence synthesis that documents the data used, the relationships assumed, and the process of integration and extrapolation to comment on long-term outcomes that may not be possible to study otherwise. By considering outcomes, costs, and their uncertainties under alternative interventions, decision analyses help to identify interventions that achieve the maximum expected benefits within available budgets and subject to other constraints (e.g., trained personnel). To the extent that outcomes not included in the models are important to decision makers, the results of the analysis are incomplete. Therefore, modeling is best used in an iterative dialogue with decision makers in which results are presented, questions posed, and the model refined. A major strength of the approach is the ability to rapidly consider a broad range of options under many scenarios.
When considering how Child Welfare interventions may alter the experiences of vulnerable children whose experiences have long-term implications for their mental and physical well-being, decision-analytic modeling represents an important approach. It allows Child Welfare agencies to make service choices based on data rather than unspoken and unevaluated assumptions. This approach to assessing the potential impact of one or more evidence-based interventions may prove to be an important implementation tool. Accordingly, decision-analytic models could help to facilitate the use of programs that have shown to be effective in controlled studies but have yet to be widely adopted in usual practice.
Supplementary Material
The results of the Cox proportional hazard regression analysis of NSCAW-1 provide estimates relevant to the hazard of a given event type (e.g., negative exits from foster care at time t for an individual i who has a set of j characteristics x). The proportional hazard assumption states how individual baseline characteristics modify the hazard via βs as follows:
Since there are positive exits, negative exits, and foster care placement changes, there are three hazards:
For each individual child and each day in the microsimulation model, we compute these hazards based on that child's characteristics (x), the time in days since baseline (t_base), and the time over which the event could happen (i.e., 1 day or t=1). We compute the overall risk of having any type of placement change:
We then draw a random uniform number from a pseudorandom number generator (Mersenne Twister; Matsumoto, 1998) and compare it to the risk of any event. If it is lower, the event occurred on that day. To compute the type of event that occurred, we use rate proportionality. For example, when an event occurs, the likelihood that it is a positive exit is expressed in the following relationship:
Again, we draw a random uniform number from a pseudorandom number generator and compare it to the risk of any event. If it is lower, the event that occurred is of that type. While the microsimulation model censors individuals after they have had a positive or negative exit, it allows multiple foster care placement changes. To do so, when the event that occurred is a placement change, the “baseline” characteristics of the individual are updated (e.g., age at baseline is now the age at which the new placement change began and the number of prior placements is increased). With these updated characteristics (x), the hazards, risks, and event types are again computed and simulated as described. Finally, the simulation either censors individuals at positive or negative exit or after 3 years of model time (i.e., 1,095 days).
Acknowledgments
Patricia Chamberlain at the Oregon Social Learning Center shared the KEEP study data (R01-MH60195; R01-DA15208; P20-DA17592). Participants in the 2010 Implementation Research Methods Group summer meeting, C. Hendricks Brown at the University of Miami, and participants in the Prevention Science Methodology Group 2010 seminar series provided comments. The NIMH provided funding (P30-MH074678).
Footnotes
Segments of the work described here were presented at the 4th Annual NIH Conference on the Science of Dissemination and Implementation held March 21-22, 2011 in Bethesda, MD
References
- Aarons GA, Hurlburt M, Horwitz SM. Advancing a conceptual model of evidence-based practice implementation in public service sectors. Administration and Policy in Mental Health and Mental Health Services Research. 2011;38(1):4–23. doi: 10.1007/s10488-010-0327-7. [DOI] [PMC free article] [PubMed] [Google Scholar]
- Beatty AS. Strengthening Benefit-Cost Analysis for Early Childhood Interventions: Workshop Summary. Washington, D.C: National Academies Press; 2009. [Google Scholar]
- California Evidence-Based Clearinghouse for Child Welfare. Retrieved June 20, 2011, from www.cebc4.org.
- Carroll AE, Downs SM. Improving decision analyses: parent preferences (utility values) for pediatric health outcomes. The Journal of Pediatrics. 2009;155(1):21–25. doi: 10.1016/j.jpeds.2009.01.040. [DOI] [PubMed] [Google Scholar]
- Chamberlain P, Leve LD, DeGarmo DS. Multidimensional treatment foster care for girls in the juvenile justice system: 2-year follow-up of a randomized clinical trial. Journal of Consulting and Clinical Psychology. 2007;75(1):187–193. doi: 10.1037/0022-006X.75.1.187. [DOI] [PMC free article] [PubMed] [Google Scholar]
- Chamberlain P, Price J, Leve LD, Laurent H, Landsverk JA, Reid JB. Prevention of behavior problems for children in foster care: outcomes and mediation effects. Prevention Science. 2008;9(1):17–27. doi: 10.1007/s11121-007-0080-7. [DOI] [PMC free article] [PubMed] [Google Scholar]
- Chamberlain P, Price J, Reid J, Landsverk J. Cascading implementation of a foster and kinship parent intervention. Child Welfare. 2008;87(5):27–48. [PMC free article] [PubMed] [Google Scholar]
- Chamberlain P, Reid JB. Using a specialized foster care community treatment model for children and adolescents leaving the state mental hospital. Journal of Community Psychology. 1991;19(3):266–276. [Google Scholar]
- Chamberlain P, Reid JB. Differences in risk factors and adjustment for male and female delinquents in treatment foster care. Journal of Child and Family Studies. 1994;3(1):23–29. [Google Scholar]
- Chamberlain P, Snowden LR, Padgett C, Saldana L, Roles J, Holmes L, et al. A strategy for assessing costs of implementing new practices in the child welfare system: adapting the english cost calculator in the United States. Administration and Policy in Mental Health and Mental Health Services Research. 2011;38(1):24–31. doi: 10.1007/s10488-010-0318-8. [DOI] [PMC free article] [PubMed] [Google Scholar]
- Child Maltreatment 2007. 2007 Retrieved January 25, 2011, from http://www.acf.hhs.gov/programs/cb/pubs/cm07/summary.htm.
- Claxton K. The irrelevance of inference: a decision-making approach to the stochastic evaluation of health care technologies. Journal of health economics. 1999;18(3):341–364. doi: 10.1016/s0167-6296(98)00039-3. [DOI] [PubMed] [Google Scholar]
- Corso PS, Lutzker JR. The need for economic analysis in research on child maltreatment. Child Abuse and Neglect. 2006;30(7):727–738. doi: 10.1016/j.chiabu.2005.12.006. [DOI] [PubMed] [Google Scholar]
- Cost-effectiveness of intensive glycemic control, intensified hypertension control, and serum cholesterol level reduction for type 2 diabetes. JAMA. 2002;287(19):2542–2551. doi: 10.1001/jama.287.19.2542. [DOI] [PubMed] [Google Scholar]
- D'Orazio M, Di Zio M, Scanu M. Statistical Matching: Theory and Practice. Chichester, England; Hoboken, NJ; Wiley: 2006. [Google Scholar]
- Dubowitz H. Costs and effectiveness of interventions in child maltreatment. Child Abuse and Neglect. 1990;14(2):177–186. doi: 10.1016/0145-2134(90)90029-s. [DOI] [PubMed] [Google Scholar]
- Eddy JM, Chamberlain P. Family managment and deviant peer association as mediators of the impact of treatment condition on youth antisocial behavior. Journal of Consulting and Clinical Psychology. 2000;68(5):857–863. doi: 10.1037/0022-006X.68.5.857. [DOI] [PubMed] [Google Scholar]
- Edwards A, Lutzker JR. Iterations of the SafeCare model: An evidence-based child maltreatment prevention program. Behavior Modification. 2008;32(5):736–756. doi: 10.1177/0145445508317137. [DOI] [PubMed] [Google Scholar]
- Gaspoz JM, Coxson PG, Goldman PA, Williams LW, Kuntz KM, Hunink MG, et al. Cost effectiveness of aspirin, clopidogrel, or both for secondary prevention of coronary heart disease. New England Journal of Medicine. 2002;346(23):1800–1806. doi: 10.1056/NEJM200206063462309. [DOI] [PubMed] [Google Scholar]
- Gershater-Molko RM, Lutzker JR, Wesch D. Project SafeCare: Improving health, safety, and parenting skills in families reported for, and at-risk for child maltreatment. Journal of Family Violence. 2003;18(6):377–386. [Google Scholar]
- Gold MR. Cost-Effectiveness in Health and Medicine. New York: Oxford University Press; 1996. [Google Scholar]
- Goldhaber-Fiebert JD, Snowden LR, Wulczyn FH, Landsverk J, Horwitz SM. Economic Evaluation Research in the Context of Child Welfare Policy: A Structured Review and Recommendations. Child Abuse and Neglect. 2011 doi: 10.1016/j.chiabu.2011.05.012. [DOI] [PMC free article] [PubMed] [Google Scholar]
- Goldhaber-Fiebert JD, Stout NK, Salomon JA, Kuntz KM, Goldie SJ. Cost-effectiveness of cervical cancer screening with human papillomavirus DNA testing and HPV-16,18 vaccination. Journal of the National Cancer Institute. 2008;100(5):308–320. doi: 10.1093/jnci/djn019. [DOI] [PMC free article] [PubMed] [Google Scholar]
- Horwitz SM, Chamberlain P, Landsverk J, Mullican C. Improving the mental health of children in child welfare through the implementation of evidence-based parenting interventions. Administration and Policy in Mental Health and Mental Health Services Research. 2010;37(1-2):27–39. doi: 10.1007/s10488-010-0274-3. [DOI] [PubMed] [Google Scholar]
- Jackson CH, Bojke L, Thompson SG, Claxton K, Sharples LD. A Framework for Addressing Structural Uncertainty in Decision Models. Medical decision making: an international journal of the Society for Medical Decision Making. 2011 doi: 10.1177/0272989X11406986. [DOI] [PubMed] [Google Scholar]
- Kuntz KM, Weinstein MC. Modelling in Economic Evaluation. In: Drummond M, McGuire A, editors. Economic Evaluation in Health Care: Merging Theory with Practice. Oxford: Oxford University Press; 2001. pp. 141–171. [Google Scholar]
- Law AM, Kelton WD. Simulation Modeling and Analysis. 3rd. Boston: McGraw-Hill; 2000. [Google Scholar]
- Leve LD, Chamberlain P. Female juvenile offenders: Defining an early-onset pathway for delinquency. Journal of Child and Family Studies. 2004;13(4):439–452. [Google Scholar]
- Levy PS, Lemeshow S. Sampling of Populations: Methods and Applications. 4th. Hoboken, N.J: Wiley; 2008. [Google Scholar]
- Lilford RJ, Pauker SG, Braunholtz DA, Chard J. Decision analysis and the implementation of research findings. BMJ. 1998;317(7155):405–409. doi: 10.1136/bmj.317.7155.405. Review. [DOI] [PMC free article] [PubMed] [Google Scholar]
- Lutzker JR, Frame RE, Rice JM. Project 12-Ways: An ecobehavioral approach to the treatment and prevention of child abuse and neglect. Education and Treatment of Children. 1982;5(2):141–155. [Google Scholar]
- Matsumoto M, Nishimura T. Mersenne twister: a 623-dimensionally equidistributed uniform pseudo-random number generator. ACM Transactions on Modeling and Computer Simulation. 1998;8(1):3–30. [Google Scholar]
- Parmigiani G. Measuring uncertainty in complex decision analysis models. Statistical methods in medical research. 2002;11(6):513–537. doi: 10.1191/0962280202sm307ra. [DOI] [PubMed] [Google Scholar]
- Petrou S, Kupek E. Estimating preference-based health utilities index mark 3 utility scores for childhood conditions in England and Scotland. Medical Decision Making. 2009;29(3):291–303. doi: 10.1177/0272989X08327398. [DOI] [PubMed] [Google Scholar]
- Petty CR, Rosenbaum JF, Hirshfeld-Becker DR, Henin A, Hubley S, LaCasse S, et al. The child behavior checklist broad-band scales predict subsequent psychopathology: A 5-year follow-up. Journal of Anxiety Disorders. 2008;22(3):532–539. doi: 10.1016/j.janxdis.2007.04.003. [DOI] [PMC free article] [PubMed] [Google Scholar]
- Price JM, Chamberlain P, Landsverk J, Reid JB, Leve LD, Laurent H. Effects of a foster parent training intervention on placement changes of children in foster care. Child Maltreatment. 2008;13(1):64–75. doi: 10.1177/1077559507310612. [DOI] [PMC free article] [PubMed] [Google Scholar]
- Prosser LA. Current challenges and future research in measuring preferences for pediatric health outcomes. Journal of Pediatrics. 2009;155(1):7–9. doi: 10.1016/j.jpeds.2009.03.007. [DOI] [PubMed] [Google Scholar]
- Prosser LA, Corso PS. Measuring health-related quality of life for child maltreatment: a systematic literature review. Health and Quality of Life Outcomes. 2007;5(42) doi: 10.1186/1477-7525-5-42. [DOI] [PMC free article] [PubMed] [Google Scholar]
- Rubin DM, Alessandrini EA, Feudtner C, Mandell DS, Localio AR, Hadley T. Placement stability and mental health costs for children in foster care. Pediatrics. 2004;113(5):1336–1341. doi: 10.1542/peds.113.5.1336. [DOI] [PubMed] [Google Scholar]
- Rubin DM, Downes KJ, O'Reilly AL, Mekonnen R, Luan X, Localio R. Impact of kinship care on behavioral well-being for children in out-of-home care. Archives of Pediatrics and Adolescent Medicine. 2008;162(6):550–556. doi: 10.1001/archpedi.162.6.550. [DOI] [PMC free article] [PubMed] [Google Scholar]
- Ruiz MS. No Time to Lose: Getting More from HIV Prevention. Washington, D.C.: Institute of Medicine; National Academy Press; 2001. [PubMed] [Google Scholar]
- Rumberger R, Larson K. Student Mobility and the Increased Risk of High School Dropout. American Journal of Education. 1998;107(1):1–35. [Google Scholar]
- Ryan JP, Testa MF. Child maltreatment and juvenile delinquency: Investigating the role of placement and placement instability. Children and Youth Services Review. 2005;27(3):227–249. [Google Scholar]
- Snyder H, Sickmund M. Juvenile Offenders and Victims: 2006 National Report. Office of Juvenile Justice and Delinquency Prevention. 810 Seventh Street NW; Washington, DC 20531: 2006. Tel: 202-307-5911; Web site: http://ojjdp.ncjrs.org/publications/index.html. [Google Scholar]
- Thornberry TP, Smith CA, Rivera C, Huizinga D, Stouthamer-Louber M. Family Disruption and Delinquency. Washington, D.C.: U.S Department of Justice, Office of Justice Programs, Office of Juvenile Justice and Delinquency Prevention; 1999. [Google Scholar]
- Ungar WJ. Economic Evaluation in Child Health. Ox0ford; New York: Oxford University Press; 2010. [Google Scholar]
- Webb MB. Child Welfare and Child Well-Being: New Perspectives from the National Survey of Child and Adolescent Well-Being. Oxford: Oxford University Press; 2010. [Google Scholar]
- Welsh BC, Sullivan CJ, Olds DL. When early crime prevention goes to scale: a new look at the evidence. Prevention Science. 2010;11(2):115–125. doi: 10.1007/s11121-009-0159-4. [DOI] [PubMed] [Google Scholar]
- Wulczyn FH, Chen L, Hislop KB. Foster Care Dynamics 2000–2005: A Report from the Multistate Foster Care Data Archive. Chicago: Chapin Hall Center for Children at the University of Chicago; 2007. [Google Scholar]
- Wulczyn FH, Zimmerman E, Skyles A. Relative Caregivers, Kinship Foster Care, and Subsidized Guardianship: Policy and Programmatic Options. Chicago: Chapin Hall Center for Children at the University of Chicago; 2002. [Google Scholar]
Associated Data
This section collects any data citations, data availability statements, or supplementary materials included in this article.
Supplementary Materials
The results of the Cox proportional hazard regression analysis of NSCAW-1 provide estimates relevant to the hazard of a given event type (e.g., negative exits from foster care at time t for an individual i who has a set of j characteristics x). The proportional hazard assumption states how individual baseline characteristics modify the hazard via βs as follows:
Since there are positive exits, negative exits, and foster care placement changes, there are three hazards:
For each individual child and each day in the microsimulation model, we compute these hazards based on that child's characteristics (x), the time in days since baseline (t_base), and the time over which the event could happen (i.e., 1 day or t=1). We compute the overall risk of having any type of placement change:
We then draw a random uniform number from a pseudorandom number generator (Mersenne Twister; Matsumoto, 1998) and compare it to the risk of any event. If it is lower, the event occurred on that day. To compute the type of event that occurred, we use rate proportionality. For example, when an event occurs, the likelihood that it is a positive exit is expressed in the following relationship:
Again, we draw a random uniform number from a pseudorandom number generator and compare it to the risk of any event. If it is lower, the event that occurred is of that type. While the microsimulation model censors individuals after they have had a positive or negative exit, it allows multiple foster care placement changes. To do so, when the event that occurred is a placement change, the “baseline” characteristics of the individual are updated (e.g., age at baseline is now the age at which the new placement change began and the number of prior placements is increased). With these updated characteristics (x), the hazards, risks, and event types are again computed and simulated as described. Finally, the simulation either censors individuals at positive or negative exit or after 3 years of model time (i.e., 1,095 days).