

Abstract
Background
Brain areas interact mutually to perform particular complex brain functions such as memory or language. Furthermore, under resting-state conditions several spatial patterns have been identified that resemble functional systems involved in cognitive functions. Among these, the default-mode network (DMN), which is consistently deactivated during task periods and is related to a variety of cognitive functions, has attracted most attention. In addition, in resting-state conditions some brain areas engaged in focused attention (such as the anticorrelated network, AN) show a strong negative correlation with DMN; as task demand increases, AN activity rises, and DMN activity falls.
Objective
We combined transcranial direct current stimulation (tDCS) with functional magnetic resonance imaging (fMRI) to investigate these brain network dynamics.
Methods
Ten healthy young volunteers underwent four blocks of resting-state fMRI (10-minutes), each of them immediately after 20 minutes of sham or active tDCS (2 mA), on two different days. On the first day the anodal electrode was placed over the left dorsolateral prefrontal cortex (DLPFC) (part of the AN) with the cathode over the contralateral supraorbital area, and on the second day, the electrode arrangement was reversed (anode right-DLPFC, cathode left-supraorbital).
Results
After active stimulation, functional network connectivity revealed increased synchrony within the AN components and reduced synchrony in the DMN components.
Conclusions
Our study reveals a reconfiguration of intrinsic brain activity networks after active tDCS. These effects may help to explain earlier reports of improvements in cognitive functions after anodal-tDCS, where increasing cortical excitability may have facilitated reconfiguration of functional brain networks to address upcoming cognitive demands.
Keywords: transcranial direct current stimulation, resting state fMRI, functional connectivity networks, default mode network
Complex brain functions, such as coordinated movement, memory, and language production, depend critically on dynamic interactions between brain areas. This phenomenon is captured by the concept functional connectivity networks—distributed brain regions transiently interacting to perform a particular neural function. Abnormalities in the interactions of network components play a critical role in common and devastating neurologic and psychiatric disorders ranging from depression to epilepsy,1,2 and damage to specific functional connectivity networks can lead to a variety of neurologic syndromes.3 Furthermore, both the deficits and functional recovery after damage from strokes or traumatic brain injury may be a function of the architecture and adaptability of these networks.4–6 Therefore, methods to further the study of brain network dynamics in health and disease are critically needed.
Under resting brain conditions, a characteristic low-frequency blood oxygen level-dependent (BOLD) fluctuation has been described (≈ 0.01–0.1 Hz),7,8 which depicts several spatial patterns (networks) that resemble functional systems involved in specific cognitive functions.9,10 Among these spatial patterns, the default mode network (DMN) has attracted the most interest.11–14 The DMN has the particularity of being steadily engaged during control conditions or rest periods in active task states, and it has been implicated in self-referential thinking, autobiographical memory, envisioning the future, theory of mind, and moral decision making.15 Clinically, the DMN appears to be compromised in Alzheimer’s disease,16–19 schizophrenia,19 and depression20 (for a review21).
Certain brain areas revealing strong negative activity correlation with the DMN have also been identified and globally termed the ‘anticorrelated network’ (AN).22,23 This set of areas has been associated with cognitive processing in which focused attention on the external environment is required.15,22 The dynamics of the interactions between large-scale brain networks, such as the DMN and the AN, are now beginning to be investigated. For example, a negative correlation has been demonstrated between DMN and AN systems. As task demand increases, AN activity rises and DMN activity falls; during low-demanding tasks this relation is reversed.24–27 It has been suggested that the DMN and AN are two brain systems that represent two distinct modes of information processing and which compete with each other.15,22
Transcranial direct current stimulation (tDCS) delivers continuous weak electrical current through electrodes positioned over the subject’s scalp surface. Depending on the electrode’s polarity, cortical excitability can be increased (anodal-tDCS) or decreased (cathodal-tDC).28 The effects of tDCS have been reported to last for about 1 hour after several minutes of continuous stimulation.28 Various studies have shown that anodal tDCS, particularly over the dorsolateral prefrontal cortex (DLPFC), can transiently improve cognitive functions such as working29–31 and declarative32 memory, planning,33 language learning,34,35 and attention.36 Each of these cognitive functions involves a particular set of regions that form a network, which is presumably modulated by tDCS, resulting in cognitive changes. However, evidence of the distributed network modulatory effects of tDCS is sparse and largely limited to the motor system and to investigations during engagement of subjects in specific behavioral tasks.37 Recently, using graph theory analysis, Polania et al.,38 showed how connectivity between distant brain areas can change after anodal stimulation over the primary motor cortex. In this study, we applied these combined brain stimulation and functional magnetic resonance imaging (fMRI) approaches to the investigation of resting-state activity while stimulating high-order association cortices that are directly related to cognitive functions.
The main purpose of the current study was to investigate dynamic interactions within and across large-scale networks (DMN and AN) combining fMRI with noninvasive neuro-modulation by tDCS. Based on previous studies in the functional neuroimaging literature, we hypothesized that the application of tDCS over the DLPFC, an important hub of the AN, which is negatively correlated with the DMN, would result in a redistribution of activity across resting-state networks (RSNs) and, specifically, that after anodal tDCS to the DLPFC, AN activity would predominate over DMN activity.
Methods
Subjects
After giving written informed consent, 10 healthy right-handed subjects (mean age 26.7 ± 3.7 years; six female) were enrolled in the study. The study had been approved by the Bioethics Committee of the Hospital Clínic, Barcelona, Spain.
Experimental design
Each subject completed two separate experiments on 2 different days with two sessions of tDCS and fMRI each. For each experimental day subjects initially underwent a course of sham tDCS (to the left DLPFC the first day) for 20 minutes; immediately afterward, they underwent resting-state fMRI (rs-fMRI) for 10 minutes. Five minutes later, a 20-minute course of active tDCS was applied, followed by a second 10-minute rs-fMRI. Approximately 1 month later (mean 25 days, SD ± 3), the same experimental procedure was repeated but tDCS was now applied to the right rather than the left DLPFC (Figure 1A). All subjects were blinded as to the active or sham nature of tDCS.
Figure 1.
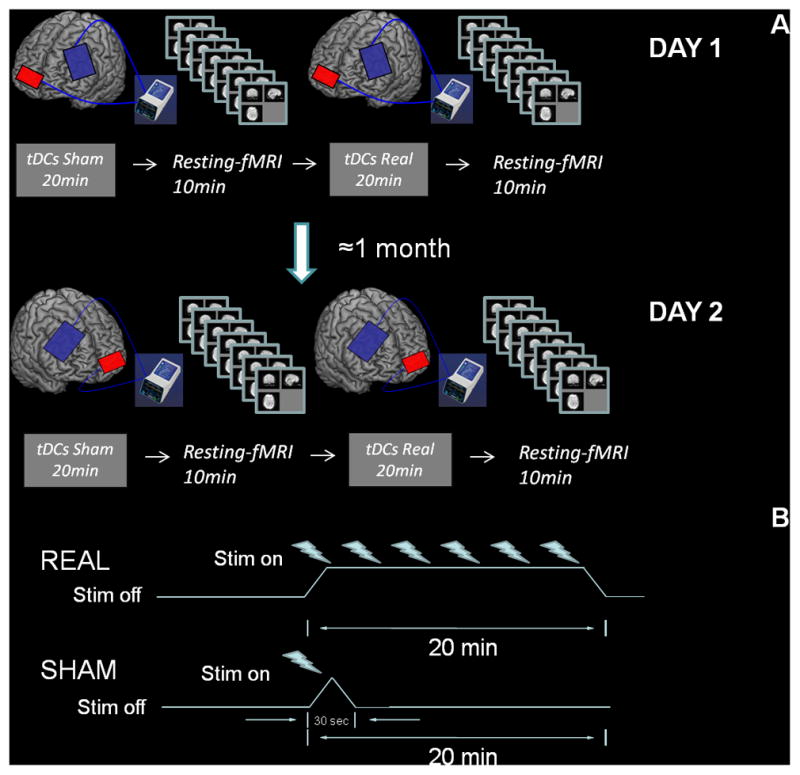
A, Experimental protocol. Participants underwent 20 minutes of sham tDCS and subsequently were on rs-fMRI for 10 minutes. After a pause of 5 ± 2 minutes, subjects were stimulated with active tDCS for 20 minutes (2 mA) and scanned again for 10 minutes. Approximately 1 month later the same participants repeated the same experiment but changing the site of stimulation from left to right DLPFC (see Methods section). B, For active tDCS 20 minutes of 2 mA was continuously applied, whereas for sham stimulation the current stimulator was turned on only during the first 30 seconds, to mimic somatic sensations without actually affecting the underlying cerebral cortex. (Color version of figure is available online.)
Transcranial direct current stimulation
Direct electrical current was applied to the subject’s scalp via saline-soaked sponge electrodes (5 × 7cm) connected to a battery-driven constant current stimulator, Phoresor PM850 (IOMED, Salt Lake City, UT). Electrodes were positioned in accordance with the 10–20 international system for electroencephalogram electrode placement. To target the left DLPFC, the anode was positioned over F3 and the cathode over the right supraorbital area. To target the right DLPFC, the anode was positioned over F4 and the cathode over the left supraorbital area. Active tDCS consisted of a constant current of 2 mA applied for 20 minutes. For sham tDCS, electrodes were positioned in the same arrangement, but the current was delivered only for 30 seconds and then ramped off (Figure 1B). Subjects reported initial itching, as in active tDCS, and were unable to distinguish between active and sham stimulation. A similar method of sham tDCS has been used in other studies.29
Visual analog scale
To control for possible mood effects of tDCS, after each period of tDCS stimulation, a series of visual analog scales (VAS) were used to assess the following states: nervousness, contentment, sadness, hope, and discomfort. Each VAS consisted of a 10-cm solid horizontal line that subjects were required to intersect with a vertical mark reflecting their subjective perception of each state, with the right end of each line representing the maximum and the left end the minimum. To evaluate any significant changes in these subjective ratings as a function of stimulation, a two-factor within-subjects analysis of variance (ANOVA) (factor 1: left hemisphere stimulation/right hemisphere stimulation, factor 2: evaluation following sham/active tDCS) was performed for each dimension. The significance level was set at P ≤ 0.05.
Image acquisition and preprocessing
All subjects underwent structural and fMRI examinations on a 3T MRI scanner (Magnetom Trio, Siemens Medical Systems, Erlangen, Germany) at the Center for Image Diagnosis of the Hospital Clínic (CDIC). The MRI protocol included an fMRI data set of 300 volumes of 40 axial slices for each fMRI session (using a gradient-echo echo-planar imaging EPI sequence) and a high-resolution three-dimensional structural dataset (T1-weighted Magnetization Prepared Rapid Gradient Echo–MP-RAGE image) composed by 240 slices each. The acquisition parameters for the fMRI were as follows: repetition time (TR) = 2000 milliseconds; echo time (TE) = 16 milliseconds; percentage phase field of view = 100; matrix size = 128 × 128; slice thickness = 3 mm; interslice gap = 0.75 mm; flip angle = 90°. The parameters for structural images were as follows: TR = 2300 milliseconds; TE = 2.98 milliseconds; inversion time (TI) = 900; matrix size = 256 × 256; flip angle = 90°; slice thickness = 1 mm. The first eight fMRI volumes were discarded to allow the MRI signal to reach steady state, and to accustom subjects to the scanner noise. Data preprocessing, performed using the statistical parametric mapping analysis software (SPM5, Wellcome Department of Cognitive Neurology, London, UK; http://www.fil.ion.ucl.ac.uk/spm) package, included slice timing, head motion correction, and spatial normalization to the Montreal Neurological Institute (MNI) template (resampling voxel size = 3 mm × 3 mm × 3 mm). Data were temporally band-pass filtered (0.01–0.08 Hz) to reduce physiologic noise39 and the linear trend was removed using Resting-State fMRI Data Analysis Toolkit v1.3 (REST, by Song Xiao-Wei et al. http://www.restfmri.net). Finally, the preprocessed fMRI data were spatially smoothed (FWHM = 6 mm).
ICA analysis
For rs-fMRI data analysis we used ICA.40 Group spatial ICA was run using the GIFT software (http://icatb.sourceforge.net/) and a natural gradient (infomax) algorithm.41 After subject-wise data concatenations, ICA was performed for each study group in three stages: (1) using a principal component analysis (PCA), we performed a data reduction (two-step) of each subject’s fMRI data to the number of components previously estimated by the minimum description length (MDL) criterion42; (2) application of the ICA algorithm; and (3) back reconstruction for each individual subject’s data generating time courses and spatial maps.40 The number of components obtained was 34, 37, 35, and 37 corresponding to the first experimental day (sham and active tDCS) and second experimental day (sham and active tDCS), respectively. The number of components was not constrained a priori, otherwise some components would have been obtained merged. The degree of correlation of a given voxel’s fMRI signal with the time course of the component was represented by the z-score within the spatial map.43 All the results presented here are in z-scores with a threshold at z = 2. To ensure the reliability of every spatial pattern represented by each independent component (IC) estimated by ICA, we used the ICASSO spell method44 implemented on GIFT software. ICASSO is based on running an ICA algorithm several times (in this study FastICA),45 resulting in a high number of the same estimated ICs allowing for consistent evaluation. Reliable ICs match to clusters that are small and clearly separated from the rest of the ICs (Figure S1). All the ICs with its maximal activation was not centered in gray matter were discarded.
Functional network connectivity and spatial pattern comparisons
As the target of stimulation was the DLPFC, a core area of the AN, we hypothesized that activity within this network would show the greatest direct effects. Further, because the DMN shows the strongest intrinsically negative correlations with this brain system, we expected this network to reveal the largest indirect effects of tDCS. Therefore, the temporal analyses between components were performed on the DMN and the AN taking visual and motor systems (Figure 2C and G) as control areas. For this purpose, we performed one group spatial ICA separately for each experimental day including the fMRI sessions after sham and active tDCS for each brain target (Figure S2). Then, the components that resembled DMN, AN, visual, and motor systems were extracted from each ICA and analyzed assessing the temporal dependency among different ICs defined here as functional network connectivity (FNC).46,47 The DMN was selected using spatial pattern correlation with a DMN-template available in the GIFT software for all the ICA sessions. The selection of AN, visual and motor systems was performed in two steps: (1) selection of the systems according to anatomic areas an visual-based resemblance according to previous studies10 for each ICA; (2) spatial cross-correlations between the selected components were performed ensuring that the maps were the same across all the sessions. The FNC procedure was used because spatial ICA generates independent spatial patterns that are maximally independent, but the time courses associated with them are not independent and may show significant temporal dependence.48,49 Thus, the higher the dependence of time courses between two components, the higher the probability that they will merge to only one component.46,50 Fixing the spatial patterns of day 1 (sham and active tDCS to the left DLPFC) and day 2 (sham and active tDCS to the right DLPFC), we were able to investigate changes in the temporal relation among brain networks induced by tDCS calculating temporal correlations between components within each group of stimulation. The FNC was calculated using a Pearson correlation and was then transformed to z-scores (using Fisher z-transform) for later statistical group comparison. Therefore, as we were looking at the same network (spatial pattern) for each of the experimental days (as they were derived from a common group spatial ICA) we were able to compare cross-correlations of the ICA time course in average of each session between two particular networks. Correlation values were calculated for all subjects and were later used to test the correlation changes for sham versus active tDCS using a paired t test for each experimental day. A very conservative P value of 0.01 corrected for multiple comparisons using the false discovery rate51 was taken to indicate significance. The values were calculated computing a constrained zero-lagged correlation.46 Therefore, correlation was performed between all pair-wise combinations of 4 components taken two at a time resulting in 4!/(2!(4−2)!) = 6 possible combinations.
Figure 2.

Common ICs (A–L) of all rs-fMRI sessions. (Color version of figure is available online.)
To evaluate the changes in the spatial patterns of the networks after stimulation, we performed one group spatial ICA for each fMRI session, resulting in four group spatial ICAs (Figure S2). We then compared the neural networks extracted after sham stimulation with those after active tDCS, leading to two comparisons: one for the left and one for the right DLPFC target. In addition, the components extracted after the two sham sessions (1 month apart) were also contrasted to probe comparable baseline (sham) sessions. All the comparisons were performed using spatial sorting implemented in the GIFT software, which permits spatial pattern correlations (only the highest correlation value was considered; Figure S3 to follow the procedure). To ensure the robustness and reliability of the tDCS effect, we only considered those results that were similar for tDCS over both left and right DLPFC.
Results
Mood effects of tDCS
The VASs revealed no significant main effects or interactions of type of tDCS (sham or active tDCS) or day of testing (day 1/day 2, i.e., left or right DLPFC) on any of the mood dimensions tested except for “discomfort,” where we found a main effect of stimulation (Table 1). Subsequent analyses included correlations between changes in this variable and modifications in the expression of the identified networks, but no significant associations were observed.
Table 1.
Ratings on VAS
| TDCS to left DLPFC | TDCS to right DLPFC | F-ANOVA (sig) | |||
|---|---|---|---|---|---|
| Sham | Anodal | Sham | Anodal | ||
| Nervousness | 1.27 (1.42) | 1.02 (1.05) | 1.49 (1.64) | 1.37 (1.58) | 0.29 (0.6)a 0.26 (0.62)b 0.10 (0.75)c |
| Contentment | 6.72 (1.01) | 6.75 (1.45) | 6.07 (1.26) | 5.89 (1.40) | 3.13 (0.11)a 0.06 (0.80)b 0.3 (0.59)c |
| Sadness | 1.14 (1.85) | 1.04 (1.74) | 1.68 (2.08) | 1.33 (1.79) | 0.63 (0.44)a 2.12 (0.17)b 1.76 (0.21)c |
| Hope | 6.37 (1.55) | 6.11 (2.03) | 5.93 (1.62) | 5.57 (2.18) | 2.11 (0.18)a 1.29 (0.28)b 0.02 (0.87)c |
| Discomfort | 1.31 (1.33) | 2.14 (1.84) | 1.04 (1.14) | 2.10 (1.60) | 0.30 (0.596)a 8.22 (0.02)b 0.16 (0692)c |
Values are given in mean (SD).
Main effect of hemisphere stimulated.
Main effect of stimulation.
Main effect of interaction.
Common components across all resting fMRI sessions
We identified 12 ICA components that were common to all the resting fMRI (rs-fMRI) sessions. We then compared the first and the second sham tDCS sessions (1 month apart); only two spatial patterns, one involving the left primary somatosensory cortex (Brodmann Areas [BA] 1, 2, 3) and the other the right primary and premotor cortex (BA 4, 6), differed between sessions of sham tDCS. Figure 2 and Table 2 illustrate and describe the 12 components (A-L) common to all sessions, all exhibiting the same spatial map. Table 3 shows a quantitative description of the percent variance explained of each component used for later analyses corresponding to each experimental day.
Table 2.
Anatomic description of the common networks identified across all R-fMRI sessions
| IC | Brodmann areas | Brain areas |
|---|---|---|
| A | 17, 18, 19 | Primary, secondary and associative visual cortex |
| B | 9, 10, 11, 32; 23, 39 | DLPFC, anterior PFC, orbitofrontal area, dorsal anterior cingulate cortex; posterior cingulate and angular gyrus |
| C | 3, 4, 6 | Primary somatosensory and motor cortex, premotor cortex and supplementary motor cortex |
| D | 22, 23, 36; 39, 7 | Superior temporal gyrus, posterior cingulate cortex, parahippocampal gyrus; angular gyrus and somatosensory association cortex |
| E/F | 2, 6, 4; 7, 39, 40; 44, 45, 46, 47; 20, 21. | Left and right parts of the motor cortex system inferior and superior parietal, DLPFC, and inferior and middle temporal gyrus, respectively. |
| G | 17, 18 | medial occipital cortex |
| H | 9, 45, 46; 10, 11 | Left DLPFC and anterior prefrontal cortex |
| I | 22, 42, 41 | Primary and association auditory cortices |
| J | 7, 39, 40; 37 | Superior and inferior parietal cortex and fusiform gyrus. |
| K | 6, 23, 24, 32 | Ventral anterior and posterior cingulate cortex, premotor and supplementary motor cortex |
| L | 5, 7 | Somatosensory association cortex |
Table 3.
Percent variance explained by components selected for later functional network analysis
| Networks | Day 1
|
Day 2
|
||
|---|---|---|---|---|
| Sham-Left-DLPFC | Active- Left-DLPFC | Sham-Right-DLPFC | Active-Right-DLPFC | |
| DMN | 9.96% | 8.75% | 9.55% | 9.13% |
| AN | 8.67% | 9.11% | 9.12% | 9.45% |
| Visual | 0.68% | 1.03% | 1.10% | 0.98% |
| Motor | 1.13% | 1.52% | 1.97% | 1.15% |
DMN = default mode network (anterior and posterior areas); AN = anticorrelation network (DLPFC and parietal cortices).
Effects of active versus sham tDCS to left and right DLPFC on spatial domain
Analysis in the spatial domain revealed two more ICs in addition to the 12 depicted in Figure 2, which emerged after active tDCS over left and right DLPFC (Figure 3A and B, respectively). The new emerging components had a very similar spatial pattern to that of Figure 2B. Figure 3D and E were detectable after both sham tDCS sessions but absent after active tDCS to the left or right DLPFC. These ICs coincided in the inferior parietal cortex and to a lesser extent in the primary auditory association cortex (BA 7, 39, 40, 41).
Figure 3.

Components with coincident regions that additionally emerged after active tDCS to the left (A) or right (B) DLPFC. C displays the superimposition of both ICs, blue corresponding to A and red to B. Coincident components that were present after sham stimulation but vanished after active tDCS to the left (D) or right (E) hemispheres. F displays the superimposition of components, blue corresponding to A and red to B. (Color version of figure is available online.)
Effects of active versus sham tDCS to left and right DLPFC on the temporal synchrony domain
In the DMN, AN, visual, and motor areas, two statistically significant differences in correlation values for sham versus active tDCS were identified using a paired t test. FNC analysis revealed how the strongest synchronous activity between Figure 4A, B and Figure 5A, B faded away significantly (P < 0.01) after either left or right tDCS (zSHAM = 0.64 zACTIVE = 0.10 for left; zSHAM = 0.66 zACTIVE = −0.07 for right; average correlation is given over all subjects and represents the Fisher z-transformed Pearson coefficient). Component A included the posterior cingulate cortex (PCC), and angular gyrus (BA 39). Component B included the anterior and medial prefrontal cortex, anterior and posterior cingulate cortex (BA 10, 11, 23, 24, 25, 32) and the angular gyrus (BA 39).
Figure 4.

Networks which experimented a significant correlation change (paired t test P < 0.01, corrected for multiple comparisons) after active tDCS over left DLPFC. Average temporal relationship between DMN and AN components for sham (zSHAM-DMN = 0.64, zSHAM-AN = −0.07) and active (zACTIVE-DMN = 0.10, zACTIVE-AN = 0.27) tDCS groups for day 1. Note that after sham tDCS the best fitted temporal synchrony (rSHAM-DMN = 0.64) is between components A (posterior DMN) and B (anterior DMN, fluctuations depicted in grey and blue, respectively). Conversely, after active tDCS there is a shift in temporal synchrony (zACTIVE-AN = 0.27) in favor of components C (mainly left parietal) and D (left DLPFC, fluctuations depicted in green and red, respectively), areas corresponding to AN. (Time courses extracted for one representative subject and z value represents the Fisher z-transformed Pearson coefficient). (Color version of figure is available online.)
Figure 5.

Networks which experimented a significant correlation (paired t test P < 0.01, corrected for multiple comparisons) change after active tDCS over right DLPFC. Averaged temporal relationship between DMN and AN components for sham (zSHAM-DMN = 0.66, zSHAM-AN = −0.02) and active (zACTIVE-DMN = −0.07, zACTIVE-AN = 0.24) tDCS groups for day 2. After sham tDCS a stronger correlation (zSHAM-DMN = 0.66) is observed between component A (posterior DMN) and B (anterior DMN, fluctuations depicted in grey and red, respectively). Conversely, after active tDCS the temporal correlations (zACTIVE-AN = 0.24) shift to C (right DLPFC) and D (bilateral parietal, fluctuations depicted in green and yellow, respectively), areas corresponding to the AN. (Time courses extracted for one representative subject and z value represents the Fisher z-transformed Pearson coefficient). (Color version of figure is available online.)
In addition, the temporal synchrony between Figure 4C, D and Figure 5C, D increased significantly (P < 0.01) after active tDCS to left-DLPFC as well as right-DLPFC (zSHAM = −0.07 zACTIVE = 0.27 for left; zSHAM = −0.02 zACTIVE = 0.24 for right; average correlation is given over all subjects and represents the Fisher z-transformed Pearson coefficient). Component C included mainly the superior parietal cortex (BA 7, 40). Component D included mainly the lateral prefrontal cortex (BA 6, 8, 9, 46).
Importantly, the average temporal correlation for all subjects between the visual and motor systems did not change significantly after either left (zSHAM = 0.12 zACTIVE = 0.15) or right (zSHAM = 0.14 zACTIVE = 0.10) active tDCS stimulation in comparison with sham stimulation.
Discussion
The aim of the current study was to investigate resting-state large-scale network dynamics using tDCS and fMRI. Specifically, we examined how active tDCS over the left or right DLPFC in comparison with sham tDCS modulates time course fluctuations within and across the DMN and the AN on rs-fMRI. Two main results emerged: (1) active anodal tDCS to the DLPFC resulted in a stronger temporal functional connectivity between prefrontal and parietal regions, which are components of the AN network; (2) the spatial robustness of the DMN was reduced after 20 minutes of active, anodal tDCS over left or right DLPFC.
Effects of sham tDCS on ICA
To ensure the stability of the resting state networks we performed an additional comparison contrasting the spatial patterns of the sham sessions. Although 1 month had elapsed between the two sham tDCS sessions, very similar spatial pattern of resting state networks emerged, and only two components observed in the second sham session were absent in the first. These components encompassed mainly the somatosensory cortex and motor cortices, components that were unaffected after each tDCS session. It has been demonstrated that using resting-state fMRI,52 it is possible to examine the specific subsystems within both motor and somatosensory networks, thus we hypothesized that these two components that were not present in the first session may represent subsystems that appear in the second acquisition, where factors such as novelty and adaptation to the scanner environment allowed a better resting state condition.
Overall, our data contrasting sham tDCS sessions performed with an interval of 1 month support the notion of a high degree of stability in human resting brain networks across time.10,53 The localization of the spatial ICA networks after both sham tDCS sessions corresponds with those defined in previous studies of young individuals.10 Our IC analyses under sham tDCS conditions characterized the DMN in an anterior area comprising the MPFC and a posterior component consisting of the PCC and the IPL. These results also corroborate previous resting fMRI reports10,18 and support the notion that sham tDCS does not have a significant effect on large-network dynamics.
Temporal and spatial effects of tDCS on DMN and AN
As we had hypothesized, the effects of anodal tDCS applied over the left or right DLPFC exerted the most noticeable effects specifically in spatial and temporal characteristics of DMN and AN. The visual and motor areas did not reveal any change in temporal synchrony before and after stimulation. So the first relevant finding of the current study is that it confirms and extends previous observations combining fMRI with tDCS applied over the motor cortex, showing that low-intensity tDCS not only changes cortical excitability in the underlying cortex but provokes widespread, bihemispheric effects.37,38 Moreover, by using ICA, a powerful tool for finding spatiotemporally independent brain networks, we provide novel evidence that activity changes prompted by tDCS of the DLPFC do not occur in an unspecific manner; on the contrary, they involve highly specific RSNs, reflecting spontaneous intrinsic activity within neuroanatomic networks (54for the structural brain connectivity substrates of RSNs).
In our study, after active stimulation to right or left DLPFC, a new spatial component emerged sharing anatomical characteristics of the anterior part of the DMN (Figure 3). Therefore, although the anterior DMN was already evident after sham tDCS sessions (Figure 2), it appeared divided into two additional ICs after active tDCS. Active tDCS may have divided the one component observed after sham stimulation into two independent components that fluctuate asynchronously after active stimulation. If so, the functional network connectivity analysis (temporal coherence) should reveal some asynchrony in time courses.46,47 This was in fact the case: in our FNC analysis we found that the strong correlations in sham sessions between anterior and posterior components of the DMN (Figures 4 and 5) vanished after active tDCS, whereas the temporal synchrony between DLPFC and lateral parietal areas was enhanced after stimulation. Thus, the strong temporal correlation between components of DMN observed in both sham sessions was altered after active tDCS to left or right DLPFC (Figures 4 and 5).
Conversely, the disappearance of the parietal components after active tDCS (Figure 2), might suggest that they were merged into another existing component.50,55 If so, the FNC analyses would be expected to reveal that the time courses of these parietal regions correspond to the ones observed in another component.46 Indeed, we observed that after tDCS the time course of these regions correlated best with that of the lateral prefrontal cortex (Figures 4 and 5). Overall, then, it appears that active tDCS resulted in site-specific increased synchronous activity between lateral frontal and parietal areas although concurrently resulting in asynchronous activity between the medial prefrontal and medial posterior areas. The former areas are located in the AN, whereas the latter areas are in the DMN; altogether, active tDCS resulted in increased/reduced synchronous activity of the AN/DMN.
Relation with previous rs-fMRI and tDCS studies of cognitive function
Previous studies during cognitive tasks have shown that DMN activity is reduced when subjects are prompted to perform goal-oriented tasks,24 or when the cognitive demand of a task increases.25,27 Interestingly, recent reports have demonstrated that changes to directional network dynamics, including the DMN and AN, occur not only during ongoing cognitive processes but may also appear during rs-fMRI acquisitions, as a function of recent experience. In this regard, Lewis et al.26 noticed that rs-fMRI acquired before visual perception training showed the expected near zero correlations between visual cortex regions and the dorsolateral frontoparietal attention network, whereas negative correlations between these two systems were observed during a second rs-fMRI after extensive training. Similarly, Albert et al.56 demonstrated increased functional connectivity in the motor system only when subjects learnt a novel task, but not when they repeated a familiar task with the same intensity, and Stevens et al.57 observed increased correlations between the inferior frontal gyrus and areas preferentially activated during face and scene encoding during postlearning for faces and postlearning for scenes respectively. Pyka et al.25 also observed increased activation of the DMN during rs-fMRI periods after the performance of attentional or working memory activation blocks (one or two-back tasks, respectively) compared with that after a less cognitively challenging task (zero-back). Importantly, fluctuations of some of these brain networks during58 or after task performance24 have been identified as predictors of subsequent cognitive performance. Altogether, these studies suggest that the optimal neurophysiologic functional state in the face of cognitive demands is a flexible balance between large-scale networks.
Recent tDCS literature suggests that low-intensity electrical stimulation over the DLPFC can result in transient improvements in a variety of cognitive functions including declarative32 and working memory,29–31 planning,33 language learning,34 attention,36 and decision making.59 Our study provides the first evidence that tDCS over the DLPFC with similar parameters as those shown to lead to behavioral and cognitive gains changes intrinsic brain activity in a manner similar to that found in situations that are cognitively demanding or are shaped by recent learning experiences. In our study, we did not perform cognitive evaluations, but the changes in large-scale networks after the application of the tDCS suggest that our findings may provide novel insights into the mechanisms of action of this procedure. This interpretation fits particularly well with the view that deactivations of the DMN may prompt or facilitate reallocation of cerebral resources to support task performance,12,25,60 a functional status that seems to be facilitated by tDCS.
A difference with respect to the previous fMRI studies reported previously is that the large-network fMRI changes induced by tDCS are not observed during or after task performance but before any cognitive operation was undertaken. In principle, this would lessen the possibility of relating RSNs reconfigurations induced by electrical stimulation in our subjects with putative variations in behavioral performance. On the other hand, it is worth noting that some tDCS studies have revealed improvements in behavioral performance particularly when electrical stimulation was started during resting periods, before the actual task performance was initiated29 or even in some pure “off-line” investigations36,61 (i.e., where electrical stimulation is only applied in resting conditions) or where tDCS is applied when subjects are sleeping.30 The rationale underlying these studies36,61 is that a minimum period (i.e., 3 minutes) of stimulation is needed to induce significant changes in cortical excitability.36 Possibly, then, the effects of electrical brain stimulation before task performance may act as some sort of preparatory mechanism, optimizing functional brain resources. Hence, our study reveals malleable changes in primary cognitive-related RSNs after an extended period of tDCS. This confirms the idea that anodal electrical stimulation may act as a priming effect, specifically considering the resulting configuration of intrinsic brain activity networks previously associated with cognitive advantages, as reported previously. Therefore, our methodologic approach combining tDCS with fMRI reveals that the functional status of RSNs linked to behavioral performance is not only relevant during the temporal window encompassing either direct cognitive engagement47 or reflecting putative subsequent consolidation56,57 or possible self-evaluation25 processes to recent cognitive experience, but even though as an existing preparatory state for upcoming cognitive demands.
Certain limitations of the study should be borne in mind in interpreting the results. One important limitation of this study is the number of subjects included. However, even thought that it was a small sample, we believe that our use of a repeated-measures design in which the same subjects passed through all the conditions allowed satisfactory control of the confounding variables. Nonetheless, the results of this study should be replicated in a higher sample size to bring more reliability to the results presented in this study. Although there are clear differences regarding the functionality of the targeted areas of stimulation and this might induce differences in the tDCS effect, we were interested in investigating robust and reliable tDCS effects over the right and left DLPFC. The results presented in this study are analyzed independently and coincide for each targeted area, thus ensuring the robustness of the findings. In our study, subjects always received sham stimulation, followed by active stimulation to avoid the possibility that the fMRI after sham stimulation could have been confounded by the after effects of tDCS. Studies in the literature have suggested that tDCS effects may last up to 1 hour for 10-minute stimulation on the basis of motor cortex excitability, but the possibility of longer effects on the DLPFC has not been investigated in functional neuroimaging studies. Further, in our control of mood states, “discomfort” was the only one to present a main effect of stimulation, and this effect could not have been related to changes in the expression of the functional networks investigated.
Supplementary Material
Acknowledgments
Partially funded by a Spanish Ministerio de Educación y Ciencia research project award (SAF2007-66270) and the Spanish Ministerio de Ciencia e Innovación (SAF2009-07489) to DBF and fundings from the Generalitat de Catalunya to the Neuropsychology Research Group (2009SGR941). A.P-.L. was supported in part by grants from the National Institutes of Health (K24 RR018875, RO1-NS 20068, R01-EB 005047), and Grant Number UL1 RR025758-Harvard Clinical and Translational Science Center, from the National Center for Research Resources. The content is solely the responsibility of the authors and does not necessarily represent the official views of the National Center for Research Resources or the National Institutes of Health.
Footnotes
Supplementary data related to this article can be found online at doi:10.1016/j.brs.2011.08.006.
References
- 1.Mayberg HS, Lozano AM, Voon V, et al. Deep brain stimulation for treatment-resistant depression. Neuron. 2005;45:651–660. doi: 10.1016/j.neuron.2005.02.014. [DOI] [PubMed] [Google Scholar]
- 2.Lytton WW. Computer modelling of epilepsy. Nat Rev Neurosci. 2008;9:626–637. doi: 10.1038/nrn2416. [DOI] [PMC free article] [PubMed] [Google Scholar]
- 3.Seeley WW, Crawford RK, Zhou J, Miller BL, Greicius MD. Neuro-degenerative diseases target large-scale human brain networks. Neuron. 2009;62:42–52. doi: 10.1016/j.neuron.2009.03.024. [DOI] [PMC free article] [PubMed] [Google Scholar]
- 4.He BJ, Shulman GL, Snyder AZ, Corbetta M. The role of impaired neuronal communication in neurological disorders. Curr Opin Neurol. 2007;20:655–660. doi: 10.1097/WCO.0b013e3282f1c720. [DOI] [PubMed] [Google Scholar]
- 5.Ween JE. Functional imaging of stroke recovery: an ecological review from a neural network perspective with an emphasis on motor systems. J Neuroimaging. 2008;18:227–236. doi: 10.1111/j.1552-6569.2007.00180.x. [DOI] [PubMed] [Google Scholar]
- 6.Kumar S, Rao SL, Chandramouli BA, Pillai SV. Reduction of functional brain connectivity in mild traumatic brain injury during working memory. J Neurotrauma. 2009;26:665–675. doi: 10.1089/neu.2008.0644. [DOI] [PubMed] [Google Scholar]
- 7.Biswal B, Yetkin FZ, Haughton VM, Hyde JS. Functional connectivity in the motor cortex of resting human brain using echo-planar MRI. Magn Reson Med. 1995;34:537–541. doi: 10.1002/mrm.1910340409. [DOI] [PubMed] [Google Scholar]
- 8.Fox MD, Raichle ME. Spontaneous fluctuations in brain activity observed with functional magnetic resonance imaging. Nat Rev Neurosci. 2007;8:700–711. doi: 10.1038/nrn2201. [DOI] [PubMed] [Google Scholar]
- 9.Beckmann CF, DeLuca M, Devlin JT, Smith M. Investigations into resting-state connectivity using independent component analysis. Phil Trans R Soc B. 2005;360:1001–1013. doi: 10.1098/rstb.2005.1634. [DOI] [PMC free article] [PubMed] [Google Scholar]
- 10.Damoiseaux JS, Rombouts SARB, Barkhof F, et al. Consistent resting-state networks across healthy subjects. Proc Natl Acad Sci U S A. 2006;103:13848–13853. doi: 10.1073/pnas.0601417103. [DOI] [PMC free article] [PubMed] [Google Scholar]
- 11.Shulman GL, Fiez JA, Corbetta M, et al. Common blood flow changes across visual tasks: II, decreases in cereb cortex. J Cogn Neurosci. 1997;9:648–663. doi: 10.1162/jocn.1997.9.5.648. [DOI] [PubMed] [Google Scholar]
- 12.Raichle ME, MacLeod AM, Snyder AZ, Powers WJ, Gusnard DA, Shulman GL. A default mode of brain function. Proc Natl Acad Sci U S A. 2001;98:676–682. doi: 10.1073/pnas.98.2.676. [DOI] [PMC free article] [PubMed] [Google Scholar]
- 13.Greicius MD, Krasnow B, Al Reiss S, Menon V. Functional connectivity in the resting brain: a network analysis of the default mode hypothesis. Proc Natl Sci U S A. 2003;100:253–258. doi: 10.1073/pnas.0135058100. [DOI] [PMC free article] [PubMed] [Google Scholar]
- 14.Raichle ME, Snyder AZ. A default mode of brain function: a brief history of an evolving idea. Neuroimage. 2007;37:1083–1090. doi: 10.1016/j.neuroimage.2007.02.041. [DOI] [PubMed] [Google Scholar]
- 15.Buckner RL, Andrews-Hanna JR, Schacter DL. The brain’s default network: anatomy, function, and relevance to disease. Ann N Y Acad Sci. 2008;1124:1–38. doi: 10.1196/annals.1440.011. [DOI] [PubMed] [Google Scholar]
- 16.Lustig C, Snyder AZ, Bhakta M, et al. Functional deactivations: change with age and dementia of the Alzheimer type. Proc Natl Acad Sci U S A. 2003;100:14504–14509. doi: 10.1073/pnas.2235925100. [DOI] [PMC free article] [PubMed] [Google Scholar]
- 17.Buckner RL, Snyder AZ, Shannon BJ, et al. Molecular, structural, and functional characterization of Alzheimer’s disease: evidence for a relationship between default activity, amyloid, and memory. J Neurosci. 2005;25:7709–7717. doi: 10.1523/JNEUROSCI.2177-05.2005. [DOI] [PMC free article] [PubMed] [Google Scholar]
- 18.Rombouts S, Damoiseaux JS, Goekoop R, et al. Model-Free Group Analysis shows altered BOLD fMRI networks in dementia. Hum Brain Mapp. 2009;30:256–266. doi: 10.1002/hbm.20505. [DOI] [PMC free article] [PubMed] [Google Scholar]
- 19.Mannell MV, Franco AR, Calhoun VD, Canive JM, Thoma RJ, Mayer AR. Resting state and task-induced deactivation: a methodological comparison in patients with schizophrenia and healthy controls. Hum Brain Mapp. 2010;31:424–437. doi: 10.1002/hbm.20876. [DOI] [PMC free article] [PubMed] [Google Scholar]
- 20.Hamilton JP, Furman DJ, Chang C, Thomason ME, Dennis E, Gotlib IH. Default-mode and task-positive network activity in major depressive disorder: implications for adaptive and maladaptive rumination. Biol Psychiatry. 2011;70(4):327–333. doi: 10.1016/j.biopsych.2011.02.003. [DOI] [PMC free article] [PubMed] [Google Scholar]
- 21.Broyd SJ, Demanuele C, Debener S, et al. Default-mode brain dysfunction in mental disorders: a systematic review. Neurosci Biobehav Rev. 2009;33:279–296. doi: 10.1016/j.neubiorev.2008.09.002. [DOI] [PubMed] [Google Scholar]
- 22.Fox MD, Snyder AZ, Vincent JL, Corbetta M, VanEssen DC, Raichle ME. The human brain is intrinsically organized into dynamic, anticorrelated functional networks. Proc Natl Acad Sci U S A. 2005;102:9673–9678. doi: 10.1073/pnas.0504136102. [DOI] [PMC free article] [PubMed] [Google Scholar]
- 23.Fransson P. Spontaneous low-frequency BOLD signal fluctuations: an fMRI investigation of the resting-state default mode of brain function hypothesis. Hum Brain Mapp. 2005;26:15–29. doi: 10.1002/hbm.20113. [DOI] [PMC free article] [PubMed] [Google Scholar]
- 24.Hampson M, Driesen NR, Skudlarski P, Gore JC, Constable RT. Brain connectivity related to working memory performance. J Neurosci. 2006;26:13338–13343. doi: 10.1523/JNEUROSCI.3408-06.2006. [DOI] [PMC free article] [PubMed] [Google Scholar]
- 25.Pyka M, Beckmann CF, Schoning S, et al. Impact of working memory load on FMRI resting state pattern in subsequent resting phases. PLoS One. 2009;4:e7198. doi: 10.1371/journal.pone.0007198. [DOI] [PMC free article] [PubMed] [Google Scholar]
- 26.Lewis CM, Baldassarre A, Committeri G, Romani GL, Corbetta M. Learning sculpts the spontaneous activity of the resting human brain. Proc Natl Sci U S A. 2009;106:17558–17563. doi: 10.1073/pnas.0902455106. [DOI] [PMC free article] [PubMed] [Google Scholar]
- 27.Newton AT, Morgan VL, Rogers BP, Gore JC. Modulation of steady state functional connectivity in the default mode and working memory networks by cognitive load. Hum Brain Mapp. 2010 doi: 10.1002/hbm.21138. [Epub ahead of print] [DOI] [PMC free article] [PubMed] [Google Scholar]
- 28.Nitsche MA, Paulus W. Excitability changes induced in the human motor cortex by weak transcranial direct current stimulation. J Physiol. 2000;527:633–639. doi: 10.1111/j.1469-7793.2000.t01-1-00633.x. [DOI] [PMC free article] [PubMed] [Google Scholar]
- 29.Fregni F, Boggio PS, Nitsche M, et al. Anodal transcranial direct current stimulation of prefrontal cortex enhances working memory. Exp Brain Res. 2005;166:23–30. doi: 10.1007/s00221-005-2334-6. [DOI] [PubMed] [Google Scholar]
- 30.Marshall L, Molle M, Hartwig R, Siebner H, Born J. Bifrontal trans-cranial direct current stimulation slows reaction time in a working memory task. BMC Neurosci. 2005;6:23. doi: 10.1186/1471-2202-6-23. [DOI] [PMC free article] [PubMed] [Google Scholar]
- 31.Zaehle T, Sandmann P, Thorne JD, Jancke L, Herrmann CS. Transcranial direct current stimulation of the prefrontal cortex modulates working memory performance: combined behavioural and electro-physiological evidence. BMC Neurosci. 2011;6(12):2. doi: 10.1186/1471-2202-12-2. [DOI] [PMC free article] [PubMed] [Google Scholar]
- 32.Floel A, Cohen LG. Contribution of noninvasive cortical stimulation to the study of memory functions. Brain Res Rev. 2007;53:250–259. doi: 10.1016/j.brainresrev.2006.08.006. [DOI] [PubMed] [Google Scholar]
- 33.Dockery CA, Hueckel-Weng R, Birbaumer N, Plewnia C. Enhancement of planning ability by transcranial direct current stimulation. J Neurosci. 2009;29:7271–7277. doi: 10.1523/JNEUROSCI.0065-09.2009. [DOI] [PMC free article] [PubMed] [Google Scholar]
- 34.Floel A, Rosser N, Michka O, Knecht S, Breitenstein C. Noninvasive brain stimulation improves language learning. J Cogn Neurosci. 2008;20:1415–1422. doi: 10.1162/jocn.2008.20098. [DOI] [PubMed] [Google Scholar]
- 35.Cattaneo Z, Pisoni A, Papagno C. Transcranial direct current stimulation over Broca’s region improves phonemic and semantic fluency in healthy individuals. Neuroscience. 2011;183:64–70. doi: 10.1016/j.neuroscience.2011.03.058. [DOI] [PubMed] [Google Scholar]
- 36.Boggio PS, Bermpohl F, Vergara AO, et al. Go-no-go task performance improvement after anodal transcranial DC stimulation of the left dorsolateral prefrontal cortex in major depression. J Affect Disord. 2007;101:91–98. doi: 10.1016/j.jad.2006.10.026. [DOI] [PubMed] [Google Scholar]
- 37.Lang N, Siebner HR, Ward NS, et al. How does transcranial DC stimulation of the primary motor cortex alter regional neuronal activity in the human brain? Eur J Neurosci. 2005;22:495–504. doi: 10.1111/j.1460-9568.2005.04233.x. [DOI] [PMC free article] [PubMed] [Google Scholar]
- 38.Polanía R, Paulus W, Antal A, Nitsche MA. Introducing graph theory to track for neuroplastic alterations in the resting human brain: a trans-cranial direct current stimulation study. Neuroimage. 2011;54(3):2287–2296. doi: 10.1016/j.neuroimage.2010.09.085. [DOI] [PubMed] [Google Scholar]
- 39.Long XY, Zuo XN, Kiviniemi V, et al. Default mode network as revealed with multiple methods for resting-state functional MRI analysis. J Neurosci Methods. 2008;171:349–355. doi: 10.1016/j.jneumeth.2008.03.021. [DOI] [PubMed] [Google Scholar]
- 40.Calhoun VD, Adali T, Pearlson G, Pekar J. A method for making group inferences from fMRI data using independent component analysis. Hum Brain Mapp. 2001;14:140–151. doi: 10.1002/hbm.1048. [DOI] [PMC free article] [PubMed] [Google Scholar]
- 41.Bell A, Sejnowski T. An information-maximization approach to blind separation and blind deconvolution. Neural Comput. 1995;7:1129–1159. doi: 10.1162/neco.1995.7.6.1129. [DOI] [PubMed] [Google Scholar]
- 42.Rissanen J. A universal prior for integers and estimation by minimum description length. Ann Stat. 1983;11:416–431. [Google Scholar]
- 43.Beckmann CF, DeLuca M, Devlin JT, Smith M. Investigations into resting-state connectivity using independent component analysis. Phil Trans R Soc B. 2005;360:1001–1013. doi: 10.1098/rstb.2005.1634. [DOI] [PMC free article] [PubMed] [Google Scholar]
- 44.Himberg J, Hyvarinen A, Esposito F. Validating the independent components of neuroimaging time-series via clustering and visualization. Neuroimage. 2004;22:1214–1222. doi: 10.1016/j.neuroimage.2004.03.027. [DOI] [PubMed] [Google Scholar]
- 45.Hyvarinen A, Oja E. A fast fixed-point algorithm for independent component analysis. Neural Comput. 1997;9:1483–1492. [Google Scholar]
- 46.Jafri MJ, Pearlson GD, Stevens M, Calhoun VD. A method for functional network connectivity among spatially independent resting-state components in schizophrenia. Neuroimage. 2008;39:1666–1681. doi: 10.1016/j.neuroimage.2007.11.001. [DOI] [PMC free article] [PubMed] [Google Scholar]
- 47.Assaf M, Jagannathan K, Calhoun V, Kraut M, Hart J, Jr, Pearlson G. Temporal sequence of hemispheric network activation during semantic processing: a functional network connectivity analysis. Brain Cogn. 2009;70:238–246. doi: 10.1016/j.bandc.2009.02.007. [DOI] [PMC free article] [PubMed] [Google Scholar]
- 48.Calhoun VD, Adali T. Unmixing functional magnetic resonance imaging with independent component analysis. IEEE Eng Med Biol. 2006;25:79–90. doi: 10.1109/memb.2006.1607672. [DOI] [PubMed] [Google Scholar]
- 49.Calhoun VD, Eichele T, Pearlson G. Functional brain networks in schizophrenia: a review. Front Hum Neurosci. 2009;3:17. doi: 10.3389/neuro.09.017.2009. [DOI] [PMC free article] [PubMed] [Google Scholar]
- 50.Calhoun VD, Adali T, Pearlson G, Pekar J. A method for making group inferences from fMRI data using independent component analysis. Hum Brain Mapp. 2001;14:140–151. doi: 10.1002/hbm.1048. [DOI] [PMC free article] [PubMed] [Google Scholar]
- 51.Genovese CR, Lazar NA, Nichols T. Thresholding of statistical maps in functional neuroimaging using the false discovery rate. NeuroImage. 2002;15:870–878. doi: 10.1006/nimg.2001.1037. [DOI] [PubMed] [Google Scholar]
- 52.Van den Heuvel MP, Hulshoff Pol HE. Specific somatotopic organization of functional connections of the primary motor network during resting state. Hum Brain Mapp. 2010;31:631–644. doi: 10.1002/hbm.20893. [DOI] [PMC free article] [PubMed] [Google Scholar]
- 53.Zhang H, Duan L, Zhang YJ, Lu CM, Liu H, Zhu CZ. Test-retest assessment of independent component analysis-derived resting-state functional connectivity based on functional near-infrared spectroscopy. Neuroimage. 2011;15(55):607–615. doi: 10.1016/j.neuroimage.2010.12.007. [DOI] [PubMed] [Google Scholar]
- 54.Honey CJ, Sporns O, Cammoun L, et al. Predicting human resting-state functional connectivity from structural connectivity. Proc Natl Acad Sci U S A. 2009;106:2035–2040. doi: 10.1073/pnas.0811168106. [DOI] [PMC free article] [PubMed] [Google Scholar]
- 55.Calhoun VD, Adali T, Pekar JJ, Pearlson GD. Latency (in)sensitive ICA Group independent component analysis of fMRI data in the temporal frequency domain. Neuroimage. 2003;20:1661–1669. doi: 10.1016/s1053-8119(03)00411-7. [DOI] [PubMed] [Google Scholar]
- 56.Albert NB, Robertson EM, Miall RC. The resting human brain and motor learning. Curr Biol. 2009;19:1023–1027. doi: 10.1016/j.cub.2009.04.028. [DOI] [PMC free article] [PubMed] [Google Scholar]
- 57.Stevens WD, Buckner RL, Schacter DL. Correlated low-frequency BOLD fluctuations in the resting human brain are modulated by recent experience in category-preferential visual regions. Cereb Cortex. 2009;20:1997–2006. doi: 10.1093/cercor/bhp270. [DOI] [PMC free article] [PubMed] [Google Scholar]
- 58.Anticevic A, Repovs G, Shulman GL, Barch DM. When less is more: TPJ and default network deactivation during encoding predicts working memory performance. Neuroimage. 2010;49:2638–2648. doi: 10.1016/j.neuroimage.2009.11.008. [DOI] [PMC free article] [PubMed] [Google Scholar]
- 59.Boggio PS, Campanhã C, Valasek CA, Fecteau S, Pascual-Leone A, Fregni F. Modulation of decision-making in a gambling task in older adults with transcranial direct current stimulation. Eur J Neurosci. 2010;31:593–597. doi: 10.1111/j.1460-9568.2010.07080.x. [DOI] [PubMed] [Google Scholar]
- 60.Gusnard DA, Raichle ME. Searching for a baseline: functional imaging and the resting human brain. Nat Rev Neurosci. 2001;2:685–694. doi: 10.1038/35094500. [DOI] [PubMed] [Google Scholar]
- 61.Boggio PS, Castro LO, Savagim EA, et al. Enhancement of non-dominant hand motor function by anodal transcranial direct current stimulation. Neurosci Lett. 2006;404:232–236. doi: 10.1016/j.neulet.2006.05.051. [DOI] [PubMed] [Google Scholar]
Associated Data
This section collects any data citations, data availability statements, or supplementary materials included in this article.