Abstract
A stand-alone front-end system for high-frequency coded excitation imaging was implemented to achieve a wider dynamic range. The system included an arbitrary waveform amplifier, an arbitrary waveform generator, an analog receiver, a motor position interpreter, a motor controller and power supplies. The digitized arbitrary waveforms at a sampling rate of 150 MHz could be programmed and converted to an analog signal. The pulse was subsequently amplified to excite an ultrasound transducer, and the maximum output voltage level achieved was 120 Vpp. The bandwidth of the arbitrary waveform amplifier was from 1 to 70 MHz. The noise figure of the preamplifier was less than 7.7 dB and the bandwidth was 95 MHz. Phantoms and biological tissues were imaged at a frame rate as high as 68 frames per second (fps) to evaluate the performance of the system. During the measurement, 40-MHz lithium niobate (LiNbO3) single-element lightweight (<0.28 g) transducers were utilized. The wire target measurement showed that the −6-dB axial resolution of a chirp-coded excitation was 50 µm and lateral resolution was 120 µm. The echo signal-to-noise ratios were found to be 54 and 65 dB for the short burst and coded excitation, respectively. The contrast resolution in a sphere phantom study was estimated to be 24 dB for the chirp-coded excitation and 15 dB for the short burst modes. In an in vivo study, zebrafish and mouse hearts were imaged. Boundaries of the zebrafish heart in the image could be differentiated because of the low-noise operation of the implemented system. In mouse heart images, valves and chambers could be readily visualized with the coded excitation.
I. Introduction
In ultrasound imaging, spatial resolution increases as the transmit frequency increases, but so does the attenuation, sacrificing depth of penetration [1]. This drawback may be compensated by raising the excitation voltage of an ultrasonic transducer or by elongating the length of the transmit waveform. An elongated burst delivers more energy to a focal depth than does a one- or two-cycle pulse when the same transmission voltage level is applied [2]. Coded excitation uses an elongated burst for transmission while maintaining the spatial resolution of an ultrasound image with a matched or a mismatched filter [3]. Here, the matched filters are time-inversed transmitted waveforms convolving with received ultrasound signals. A previous study demonstrated a 15-dB improvement of echo signal-to-noise ratio (eSNR) using coded excitation [4].
There are two types of the excitation codes: phase-modulated and frequency-modulated codes. Chiao et al. [5] reviewed these methods, describing the advantages and the disadvantages with clinical images. Although the phase-modulated code can be easily implemented with a high-voltage switching circuit [6], it suffers from higher range side lobes, requiring specially designed digital filters or beam sequences to suppress them. The representative phase modulation codes are the Barker code and the Golay code. The Barker code [7] has a 22.3 dB range side lobe when the code is compressed with a matched filter [8]. Hu et al. demonstrated that the side lobe level could be lowered to −40 dB and the eSNR improved by 14 dB with a mismatched filter [9]. The Golay code is capable of removing the range side lobes completely, but requires multiple transmissions, thus lowering the imaging frame rate [10].
Most high-frequency ultrasound imaging systems, often called ultrasonic biomicroscopes (UBM) [11], employ mechanical scanning. For small animal scanning, these scanners move a single-element transducer at a fast speed to achieve a frame rate as high as 60 fps, necessary to image cardiac motions [12]. Under these conditions, the Golay code may not be appropriate because it requires multiple transmissions. The frequency-modulated or the chirp code, on the other hand, can theoretically achieve an eSNR improvement of 12 to 18 dB and lower range side lobes by transmitting only one time [13].
To implement the chirp-coded excitation, an arbitrary waveform generator (AWG) and an arbitrary waveform amplifier (AWA) are required. Many studies in high-frequency chirp-coded excitation imaging have been pursued with the external AWAs or AWGs [14]–[16]. In one study, a high-frequency Golay coded imaging system was implemented with separate amplifier and power modules [17]. The image in this study showed a 50 dB dynamic range in m-mode and skin images were acquired at 10 frames per second. Recently, a programmable chirp-coded excitation system was built with a printed circuit board (PCB)-based design [15]. This broadband system allowed chirp-coded excitation imaging with a commercial power amplifier at frequencies as high as 40 MHz. In a simple pulse-echo experiment with a flat reflector, for chirp transmission, the noise level was found to be as low as −60 dB, compared to the observed noise level between −45 and −40 dB for short pulse transmission.
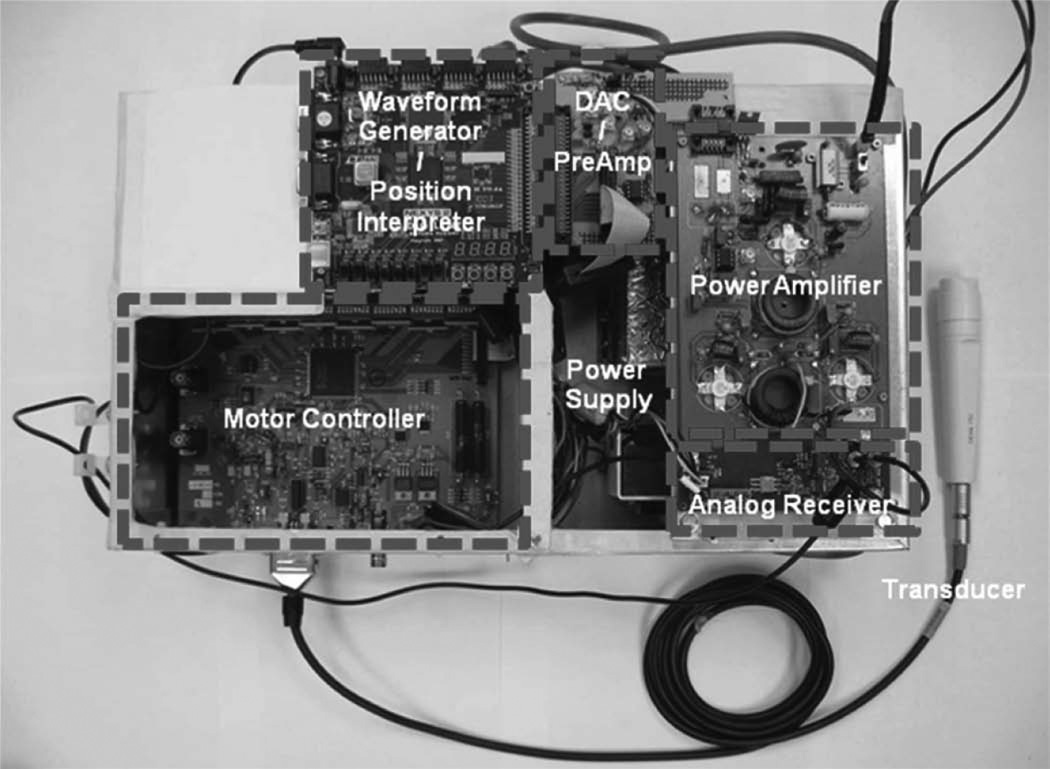
Although it is known that the use of a commercial AWA or AWG in a high-frequency imaging system may limit the dynamic range of ultrasound images with unexpected noise and increases the system size, a dedicated arbitrary pulse generator for this purpose has never been reported to the best of our knowledge. Previously, a pulse generator for high-frequency imaging was developed and multi-cycle bi-polar pulses are demonstrated, although it cannot be used for coded excitation applications [18]. For the reason, this paper reports the development of a standalone front-end system for high-frequency and high-frame-rate chirp-coded excitation ultrasound imaging. All the modules of the front-end system were integrated in the PCB-based designs. The AWA, AWG, motor controller, and power supply were assembled in an aluminum chassis. The performance of the system was assessed by scanning wire targets, a tissue mimicking phantom, and small animals in vivo.
II. Implementation
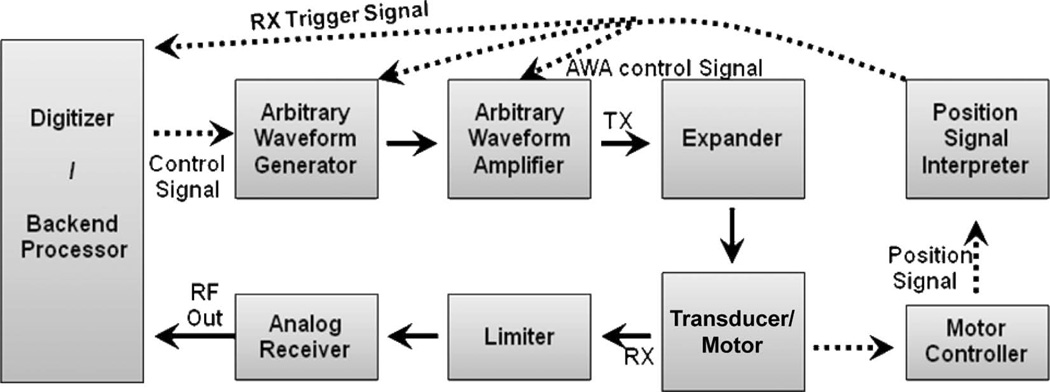
The single-channel front-end system includes an AWA, an AWG, a motor controller, an analog receiver, a backend interface, and power supplies. Fig. 1 shows a functional block diagram of the system. The imaging signal flow is indicated by solid lines and the control signals by dashed lines. For sector imaging, the motor moves a transducer in a 12° scanning angle over an imaging target at a speed up to 70 Hz and a sensor within the motor provides a position signal. The position signal is digitized into 8 bits in the motor control board [12] and sent to the motor position signal interpreter programmed in the AWG board. The digitized motor position signal is analyzed by a position signal interpreter. Once the motor starts to move a transducer, the interpreter generates trigger signals to control the transmission and receive operations in the front-end system. Image frames are acquired via one-way scanning.
Fig. 1.
Block diagram of a stand-alone front-end for a coded excitation imaging system. Dashed lines are control signal flow and solid arrows are transmission and receive signal flow.
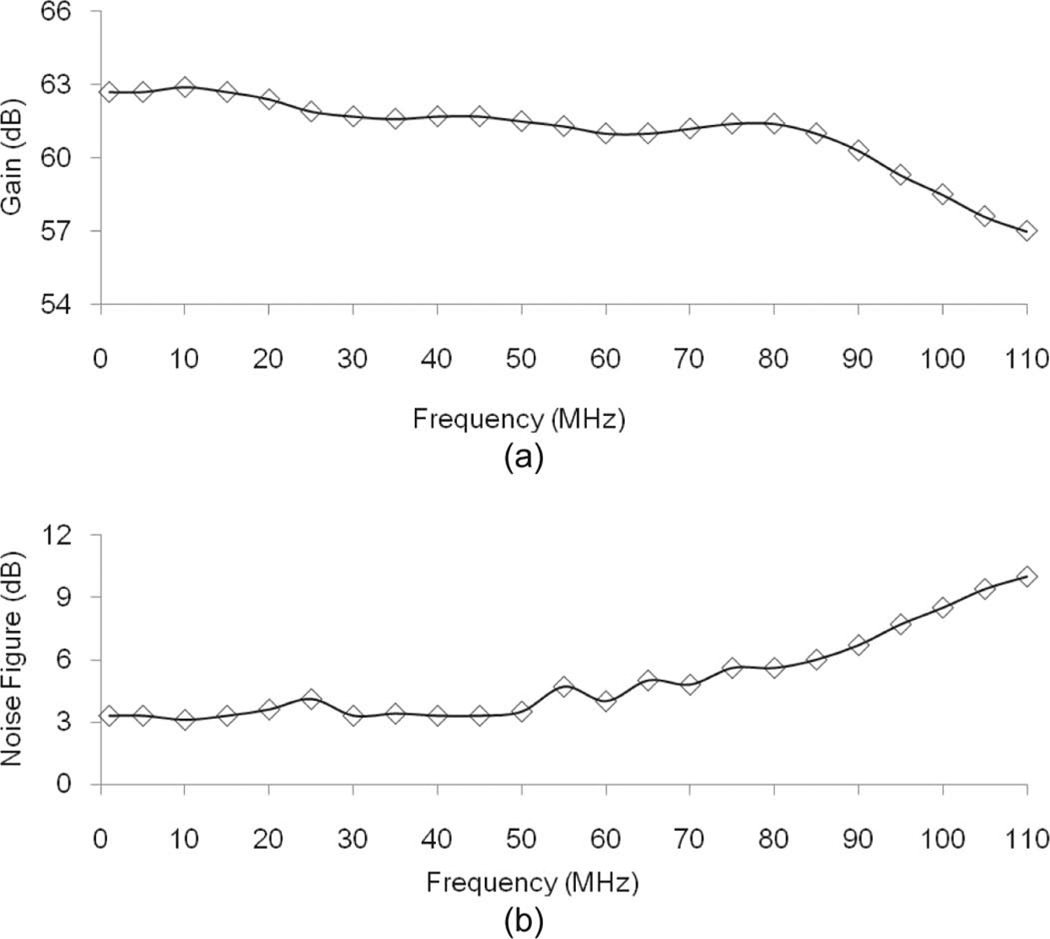
The received signal is amplified by a low-noise preamplifier (AD8331, Analog Devices, Norwood, MA) followed by a commercial amplifier (LN1000, Amplifier Research, Soulderton, PA) to acquire a high amplification rate with a flat gain distribution. The gain distribution and the noise figure (NF) of the combination were measured using a spectrum analyzer (E4401B, Agilent Technologies Inc., Santa Clara, CA) [19]. An input signal for measuring the gain distribution to the preamplifier is provided by a function generator (AFG3252, Tektronix, Beaverton, OR). Fig. 2 shows the result of these measurements. The −3-dB bandwidth is 95 MHz and the average gain within the bandwidth is 61 dB. The average and maximum values of NF are 4.3 and 7.7 dB, respectively.
Fig. 2.
The characteristics of the combination of the pre-amplifiers: (a) gain distribution versus the frequency, (b) noise figure distribution versus frequency.
The back-end system is in a desktop computer with an analog-to-digital converter (ADC). The ADC (CS14200, GaGe Applied Technologies Inc., Lachine, QC, Canada) digitizes the pre-amplified echo from the implemented front-end at 14 bits with a 200 MHz sampling rate. Based on the data sheet for the ADC, the effective number bit of the ADC is 10.7 and the maximum dynamic range is around 66 dB. Using chirp transmission, an eSNR improvement of 12 to 18 dB is expected, resulting in an extended dynamic range up to the maximum value [2]. The digitized signal is transferred to the back-end software developed in LabView (LabView 5.0, National Instruments, Austin, TX). Fig. 3 shows the signal flow for the post processing which includes band-pass filtering, Hilbert transformation for envelop detection, log compression, matched filtering for coded excitation, gray scale mapping, real-time image display, and data save. The matched filtering is achieved by convolving with an incoming signal when the coded excitation option is turned on in the software. The displayed frame rate is 4 fps, but the echo data can be saved at the same sweep speed of the transducer which is 68 fps.
Fig. 3.
Block diagram of the software back-end for a coded excitation imaging system.
A. Arbitrary Waveform Amplifier (AWA)
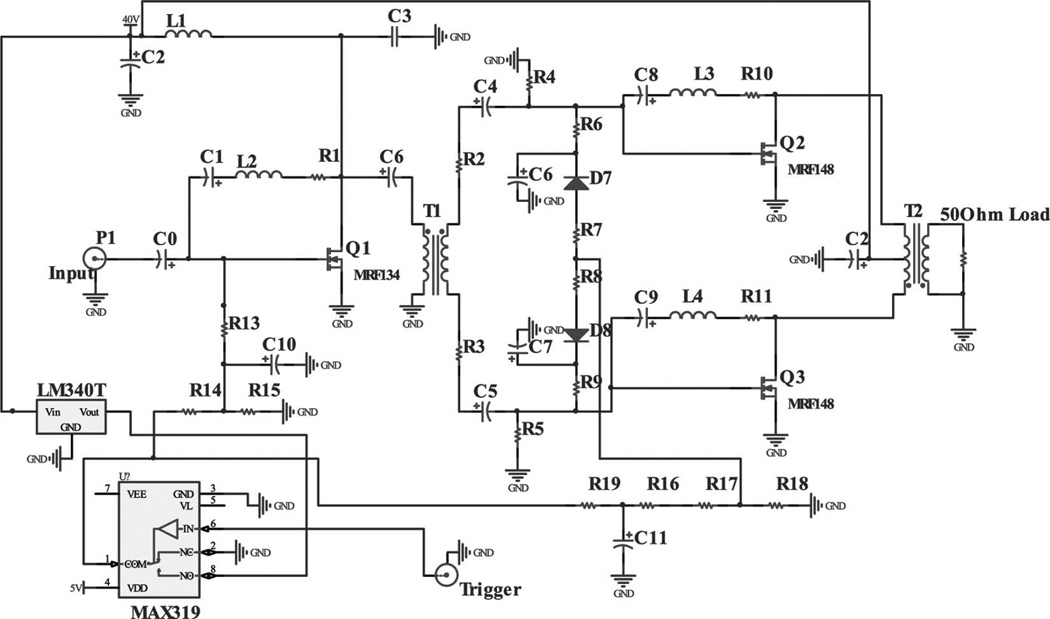
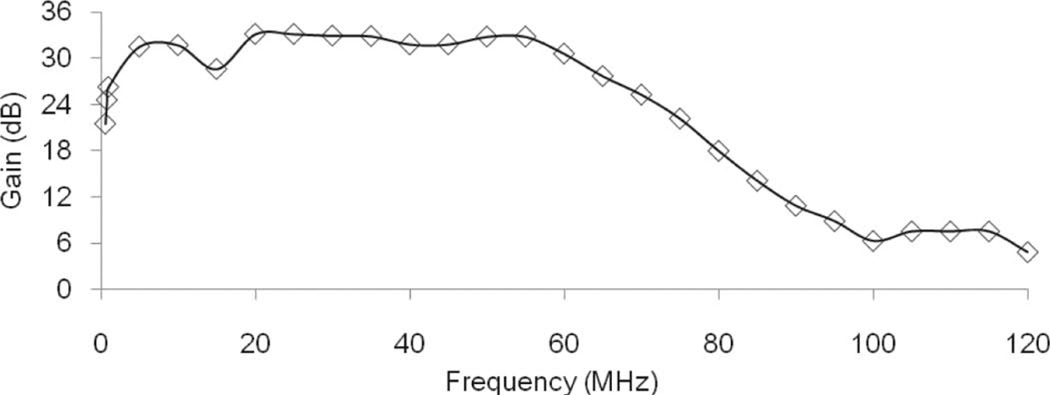
The AWA consists of two stages. The first stage is a class-A amplifier, which allows the amplification of the input signal with the least distortion. This stage drives a broadband signal to the second stage. An N-type RF MOSFET (MRF134, Motorola, Schaumburg, IL) is the active component in the first stage. A negative feedback circuit is used between the drain and the gate to achieve a flat gain. Biasing is accomplished through a voltage divider after a 15-V regulator (LM340T-15, National Semiconductor, Santa Clara, CA). The second stage is a class-AB amplifier. A push-pull circuit maximizes the amplification rate of the AWA with two identical N-type RF MOSFETs (MRF148, Motorola). Negative feedback circuits are also placed between the drain and the gate of the RF MOSFET. The output impedance matching with 50 Ω is accomplished with a 1:1 transformer at the final output port. Between these two stages, a 1:1 wideband transformer delivers high-frequency bursts from the first to the second stage. The transformer is fabricated by winding a 22 A WG enamel magnet copper wire (2700MG24, Electronix Express, Rahway, NJ) around a wideband ferrite core (5943001201, Fair-Rite, Wallkill, NY) [20]. To minimize the static power consumption, a CMOS analog switch (MAX319, Maxim, Sunnyvale, CA) controls the operation of the AWA by changing the gate voltage. The analog switch reads the trigger signal coming from the motor position interpreter. The RF MOSFET is active for 11 µs and is off when the voltage level of the trigger signal is 0 V. For this reason, the AWA does not require a cooling fan, which might be a noise source in many applications. Fig. 4 shows the schematics of the implemented AWA. The bandwidth of the AWA is estimated by applying 400-cycle sine bursts of 2 Vpp with the frequency swept from 1 to 120 MHz in 5-MHz increments to the input port and the output voltage level is recorded by an oscilloscope (LC534, LeCroy Corp., Chestnut Ridge, NY) with a 30-dB attenuator (HAT-30+, Mini-Circuits, Brooklyn, NY). Fig. 5 shows the gain distribution. The estimated −6-dB bandwidth is from 1 to 70 MHz. The average gain is 30 dB and the output voltage level at 40 MHz is 78 Vpp when an input voltage level is 2 Vpp. The SNR can be estimated from
| (1) |
where σ is a standard deviation and abs is the absolute value function.
Fig. 4.
Schematics of the broadband high-frequency arbitrary waveform amplifier.
Fig. 5.
Gain distribution of the arbitrary waveform versus frequency.
Without connecting the function generator to the input of the AWA, the noise signal is recorded using an oscilloscope (LC534, LeCroy Corp.). The calculated standard deviation of the noise level is 1.53 mV, offering an SNR of 94 dB at 40 MHz at the 2 Vpp input voltage level. In the calculation of the SNR, the noise level from the oscilloscope, which is 0.17 mV, is ignored.
B. Arbitrary Waveform Generator (AWG)
The AWG and the motor position interpreter are implemented in a field-programmable gate array (FPGA; Spartan-3E, Xilinx, San Jose, CA) via a 150-MHz clock. Arbitrary waveforms are generated by Matlab (Matlab R2010b, The MathWorks Inc., Natick, MA) and digitized using 12 bits. The generated waveforms are hard-coded in the VHDL code. During scanning, one of the 8 types of transmit waveforms can be chosen using the 3-bit switch on the AWG board.
The motor position interpreter programmed in the same FPGA of the AWG generates 100 trigger pulses during the rising slope of the motor position signal. The trigger signal of 11 µs width is sent to the AWA. The pulse repetition rate (PRF) is selectable between 37 and 45 kHz using a 1-bit switch in the FPGA board depending on the depth of interest. Once the analog switch is turned on by the trigger signal, the AWA is functional after a rising time of 9 µs caused by the capacitances C0 and C1 in the schematics. Therefore, the trigger pulsing time for the AWG and the receiver are delayed by this time duration. At the rising edge of the delayed trigger signal, the digital receiver starts to gather the echo data and the AWG sends a transmit waveform to a digital-to-analog converter (DAC). The DAC (AD9753, Analog Devices) operates with the synchronized clock from the FPGA board at 150 MHz. The output of the DAC is pre-amplified by 14 dB with a low noise op-amp (AD8099, Analog Devices). The amplified signal is directly connected to the AWA board through a connector (FX2–20P, Hirose Electric Co. Ltd., Tokyo, Japan).
C. System Integration
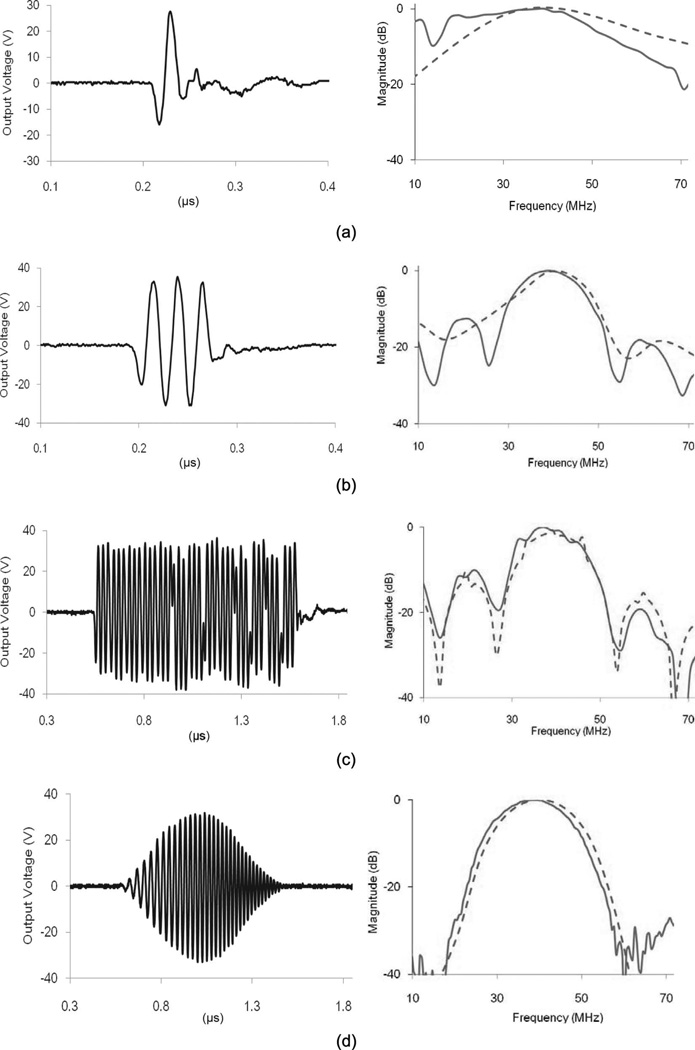
Fig. 6 shows the integrated front-end system. The most important factor in fabricating the stand-alone system is the ground plane. The ground of each module is in contact with the surface of the aluminum frame to prevent ground loop noise. Two power supplies are also included in the system box. The 40-V dc power supply (HB48–0.5-A+G, SL Industries. Inc., Oxnard, CA) is for operating the AWA. The ATX power supply (FA-250N16, Tiger Power, Taipei, Taiwan) is for the other modules. The ground surface of each supply is sanded with sand paper to expose a metal conductor and the module is fixed to the system. After system implementation, arbitrary waveforms were programmed and the output signals were acquired; see Fig. 7. The output signals are recorded using an oscilloscope (LC534, LeCroy Corp.) and a 30-dB attenuator (HAT-30+, Mini-Circuits, Brooklyn, NY) interconnects the output port. The test waveforms are a 40-MHz single-cycle sine burst, a 40-MHz three-cycle sine burst, a 13-bit Barker code, and a 1-µs-long Hanning windowed chirp sweeping from 20 to 60 MHz. The Hanning windowed chirp is generated by
| (2) |
where fi is the lowest frequency of chirp, α is rate of frequency increase, t is time, and WHanning is a Hanning window. In Fig. 7, in the frequency domain, the solid lines are the output signal and the dashed lines are the ideal signal digitized at a 1 GHz sampling rate.
Fig. 6.
Photograph of the implemented system.
Fig. 7.
Arbitrary output waveform of (a) a 40-MHz single cycle, (b) a 40-MHz three-cycle sine burst, (c) a 13-bit Barker code, and (d) a 1-µs-long Hanning windowed chirp sweeping from 20 to 60 MHz in the time domain (left) and frequency domain (right). Solid lines are measured values and dashed lines are ideal waveforms digitized with a 1-GHz sampling rate.
III. Ultrasound Performance Measurements
To evaluate the performance of the integrated system, both phantom studies and small animal imaging experiments were carried out. Lightweight lithium niobate (LiNbO3) 40-MHz single-element transducers were used for imaging. The 3-mm-diameter transducers were press focused at depths of 4, 6, and 12 mm. The properties of these transducers are listed in Table I. Before starting the measurements, eight waveforms are programmed to switch among transmission types in real time. Table II shows the programmed transmission types. Depending on the third bit in the waveform type, the center frequency of the transmission is selected to be either 40 or 50 MHz. A closer examination of the output waveforms in Fig. 7 shows that the single-cycle burst does not give the maximum peak-to-peak output voltage level and the spectra are shifted to lower frequencies than the three-cycle sinusoidal burst because the bandwidth of the AWA is limited as shown in Fig. 5. Therefore, a two-cycle sine burst is adopted as the shortest waveform. The length of the chirp is limited to 2 µs for a type-1 transducer, otherwise the near field cannot be imaged. The application of Hanning window is expected to reduce the range side lobes in the echo [21].
TABLE I.
The Transducer Types Used in the Ultrasound Imaging.
| Transducer type |
Frequency (MHz) |
Diameter (mm) |
F-number | Bandwidth (%) |
|---|---|---|---|---|
| 1 | 39 | 3 | 1.33 | 76 |
| 2 | 39 | 3 | 2 | 66 |
| 3 | 35 | 3 | 4 | 62 |
TABLE II.
The Programmed Waveform Types.
| Waveform (MSB–LSB)* |
Waveform type | Waveform (MSB–LSB) |
Waveform type |
|---|---|---|---|
| 000 | 40-MHz two-cycle sine burst | 100 | 50-MHz two-cycle sine burst |
| 001 | 40-MHz three-cycle sine burst | 101 | 50-MHz three-cycle sine burst |
| 010 | 1-µs Hanning windowed chirp (20 to 60 MHz) | 110 | 1-µs Hanning windowed chirp (25 to 75 MHz) |
| 011 | 2-µs Hanning windowed chirp (20 to 60 MHz) | 111 | 2-µs Hanning windowed chirp (25 to 75 MHz) |
MSB and LSB are the most and the least significant bit, respectively.
The PRF for the 4- and 6-mm focal depths is 45 kHz and the PRF for the 12-mm focal depth is 37 kHz. For a comparison between the two-cycle and the chirp-coded excitation, the transmission voltage is kept constant at 90 Vpp. and the output voltage level is confirmed with an oscilloscope (LC534, LeCroy Corp.).
A. Wire Phantom and Sphere Phantom
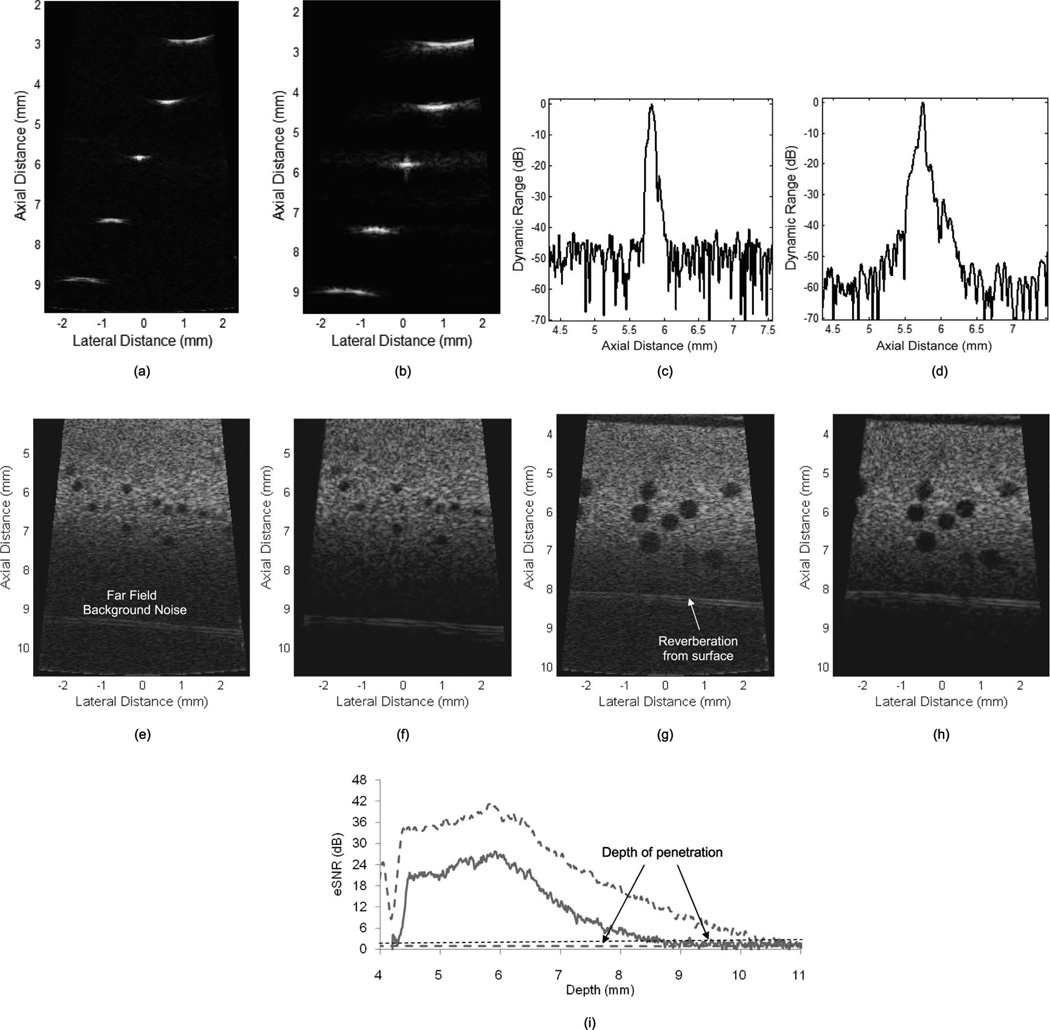
A wire phantom consisting of five wires is immersed in a small water tank filled with de-ionized water (DI water). Thin wires (20 µm diameter) are diagonally aligned, with axial and lateral spacing of 1.5 and 0.65 mm, respectively. The transducer is also placed in the water, scanning the target from the top. The axial distance from the transducer to the target is adjusted to place the center wire at the fixed focal point of the single-element transducer. From the acquired wire target images, the eSNR is analyzed using [22]
| (3) |
where σ is a standard deviation and abs is the absolute value function. To measure the eSNR, a noise image frame is acquired using 0 Vpp transmission. To acquire the background noise, additional imaging frames are saved after setting the transmit voltage to 0 V by programming the AWG. eSNR is presented in the decibel scale. The range side lobe (which is the second-highest lobe next to the main lobe in the axial direction) in the wire target image using the chirp was measured and compared with the ideal value. When the 1-µs-long Hanning windowed chirp is compressed using the matched filter, the ideal level of the range side lobe is −46 dB.
A high-frequency imaging phantom [23] is used for evaluating the developed system. Many anechoic spheres are randomly distributed into a tissue-mimicking material which consists of a mixture of a high-grade agarose (A4679, Sigma-Aldrich Corporation, St. Louis, MO), a preservative (Liquid Germall Plus, International Specialty Products, Wayne, NJ), propylene glycol (P355, Fisher Scientific, Pittsburgh, PA), whole bovine milk, and glass beads of 3.5 µm diameter [23]. The acoustic velocity is 1540 m/s and the attenuation coefficient is α = 0.14 dB·cm−1·MHz−1.39. DI water fills a chamber on top of the sphere phantom and a transducer is placed in the water to scan spheres of 300 µm in diameter in the phantom. The contrast resolution of anechoic objects can be quantified by the clutter-energy–to–total energy ratio (CTR) which is the difference of the average brightness between the inside and the outside of the sphere. The CTR can be calculated using [22]
| (4) |
where AvgOut is the mean brightness of the background and AvgIn is the mean brightness inside the sphere. Depth of penetration is defined as the depth at which eSNR drops below 6 dB. For this purpose, the tissue phantom without anechoic spheres is utilized and eSNR at every depth is calculated using (3).
B. Small Animal Experiment
Zebrafish and mouse scans are performed with protocols approved by the Institutional Animal Care and Use Committee (IAC UC) at the University of Southern California. An adult zebrafish is anesthetized by placing in 0.08% tricaine solution (MS-222, Ethyl 3-aminobenzoate methanesulfonate salt; Sigma-Aldrich, St. Louis, MO) for 30 s, followed by removing scales around the heart of the fish. After the treatments, the fish is immersed in 0.04% tricaine solution directing the ventral side to the top at room temperature. A 4-wk-old mouse of is anesthetized with pentobarbital sodium diluted in saline. The chest of the mouse is shaved with a hair remover (Nair, Church and Dwight Co. Inc., Princeton, NJ) to minimize acoustic energy loss. The prepared mouse is laid on a wooden bed and the bed is placed on a stage which can be moved in the lateral and axial directions to change the scanning location. The transducer is covered by a Tegaderm transparent dressing (3M, St. Paul, MN) and ultrasonic gel is generously spread on the surface of the dressing to couple the transducer to the mouse skin. A heat lamp is used to maintain the body temperature of the mouse.
IV. Results
The images of wire targets are shown in Fig. 8. Fig. 8(a) is acquired from a two-cycle sine burst and Fig. 8(b) from a 2-µs-long Hanning-windowed chirp. The center frequencies of the two transmissions are both 40 MHz; the chirp sweeps from 20 to 60 MHz. These two images are shown in a logarithmic scale with a 60 dB dynamic range. The depth scale is presented in millimeters, calculated based on an ultrasound propagation velocity of 1540 m/s. The width of the image is also in millimeters. For the two-cycle sine burst, the eSNR calculated using (3) is 55 dB, and for the windowed chirp it is 66 dB. The −6-dB axial resolution of the short pulse is 75 µm and the lateral resolution is 120 µm. In the windowed chirp-coded image, the axial and lateral resolutions are 50 and 128 µm, respectively. Figs. 8(c) and 8(d) show the brightness distribution of the center wire-target image along the axial direction in decibels. The range side lobe level is −16 dB, which is higher than the theoretical value, probably because of the limited bandwidths and phase distortion of the transducer and the AWA.
Fig. 8.
The results of phantom studies. Wire-target images using (a) 40-MHz two-cycle sine burst and (b) 1-µs windowed chirp sweeping from 20 to 60 MHz. The axial brightness profile of the wire-target image using (c) 40-MHz two-cycle sine burst and (d) 1-µs windowed chirp sweeping from 20 to 60 MHz. 300-µm sphere phantom images using (e) 40-MHz two-cycle sine burst and (f) 2-µs windowed chirp sweeping from 20 to 60 MHz. 800-µm sphere phantom images using (g) 40-MHz two-cycle sine burst and (h) 2-µs windowed chirp sweeping from 20 to 60 MHz. The images are acquired using a type-2 transducer. (i) eSNR profiles in depth. The dashed line was acquired from coded excitation and the solid line was acquired from a two-cycle sine burst.
Figs. 8(e)–8(h) are sphere phantom images. These four images are presented with a 60 dB dynamic range to allow a comparison of the eSNR between the two different types of transmissions. Note that the maximum value is fixed by the highest bit of the ADC. Spheres of two sizes, 300 µm [Figs. 8(e) and 8(f)] and 800 µm [Figs. 8(g) and 8(h)], are identified near the focal depth of 6 mm. In these figures, smaller background noise in the far field is readily apparent for the chirp-coded excitation image than the two-cycle burst image. CTR is measured for all of the spheres near the focal zone and average values are provided in Table III. Utilizing coded excitation, CTR is enhanced by 10 dB for the 800-µm spheres, and 2 dB for the 300-µm spheres. The wire-target measurements show that high range side lobes of the chirp-coded excitation reduce CTR for the smaller spheres.
TABLE III.
Clutter Energy to Total Energy Ratio (CTR) Values for Different Imaging Methods and Sphere Sizes.
| Imaging method | Coded excitation |
Two-cycle burst |
Coded excitation |
Two-cycle burst |
|---|---|---|---|---|
| Sphere size (µm) | 300 | 300 | 800 | 800 |
| CTR (dB) | 13.5 | 11.6 | 24.0 | 14.9 |
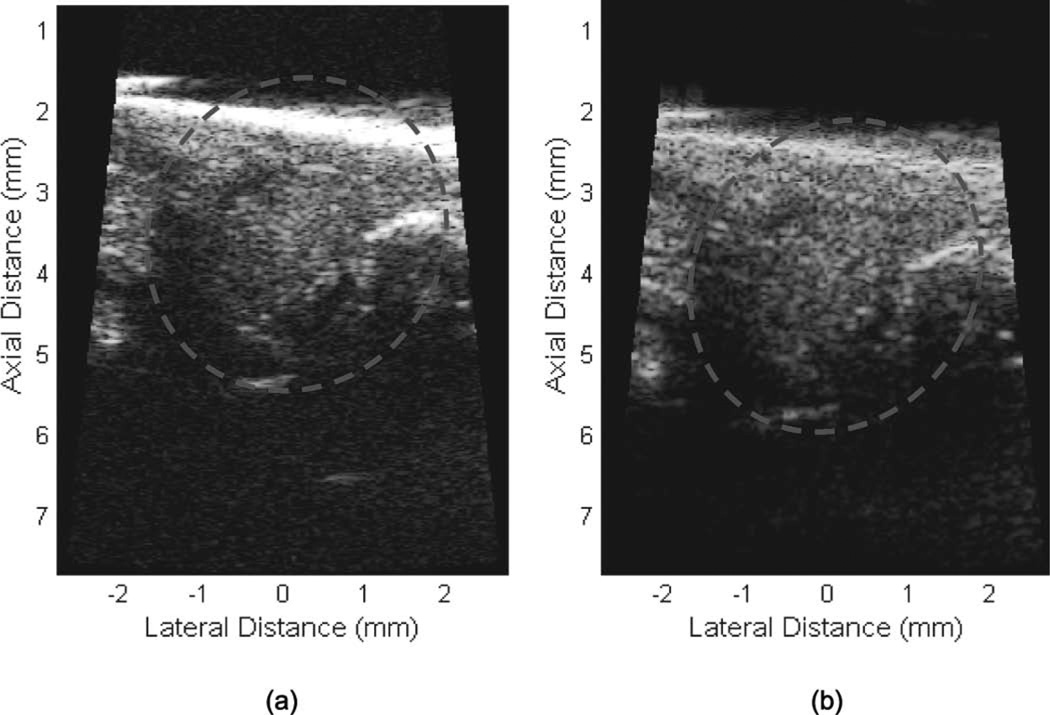
Fig. 8(i) shows eSNR distribution as a function of depth acquired from the tissue phantom study. The estimated depths of penetration from the measurements are 7.7 and 9.5 mm for the two-cycle sine burst and the chirp-coded excitation, respectively. As a result, the depth of penetration is enhanced by 1.8 mm by using the coded excitation method. Fig. 9 shows zebrafish heart images acquired by a type-1 transducer transmitting the waveform types 100 and 110 in Table II. In both images, boundaries of the heart can be identified and the background noise is reduced in the coded-excitation image. The acquisition frame rate is 68 fps and heart beating can be identified through the cine files for the short burst ( ) and the coded excitation (
 ).
).
Fig. 9.
Zebrafish images using (a) a 50-MHz two-cycle sine burst and (b) a 1-µs windowed chirp sweeping from 25 to 75 MHz. All the exciting voltage level is 90 Vpp. The hearts are located inside the dashed circles.
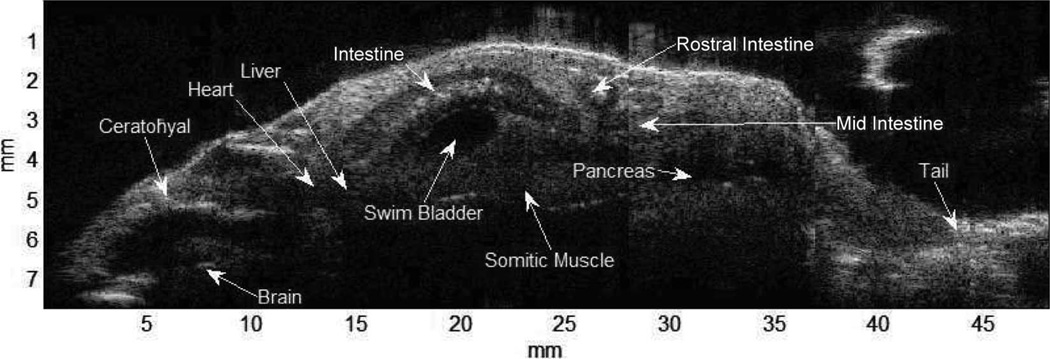
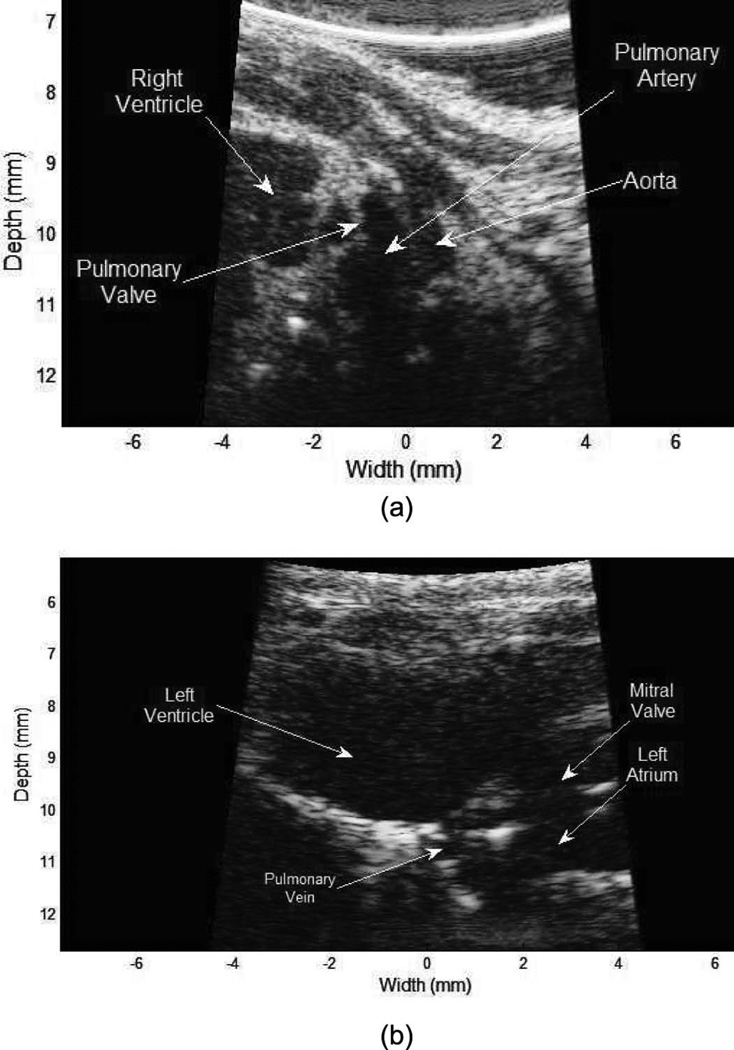
The images in Fig. 10 were acquired using the waveform type 011 and a type-2 transducer. Fig. 10 shows the whole-body view of a zebrafish. A total of 7 frames were acquired by moving the fish from the head to the tail on the ventral side. After the acquisition, the echo data of the 7 frames were stitched together to form a sagittal view of the whole fish. Chirp-coded excitation can image the ventral side of the fish without compromising resolution. In the image, internal organs are visualized and their locations can be identified by comparing with optical tomography images [24]. Fig. 11 shows the mouse heart at different viewing angles using a type-3 transducer excited by the waveform type of 011. Fig. 11(a) shows the pulmonary artery (PA) and a valve in the right ventricular chamber. Fig. 11(b) shows left atrium and ventricle with the pulmonary vein (PV). During scanning, the frame rate is 68 Hz and pulse repetition rate is 37 kHz.
Fig. 10.
Whole-body scan of a zebrafish; images were acquired using a windowed chirp-coded excitation.
Fig. 11.
Mouse heart images using a windowed chirp-coded excitation: (a) pulmonary artery and valve connecting the right ventricle, and (b) left ventricle and atrium with pulmonary vein.
V. Discussion
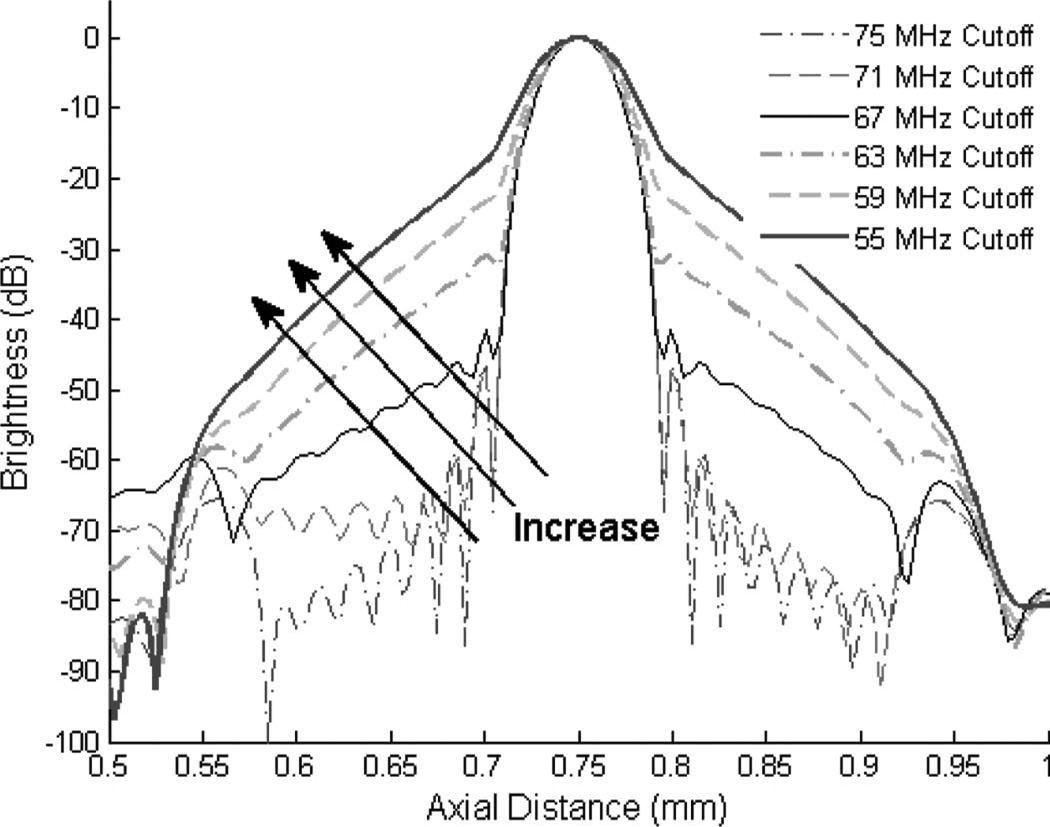
Fig. 9 shows images acquired with 50-MHz transmissions. The background noise in the image acquired by the coded excitation is reduced compared with the two-cycle sine burst, whereas the speckle size becomes enlarged. The increase of speckle size may be caused by the limited bandwidth of the 40-MHz transducer, which is 76%, as shown in Table I. In the wire target study shown in Fig. 8, the axial resolution of coded excitation under −20 dB is worse than that of the two-cycle sinusoidal burst. The limited bandwidth can distort the spectrum of the echo signals and the application of a matched filter may cause elevated range side lobe levels. A simulation using Matlab programming verifies the effects of the reduced bandwidth on the level of range side lobe and the spatial resolution. A 1-µs-long Hanning windowed chirped burst (25 to 75 MHz) is filtered with a linear phase band-pass filter and the filtered burst is convolved with the original time-inversed chirped pulse. To simulate the limited bandwidth of the utilized transducer and the implemented system, the highest cutoff frequency of the band-pass filter is decreased gradually from 75 MHz in 4-MHz steps. Fig. 12 shows the compressed signals, changing the cutoff frequency of the band-pass filter. As the cutoff frequencies are reduced from 75 to 55 MHz, the level of range side lobe is increased from −46 to −20 dB. For this reason, the −6-dB axial resolution is estimated to be increased from 40 to 50 µm with the application of a band-pass filter with a 55 MHz cutoff frequency.
Fig. 12.
Bandwidth reduction effects on the compressed chirped burst with a matched filter.
In Fig. 7(d), the center frequency of chirped burst for a transmission is shifted from 40 to 39 MHz. For the 50-MHz transmitted waveform, the center frequency shift may be more than 1 MHz, limited by the AWA bandwidth. Nevertheless, the bandwidth of the AWA is still greater than the 50-MHz chirp. Therefore, using the 50-MHz transducer will enhance the spatial resolution of the current system. Another method to enhance the spatial resolution is the use of tissue harmonic imaging [25]. The bandwidth of the receiver in the system is 95 MHz, in contrast to 70 MHz for the transmitter. Therefore, it appears that this system may be utilized for high-frequency coded tissue harmonic imaging.
In Fig. 9 and Fig. 11, the designed system achieves a maximum of 70 fps via one-way scan, allowing adequate imaging of zebrafish and mouse hearts. However, implementation of a two-way scan operation in the post-processing block would be more helpful to investigate cardiac functions in detail.
VI. Conclusions
A stand-alone front-end system for high-frequency coded excitation imaging has been implemented. Results obtained from wire-target and sphere-phantom measurements demonstrate that the custom-designed arbitrary waveform transmitter and the low-noise analog receiver are capable of achieving a reduced noise level and a high dynamic range. The system is suitable for not only high-frequency but also high-frame-rate imaging. Further, it is demonstrated that chirp-coded excitation enhances the penetration depth with a minimal sacrifice of spatial resolution.
Acknowledgments
This work has been supported by National Institutes of Health (NIH) grants R01-HL79976 and P41-EB2182.
Biographies

Jinhyoung Park received his B.Sc. degree in astronomy, and his M.S. degree in biomedical engineering from Seoul National University, Seoul, Korea, in 2002 and 2004, respectively. Since 2008, he has been pursuing his Ph.D. degree in biomedical engineering from University of Southern California, Los Angeles, CA.
He served as a principal engineer of the acoustic team at SIEMENS Ultrasound Group, Korea, from 2004 to 2008, where he performed image optimization and algorithm development for four product lines. His research interests include high-frequency coded excitation imaging systems and their application to small animals.

Changhong Hu received his B.S. degree in biomedical engineering from Xi’an Jiaotong University in 1995, Xi’an, Shannxi, P. R. China; his M.S. degree in bioengineering from The Pennsylvania State University, University Park, PA, in 2002; and his Ph.D degree in biomedical engineering from the University of Southern California, Los Angeles, CA, in 2005. He worked as a Research Associate and Research Assistant Professor in the Biomedical Engineering Department, University of Southern California, from 2006 to 2010. He was working on the development of high-frequency ultrasound imaging systems/electronics and digital signal processing. He is currently working at Philips Inc. as an engineer.

K. Kirk Shung obtained a B.S. degree in electrical engineering from Cheng-Kung University in Taiwan in 1968; an M.S. degree in electrical engineering from the University of Missouri, Columbia, MO, in 1970; and a Ph.D. degree in electrical engineering from the University of Washington, Seattle, WA, in 1975. He taught at The Pennsylvania State University, University Park, PA, for 23 years before moving to the Department of Biomedical Engineering, University of Southern California, Los Angeles, CA, as a professor in 2002. He has been the director of the NIH Resource on Medical Ultrasonic Transducer Technology since 1997.
Dr. Shung is a life fellow of IEEE and a fellow of the Acoustical Society of America and the American Institute of Ultrasound in Medicine. He is a founding fellow of American Institute of Medical and Biological Engineering. He received the IEEE Engineering in Medicine and Biology Society Early Career Award in 1985 and was the co-author of a paper that received the best paper award for the IEEE Transactions on Ultrasonics, Ferroelectrics and Frequency Control (UFFC) in 2000. He was elected an outstanding alumnus of Cheng-Kung University in Taiwan in 2001. He was selected as the distinguished lecturer for the IEEE UFFC society for 2002–2003. He received the Holmes Pioneer Award in Basic Science from the American Institute of Ultrasound in Medicine in 2010. He was selected to receive the academic career achievement award from the IEEE Engineering in Medicine and Biology Society in 2011.
Dr. Shung has published more than 400 papers and book chapters. He is the author of the textbook Principles of Medical Imaging, published by Academic Press in 1992, and the textbook Diagnostic Ultrasound: Imaging and Blood Flow Measurements, published by CRC Press in 2005. He co-edited a book Ultrasonic Scattering by Biological Tissues, published by CRC Press in 1993. Dr. Shung’s research interest is in ultrasonic transducers, high-frequency ultrasonic imaging, ultrasound microbeams, and ultrasonic scattering in tissues.
References
- 1.Shung Kk. Diagnostic Ultrasound: Imaging and Blood Flow Measurements. Boca Raton, FL: CRC Press; 2006. [Google Scholar]
- 2.Misaridis T, Jensen JA. Use of modulated excitation signals in medical ultrasound. Part I: Basic concepts and expected benefits. IEEE Trans. Ultrason. Ferroelectr. Freq. Control. 2005;vol. 52(no. 2):177–191. doi: 10.1109/tuffc.2005.1406545. [DOI] [PubMed] [Google Scholar]
- 3.Misaridis TX, Pedersen MH, Jensen JA. Clinical use and evaluation of coded excitation in B-mode images. IEEE Ultrasound Symp. 2000;vol. 2:1689–1693. [Google Scholar]
- 4.O’Donnell M. Coded excitation system for improving the penetration of real-time phased-array imaging systems. IEEE Trans. Ultrason. Ferroelectr. Freq. Control. 1992;vol. 39(no. 3):341–351. doi: 10.1109/58.143168. [DOI] [PubMed] [Google Scholar]
- 5.Chiao RY, Xiaohui H. Coded excitation for diagnostic ultrasound: A system developer’s perspective. IEEE Trans. Ultrason. Ferroelectr. Freq. Control. 2005;vol. 52(no. 2):160–170. doi: 10.1109/tuffc.2005.1406543. [DOI] [PubMed] [Google Scholar]
- 6.Xu X, Yen JT, Shung KK. A low-cost bipolar pulse generator for high-frequency ultrasound applications. IEEE Trans. Ultrason. Ferroelectr. Freq. Control. 2007;vol. 54(no. 2):443–447. doi: 10.1109/tuffc.2007.259. [DOI] [PubMed] [Google Scholar]
- 7.Barker RH. Group synchronization of binary digital systems. In: Jackson W, editor. Communication Theory. New York, NY: Academic; pp. 273–287. [Google Scholar]
- 8.Rihaczek AW, Golden RM. Range sidelobe suppression for Barker codes. IEEE Trans. Aerosp. Electron. Syst. 1971;vol. AES-7(no. 6):1087–1092. [Google Scholar]
- 9.Hu CH, Liu R, Zhou Q, Yen J, Shung KK. Coded excitation using biphase-coded pulse with mismatched filters for high frequency ultrasound imaging. Ultrasonics. 2006;vol. 44:330–336. doi: 10.1016/j.ultras.2006.04.002. [DOI] [PubMed] [Google Scholar]
- 10.Misaridis T, Jensen JA. Use of modulated excitation signals in medical ultrasound. Part II: Design and performance for medical imaging applications. IEEE Trans. Ultrason. Ferroelectr. Freq. Control. 2005;vol. 52(no. 2):192–207. doi: 10.1109/tuffc.2005.1406546. [DOI] [PubMed] [Google Scholar]
- 11.Foster FS, Palvlin CJ, Harasiewicz KA, Christopher DA, Turnbull DH. Advances in ultrasound biomicroscopy. Ultrasound Med. Biol. 2000;vol. 26(no. 1):1–27. doi: 10.1016/s0301-5629(99)00096-4. [DOI] [PubMed] [Google Scholar]
- 12.Sun L, Richard WD, Cannata MC, Feng CC, Johnson JA, Yen JT, Shung KK. A high-frame rate high-frequency ultrasonic system for cardiac imaging in mice. IEEE Trans. Ultrason. Ferroelectr. Freq. Control. 2007;vol. 54(no. 8):1648–1655. doi: 10.1109/tuffc.2007.436. [DOI] [PubMed] [Google Scholar]
- 13.Misaridis T, Jensen JA. Use of modulation excitation signals in medical ultrasound. Part 1: Basic concepts and expected benefits. IEEE Trans. Ultrason. Ferroelectr. Freq. Control. 2005;vol. 52(no. 2):177–191. doi: 10.1109/tuffc.2005.1406545. [DOI] [PubMed] [Google Scholar]
- 14.Passmann C, Ermert H. A 100-MHz ultrasound imaging system for dermatologic and ophthalmologic diagnostics. IEEE Trans. Ultrason. Ferroelectr. Freq. Control. 1996;vol. 43(no. 4):545–552. [Google Scholar]
- 15.Bosisio MR, Hasquenoph JM, Sandrin L, Laugier P, Bridal SL, Yon S. Real-time chirp-coded imaging with a programmable ultrasound biomicroscope. IEEE Trans. Biomed. Eng. 2010;vol. 57(no. 3):654–664. doi: 10.1109/TBME.2009.2033036. [DOI] [PubMed] [Google Scholar]
- 16.Liu J, Jeng G, Wu T, Li PC. ECG triggering and gating for ultrasound small animal imaging. IEEE Trans. Ultrason. Ferroelectr. Freq. Control. 2006;vol. 53(no. 9):1590–1596. doi: 10.1109/tuffc.2006.1678187. [DOI] [PubMed] [Google Scholar]
- 17.Lewandowski M, Nowicki A. High frequency coded imaging system with RF software signal processing. IEEE Trans. Ultrason. Ferroelectr. Freq. Control. 2008;vol. 55(no. 8):1878–1882. doi: 10.1109/TUFFC.2008.871. [DOI] [PubMed] [Google Scholar]
- 18.Xu X, Yen JT, Shung KK. A low-cost bipolar pulse generator for high-frequency ultrasound applications. IEEE Trans. Ultrason. Ferroelectr. Freq. Control. 2007;vol. 54(no. 2):443–447. doi: 10.1109/tuffc.2007.259. [DOI] [PubMed] [Google Scholar]
- 19.Atchison W. Impact of measurement system noise figure and gain on emission measurements above 1 GHz. IEEE Int. Symp. Electromagnetic Compatibility. 2003;vol. 1(no. 18–22):353–356. [Google Scholar]
- 20.Trask C. Designing wide-band transformers for HF and VHF power amplifiers. QEX. 2005 Mar-Apr;:2–15. [Google Scholar]
- 21.Kanagaratnam P, Gogineni SP, Ramasami V, Braaten D. A wideband radar for high-resolution mapping of near-surface internal layers in glacial ice. IEEE Trans. Geosci. Rem. Sens. 2005;vol. 42(no. 3):483–490. [Google Scholar]
- 22.Üstüner KF, Holley GL. Ultrasound imaging system performance assessment. presented at the American Association of Physicists in Medicine Annu. Meeting; Aug. 2003; San Diego, CA. [Google Scholar]
- 23.Madsen EL, Frank GR, McCormick MM, Deaner ME, Stiles TA. Anechoic sphere phantoms for estimating 3-D resolution of very-high-frequency ultrasound scanners. IEEE Trans. Ultrason. Ferroelectr. Freq. Control. 2010;vol. 57(no. 10):2284–2292. doi: 10.1109/TUFFC.2010.1689. [DOI] [PMC free article] [PubMed] [Google Scholar]
- 24.Bryson-Richardson RJ, Berger S, Schilling TF, Hall TE, Cole NJ, Gibson AJ, Sharpe J, Currie PD. FishNet: An online database of zebrafish anatomy. BMC Biol. 2007;vol. 5(art. no. 34) doi: 10.1186/1741-7007-5-34. [DOI] [PMC free article] [PubMed] [Google Scholar]
- 25.Shapiro RS, Wagreich J, Parsons RB, Stancato-Pasik A, Yeh HC, Lao R. Tissue harmonic imaging sonography: Evaluation of image quality compared with conventional sonography. AJR Am. J. Roentgenol. 1998;vol. 171(no. 5):1203–1206. doi: 10.2214/ajr.171.5.9798848. [DOI] [PubMed] [Google Scholar]


