

Abstract
Hypomyelination is observed in the context of a growing number of genetic disorders that share clinical characteristics. The aim of this study was to determine the possible role of magnetic resonance imaging pattern recognition in distinguishing different hypomyelinating disorders, which would facilitate the diagnostic process. Only patients with hypomyelination of known cause were included in this retrospective study. A total of 112 patients with Pelizaeus–Merzbacher disease, hypomyelination with congenital cataract, hypomyelination with hypogonadotropic hypogonadism and hypodontia, Pelizaeus–Merzbacher-like disease, infantile GM1 and GM2 gangliosidosis, Salla disease and fucosidosis were included. The brain scans were rated using a standard scoring list; the raters were blinded to the diagnoses. Grouping of the patients was based on cluster analysis. Ten clusters of patients with similar magnetic resonance imaging abnormalities were identified. The most important discriminating items were early cerebellar atrophy, homogeneity of the white matter signal on T2-weighted images, abnormal signal intensity of the basal ganglia, signal abnormalities in the pons and additional T2 lesions in the deep white matter. Eight clusters each represented mainly a single disorder (i.e. Pelizaeus–Merzbacher disease, hypomyelination with congenital cataract, hypomyelination with hypogonadotropic hypogonadism and hypodontia, infantile GM1 and GM2 gangliosidosis, Pelizaeus–Merzbacher-like disease and fucosidosis); only two clusters contained multiple diseases. Pelizaeus–Merzbacher-like disease was divided between two clusters and Salla disease did not cluster at all. This study shows that it is possible to separate patients with hypomyelination disorders of known cause in clusters based on magnetic resonance imaging abnormalities alone. In most cases of Pelizaeus–Merzbacher disease, hypomyelination with congenital cataract, hypomyelination with hypogonadotropic hypogonadism and hypodontia, Pelizaeus–Merzbacher-like disease, infantile GM1 and GM2 gangliosidosis and fucosidosis, the imaging pattern gives clues for the diagnosis.
Keywords: magnetic resonance imaging, leukodystrophy, hypomyelination, pattern recognition
Introduction
Hypomyelination refers to a permanent, substantial deficit in myelin deposition in the brain. Numerous disorders are characterized by hypomyelination. Pelizaeus–Merzbacher disease (PMD) is the prototypic hypomyelinating disorder that was described at the end of the 19th century (Pelizaeus, 1885; Merzbacher, 1910). It is an X-linked recessive disease caused by rearrangements or mutations in the gene encoding proteolipid protein 1, PLP1 (Gencic et al., 1989; Hudson et al., 1989), a major component of myelin in the central nervous system. MRI allows in vivo diagnosis of hypomyelination. Unmyelinated white matter, as present in neonates, has a long T1 and T2, resulting in low signal intensity on T1-weighted images (referred to as T1 signal) and high signal intensity on T2-weighted images (referred to as T2 signal) (Barkovich et al., 1988; Barkovich, 2000). With myelin deposition, T1 and T2 shorten. Fully myelinated white matter has high T1 signal and low T2 signal. The T1 shortening occurs before T2 shortening and is more prominent (Barkovich et al., 1988; Barkovich, 2000). Consequently, deposition of some myelin may result in low, intermediate or high T1 signal of the white matter, depending on the amount of myelin deposited, whereas the white matter signal is still high on T2-weighted images (Schiffmann and van der Knaap, 2009). This constellation of T1 and T2 signal intensities is seen midway in the process of normal myelination (Barkovich et al., 1988; Barkovich, 2000) and also in hypomyelinating disorders (Schiffmann and van der Knaap, 2009).
It should be noted that the T1 and T2 signals of the white matter during normal myelination and in hypomyelination differ from those observed in demyelination and other lesions. The T2 hypointensity of the white matter is milder in hypomyelination than in demyelination and other white matter lesions. In demyelination and other lesions the T1 signal is invariably low, much lower than the cortex, whereas the T1 signal is mildly hyperintense, isointense or mildly hypointense relative to the cortex in hypomyelination (Schiffmann and van der Knaap, 2009).
The MRI criterion for a diagnosis of hypomyelination is an unchanged pattern of deficient myelination on two successive MRI scans at least 6 months apart. One of the MRI scans should have been obtained at the age of more than 1 year (Schiffmann and van der Knaap, 2009). Experience has taught that if an MRI scan shows severely deficient myelination in a child older than 2 years, it is extremely unlikely that the child will ever acquire a normal amount of myelin and permanent hypomyelination is highly likely (Schiffmann and van der Knaap, 2009). Over the last few decades, several new hypomyelinating disorders and their genetic defects have been identified. They include Salla disease (Sonninen et al., 1999), Cockayne syndrome (Nishio et al. 1988), Tay syndrome (also called trichothiodystrophy with hypersensitivity of the skin to sunlight) (Østergaard and Christensen, 1996), oculodentodigital dysplasia (Gutmann et al., 1991; Loddenkemper et al., 2002), Waardenburg-Hirschsprung syndrome with peripheral neuropathy and central hypomyelination (Inoue et al., 1999, 2002), serine synthesis defects (Jaeken et al., 1996; de Koning et al., 2000), fucosidosis (Provenzale et al., 1995; Galluzzi et al., 2001, Prietsch et al., 2008), 18q− syndrome (Miller et al., 1990, Loevner et al., 1996, Gay et al., 1997), hypomyelination with atrophy of the basal ganglia and cerebellum (HABC) (Van der Knaap et al., 2002), hypomyelination with congenital cataract (HCC) (Zara et al., 2006, Rossi et al., 2008), Pelizaeus–Merzbacher-like disease (PMLD) (Uhlenberg et al., 2004; Bugiani et al., 2006) and hypomyelination with hypogonadotropic hypogonadism and hypodontia (4H syndrome) (Wolf et al., 2005; Timmons et al., 2006). It is important to also realize that neuronal disorders with early infantile onset, like infantile GM1 and GM2 gangliosidosis (Fukumizu et al., 1992; Koelfen et al., 1994; Mugikura et al., 1996, Shen et al., 1998, Lin et al., 2000) can present with hypomyelination on MRI scans (Schiffmann and van der Knaap, 2009). Although the number of well-defined hypomyelinating disorders is rising, hypomyelinating disorders of unknown origin still constitute the largest single category among the unclassified leukoencephalopathies (Van der Knaap et al., 1999).
Clinically, it is not easy to differentiate between the various hypomyelinating disorders. Common neurological findings are development delay, nystagmus, cerebellar ataxia and spasticity. A few hypomyelinating disorders have additional features, such as hypodontia, cataract and prominent extrapyramidal movement abnormalities, which can facilitate the diagnostic process, but these features are neither obligatory nor pathognomonic. It is, therefore, usually not easy to reach a specific diagnosis and often an elaborate diagnostic work-up is performed in patients with an MRI indicative of hypomyelination.
The aim of the present study is to determine whether systematic analysis of MRI scans can identify items that contribute to the differentiation between hypomyelinating disorders.
Materials and methods
This retrospective study received approval of the institutional review board with waiver of informed consent. All MRI scans had been obtained for regular patient care.
Diseases
All MRI scans available to us: (i) fulfilling the definition of hypomyelination as given in the introduction; and (ii) with a known cause for the disease, were considered for inclusion in this study. Of the disorders considered, only PMD, PMLD, 4H syndrome, Salla disease, fucosidosis, HCC, and infantile GM1 and GM2 gangliosidosis were actually included in this study. 18q− Syndrome, Cockayne syndrome and serine synthesis defects were excluded because of their different appearance on MRI scans, i.e. very mild hypomyelination in 18q− syndrome and early serious cerebral atrophy in the latter two diseases. HABC was excluded, because the disease is defined by MRI criteria. Other diseases that were excluded were Tay syndrome, oculodentodigital dysplasia and Waardenburg-Hirschsprung syndrome with polyneuropathy and central hypomyelination, because the number of available MRI scans of patients affected with these three diseases was too small to draw reliable conclusions.
The diagnoses were established based on DNA analysis (PMD, PMLD, HCC, Salla disease), lysosomal enzyme analysis (fucosidosis, GM1 and GM2 gangliosidosis), urinary metabolite analysis (Salla disease) or clinical criteria (4H syndrome).
Patients
MRI scans of 128 patients with hypomyelination and one of the known causes were available. Only patients in whom at least one MRI scan was obtained at the age of ≥12 months were included, because normal myelination is too incomplete within the first year of life to allow a diagnosis of hypomyelination (n = 117). Patients without full series of both T1- and transverse T2-weighted images were excluded (n = 5). Of the remaining 112 patients 62% were male. Diagnoses, patient numbers and ages at MRI are summarized in Table 1.
Table 1.
Disease and patient characteristics
| Disease | Number of patients | % male | Mean age at MRI (years) | Age range at MRI (years) |
|---|---|---|---|---|
| 4H syndrome | 40 | 43 | 9.3 | 1.3–29.6 |
| PMD | 21 | 100 | 4.7 | 1.0–32.9 |
| PMLD | 15 | 67 | 13.8 | 2.0–53.3 |
| HCC | 13 | 69 | 7.1 | 1.6–19.7 |
| GM2 gangliosidosis | 9 | 44 | 1.2 | 1.1–1.4 |
| Salla disease | 8 | 75 | 5.6 | 1.6–16.3 |
| Fucosidosis | 4 | 25 | 5.0 | 1.8–7.5 |
| GM1 gangliosidosis | 2 | 50 | 1.4 | 1.3–1.5 |
Magnetic resonance images and evaluation
The MRI scans had been obtained in various centres and, therefore, different pulse sequences had been used, but T1- and transverse T2-weighted images were available for all patients. Only the first MRI scan of patients after the age of 1 year was rated. The MRI scans were rated by consensus of two investigators as described previously (Van der Knaap et al., 1999) (Table 2). In addition to scoring lesions, the degree of myelination of the white matter structures as estimated by the T1 and T2 signal was assessed (Table 2). White matter lesions were defined as areas of prominent T2 hyperintensity and prominent T1 hypointensity. Hypomyelination itself, leading to mild T2 hyperintensity and variable T1 signal, was not considered a lesion. Atrophy was defined as volume loss leading to enlargement of the ventricles and subarachnoid spaces. Only obvious atrophy was scored as present, equivocal atrophy was scored as absent. The raters were blinded to the diagnoses of the patients.
Table 2.
Anatomic structures and MRI features analysed
| Structure | Subdivision | T2 hyperintensity | T1 hypointensity | True lesion | |
|---|---|---|---|---|---|
| WM | Frontal WM | S/D/P | |||
| Temporal WM | S/D/P | ||||
| Parietal WM | S/D/P | ||||
| Occipital WM | S/D/P | ||||
| Corpus callosum | G/B/S | ||||
| Internal capsule | A/P/pt | ||||
| Cerebellar WM | |||||
| Cerebellar peduncles | S/M/I | ||||
| Midbrain | Specify structure | ||||
| Pons | Specify structure | ||||
| Medulla oblongata | Specify structure | ||||
| Aspect | T2 homogeneity WM | ||||
| GM | Cerebral cortex | ||||
| Thalamus | Specify structure | ||||
| Globus pallidus | |||||
| Caudate nucleus | |||||
| Putamen | |||||
| Dentate nucleus | |||||
| Substantia nigra | |||||
| Other nuclei | Specify structure | ||||
| Cerebellar cortex | |||||
| Atrophy | Cerebral atrophy | ||||
| Cerebellar atrophy |
WM = white matter; GM = grey matter; S/D/P = subcortical/deep/periventricular; G/B/S = genu/body/splenium; A/P/pt = anterior/posterior/pyramidal tract only; S/M/I = superior/middle/inferior.
Bold notation indicates that item is included in the statistical analysis.
Statistical analysis
In order to reduce the number of variables for statistical analysis in view of the relatively small numbers of patients, we omitted MRI items from the scoring list that in our experience had the lowest distinguishing value (Table 2). A two-way approach was used to assess possible differences in MRI abnormalities between disorders, including clustering analysis and multivariate testing.
Clustering analysis
Unsupervised hierarchical clustering of patients on the basis of their MRI item profile was performed. The dendrogram was built using the Hamming distance and complete linkage. The latter analysis results in compact, well-separated clusters. To determine the optimal number of clusters from the resulting dendrogram, two external validation measures (adjusted Rand index and normalized mutual information) were calculated for 2–12 (the largest number considered reasonable) clusters. The number of clusters that resulted in the highest indices was chosen to be optimal (10 clusters). To determine the items that discriminated best between clusters, the maximum pair-wise symmetrized Kullback–Leibler divergence was calculated per item. Items with the highest divergence are most discriminative.
Multivariate testing
Multivariate testing was employed to compare MRI item profiles between two groups of patients. The empirical frequency distribution of the MRI item profiles was calculated for each group. The difference in frequency distributions of the MRI item profiles of both groups was summarized by the generalized divergence (with lambda = −0.5 to accommodate sparsity of the frequency distribution) (Forman, 2003), which was used as test statistic. The null distribution of this test statistic was obtained by permutation of the group labels. Comparison of the observed test statistic to the null distribution yielded the P-value. Because all groups with more than eight patients were compared in a pair-wise fashion, Holm’s correction was applied to correct for multiplicity.
Comparison with hypomyelinating disorders of unknown origin
To test the results of the clustering analysis, MRI scans of 164 patients (mean age 8.2 years; age range 1.0–50.8 years; 60% male) without a known cause for their hypomyelination were reviewed. If MRI abnormalities compatible with one of the identified clusters were found, the referring physician was contacted for information on the latest diagnostic work-up in this patient.
Results
Patient and disease characteristics are summarized in Table 1.
Hierarchical cluster analysis
The dendrogram of the cluster analysis is presented in Supplementary Fig. 1. In Table 3 the MRI abnormalities in the various clusters are summarized.
Table 3.
Clusters and MRI characteristics
 |
|---|
PLIC = posterior limb of the internal capsule; WM = white matter.
a The importance of the various items was calculated by means of the maximum pair-wise symmetrized Kullback–Leibler divergence; items with the highest divergence are most discriminative.
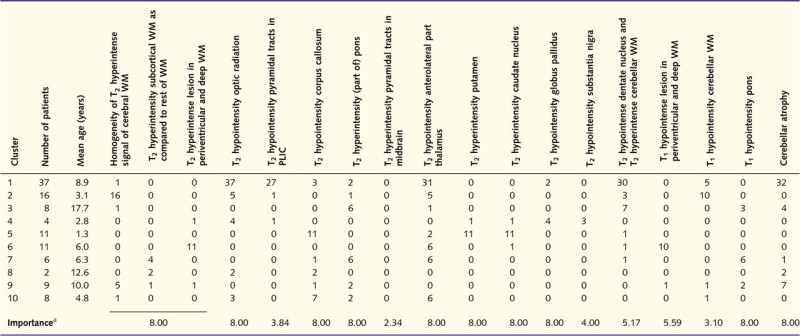
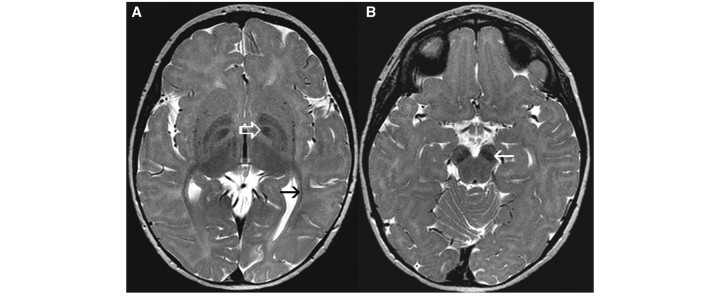
Cluster 1 comprised 37 patients. The MRI scans were characterized by cerebellar atrophy (Fig. 1A), a low T2 signal of the optic radiation (periventricular occipital white matter in Table 2) (Fig. 1B) and a relatively low T2 signal of the anterolateral part of the thalamus (Fig. 1B). For the sake of clarity it should be stressed that a low T2 signal of a white matter structure indicates high myelin content and is in fact normal. The low T2 signal of myelinated structures stands out because the remainder of the white matter has a mild T2 hyperintensity due to lack of myelin. In 19 of 32 patients, cerebellar atrophy was seen before the age of 10 years, whereas in the other 13 patients it was unclear at which age the cerebellar atrophy had developed. The pyramidal tracts in the posterior limb of the internal capsule had a lower T2 signal than the rest of the internal capsule in most patients (Fig. 1B). In all patients, the cerebellar white matter was mildly hyperintense on T2-weighted images, and the dentate nucleus, therefore, stood out as dark.
Figure 1.
MRI of a 6-year-old male with 4H syndrome. The sagittal T1-weighted image shows cerebellar atrophy (A). The axial T2-weighted image (B) shows relatively lower signal of the anterolateral part of the thalamus (white arrow), pyramidal tract at the level of the posterior limb of the internal capsule (black arrow) and the optic radiation (white open arrow).
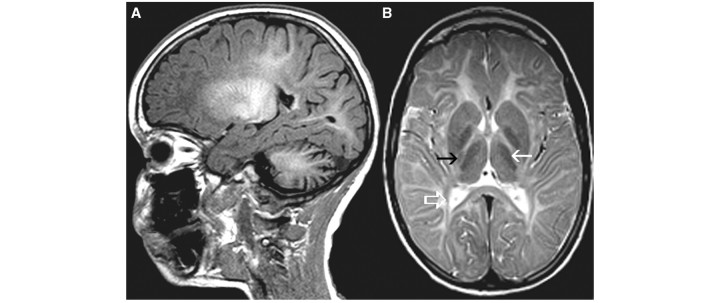
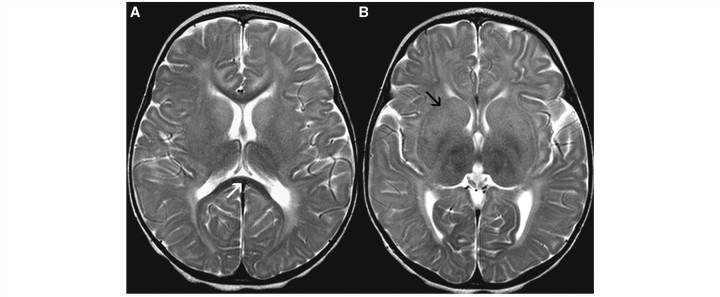
Cluster 2 consisted of 16 patients with a strikingly homogeneous T2 signal of the cerebral white matter in all patients (Fig. 2A as compared to Fig. 2B). Cerebellar atrophy was not present. The low T2 signal of the pyramidal tracts at the level of the posterior limb of the internal capsule and the anterolateral part of the thalamus, typically seen in Cluster 1, was seen in only a few patients. The cerebellar white matter had a high T2 signal and a low T1 signal in the majority of the patients.
Figure 2.
The axial T2-weighted image in a 1-year-old male with PMD shows a strikingly homogeneous T2 signal intensity of the cerebral white matter (A) as compared to a 5-year-old male with 4H syndrome (B).
Cluster 3 consisted of eight patients. Their MRI scans were mainly characterized by a striking T2 hyperintensity of the pons, involving either the pyramidal tract at this level (three patients) (Fig. 3A) or the entire pons (three patients) (Fig. 3B). The latter three patients also had a striking T1 hypointensity of the pons. The cerebellar white matter had a mild T2 hypointensity with a contrasting dark dentate nucleus in seven patients. Cerebellar atrophy was seen in four patients.
Figure 3.
Axial T2-weighted images of two male patients with PMLD (age 39 years in A, age 6 years in B) at the level of the pons show T2 hyperintensity, either in the pyramidal tracts alone (white arrow, A) or in the entire pons (black arrow, B).
Cluster 4 comprised four patients who displayed a marked T2 hypointensity of the globus pallidus in four patients (Fig. 4A) and of the substantia nigra in three (Fig. 4B). It should be noted that T2 hypointensity of these grey matter structures does not reflect high myelin content; T2 hypointensity of grey matter most likely reflects iron or calcium. The optic radiation was hypointense on T2-weighted images (Fig. 4A), indicating a higher myelin content. Cerebellar atrophy was not present.
Figure 4.
Axial T2-weighted images of a 1-year-old female with fucosidosis demonstrate pronounced T2 hypointensity of the globus pallidus (white open arrow, A) and substantia nigra (white arrow, B). The optic radiation has a lower signal than the adjacent white matter (black arrow, A).
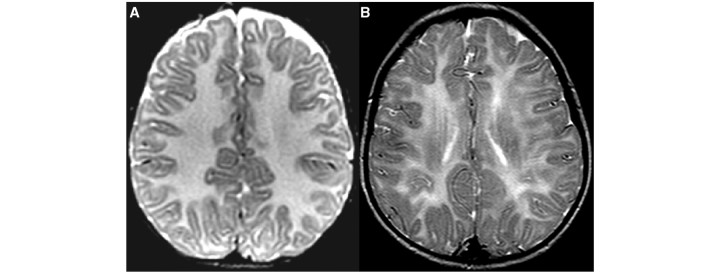
Cluster 5 contained 11 patients. Their MRI scans were characterized by mild T2 hyperintensity of the putamen and caudate nucleus (Fig. 5A and B). Whereas the cerebral hemispheric white matter displayed T2 hyperintensity, the corpus callosum was T2 hypointense in all patients (Fig. 5A). Cerebellar atrophy was not present.
Figure 5.
Axial T2-weighted images of a 1-year-old female with GM2 gangliosidosis display hypointensity of the corpus callosum (white arrow, A) and T2 hyperintensity of the basal ganglia (black arrow, B).
Cluster 6 comprised 11 patients. While the cerebral hemispheric white matter displayed a mild T2 hyperintensity, as expected in hypomyelination, there were additional focal areas of prominent T2 hyperintensity in the periventricular and deep white matter (Fig. 6A) in all patients, associated with T1 hypointensity in the same areas (Fig. 6B) in 10 patients. The anterolateral part of the thalamus had a lower T2 signal than the rest of the thalamus in six patients. No cerebellar atrophy was seen.
Figure 6.
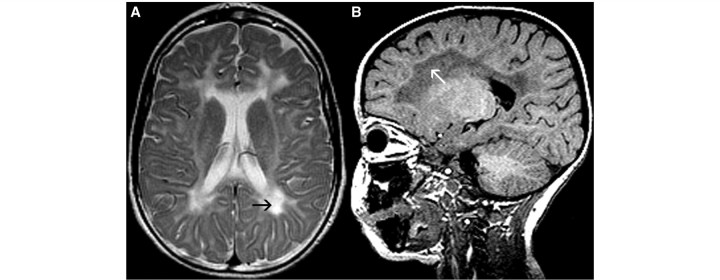
MRI of a 3-year-old male with HCC. The axial T2-weighted image shows prominent T2 hyperintensity (black arrow, A) and the sagittal T1-weighted image displays T1 hypointensity (white arrow, B) of the periventricular and deep white matter.
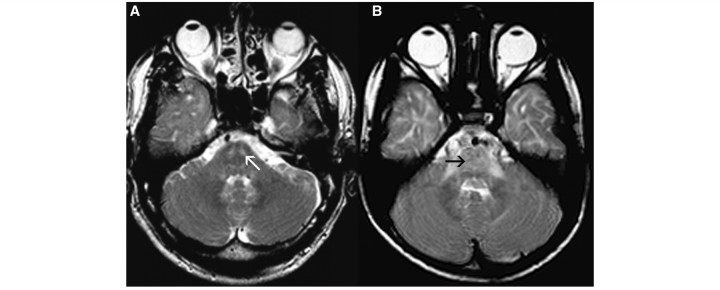
Cluster 7 consisted of six patients, all displaying prominent T2 hyperintensity associated with T1 hypointensity in the pons, similar to Cluster 3 (Fig. 3). In addition, in four patients T2 hyperintensity was predominantly seen in the subcortical cerebral white matter (Fig. 7A), whereas in most other clusters the T2 hyperintensity of the cerebral white matter was more diffuse (Fig. 7B), except for Cluster 8. In Cluster 7, the anterolateral part of the thalamus had a relatively low T2 signal in comparison with the rest of the thalamus in all patients.
Figure 7.
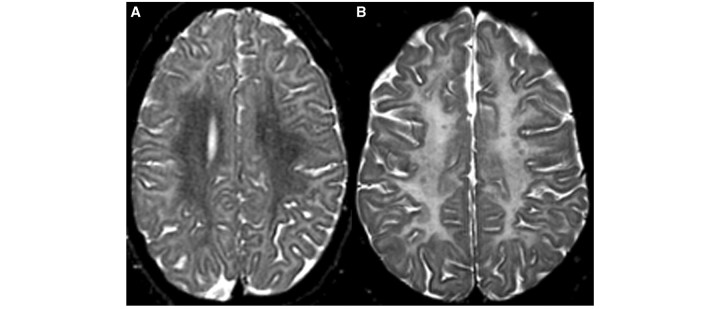
The axial T2-weighted image of a 16-year-old male with Salla disease demonstrates hyperintensity of the subcortical white matter, characteristic of patients in Clusters 7 and 8 (A), as compared to more diffuse hyperintensity of the cerebral white matter in a 19-year-old female with hypomyelination (B).
Cluster 8 contained only two patients with T2 hyperintensity of the subcortical white matter and T2 hypointensity of the remaining cerebral white matter (Fig. 7A). The pons had a low T2 signal in both patients.
Cluster 9 comprised nine patients and, although five patients displayed a homogeneous T2 signal intensity of the cerebral white matter and seven patients had cerebellar atrophy, this cluster was mainly characterized by the absence of all features described above.
Cluster 10 comprised eight patients. Comparable to Cluster 9, most features mentioned so far were absent, except for T2 hypointensity of the corpus callosum in seven patients and of the anterolateral part of the thalamus in six.
Table 3 summarizes the importance of the various items in the cluster analysis. Most items were important in discrimination between the various clusters, except for the cerebellar white matter, posterior limb of the internal capsule, midbrain and substantia nigra.
In Table 4 the patients in the clusters are linked to their underlying diseases. Clusters 1, 2, 4, 6, 7 and 8 mainly comprised patients with a single diagnosis. Cluster 3 contained patients with PMLD and patients with 4H syndrome. Infantile GM1 and GM2 gangliosidosis together formed Cluster 5. Clusters 9 and 10 were the least specific, comprising multiple disorders.
Table 4.
Clusters and disorders
| Cluster | n | PMD | PMLD | HCC | Fucosidosis | 4H | GM2 | GM1 | Salla |
|---|---|---|---|---|---|---|---|---|---|
| 1 | 37 | – | – | 1 | – | 36 | – | – | – |
| 2 | 16 | 15 | – | – | – | 1 | – | – | – |
| 3 | 8 | – | 6 | – | – | 2 | – | – | – |
| 4 | 4 | – | – | – | 4 | – | – | – | – |
| 5 | 11 | – | – | – | – | – | 9 | 2 | – |
| 6 | 11 | – | – | 11 | – | – | – | – | – |
| 7 | 6 | – | 6 | – | – | – | – | – | – |
| 8 | 2 | – | – | – | – | – | – | – | 2 |
| 9 | 9 | 2 | 1 | 1 | – | 1 | – | – | 4 |
| 10 | 8 | 4 | 2 | – | – | – | – | – | 2 |
| Total | 112 | 21 | 15 | 13 | 4 | 40 | 9 | 2 | 8 |
n = number of patients; GM2 = GM2 gangliosidosis; GM1 = GM1 gangliosidosis.
On the basis of these results, a flow chart (Fig. 8) was drafted for reviewing MRI scans displaying hypomyelination.
Figure 8.
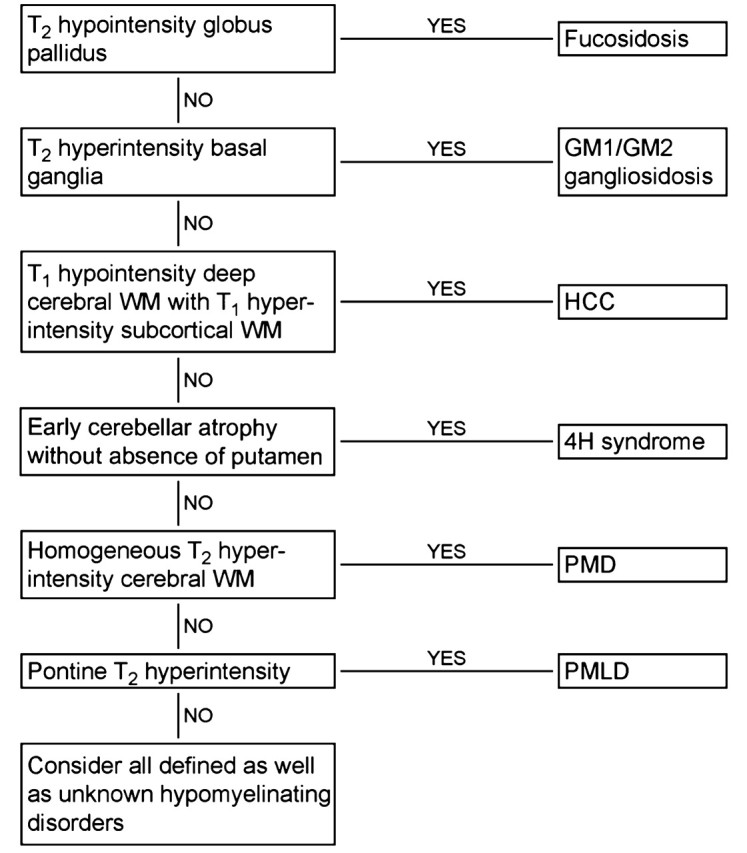
Flow chart developed for reviewing MRI scans displaying signs of hypomyelination. WM = white matter.
Multivariate analysis
In the multivariate analysis the diseases with more than eight patients, i.e. PMD, PMLD, HCC, 4H syndrome and GM2 gangliosidosis, were compared with respect to the MRI items marked in Table 2. In Supplementary Table 1 the results of this analysis are shown. The MRI abnormalities observed in one specific disease were significantly different from the abnormalities observed in the other diseases for all diagnoses, even after correction for multiple testing.
Comparison with hypomyelinating disorders of unknown origin
Among the 164 patients with a hypomyelinating disorder of unknown origin, 22 patients had MRI abnormalities compatible with one of the clusters (Table 5). For seven patients the suggested diagnosis was confirmed (Table 5). In the other 15 patients either the diagnostic work-up was not completed or attempts to contact the referring physician were unsuccessful. In none of the 22 patients was another diagnosis established other than that suspected.
Table 5.
Hypomyelinating disorders of unknown origin: prediction of diagnoses
| Disease | Cluster | Number of predictions | Number of confirmations |
|---|---|---|---|
| 4H syndrome | 1 | 5 | 0 |
| GM1 + GM2 | 5 | 2 | 1 |
| Salla disease | 8,9,10 | 4 | 2 |
| PMD | 2 | 3 | 1 |
| PMLD | 3,7 | 5 | 3 |
| HCC | 6 | 3 | 0 |
| Fucosidosis | 4 | 0 | 0 |
| Total | 22 | 7 |
GM1 = GM1 gangliosidosis; GM2 = GM2 gangliosidosis.
Discussion
At first glance, all hypomyelinating disorders have a similar appearance on MRI with mild T2 hyperintensity of much or almost all cerebral hemispheric white matter and a variable T1 signal intensity. Although in a large proportion of the patients with hypomyelination the cause remains unknown, the number of known causes for hypomyelination is increasing. Until now, MRI has been considered to be of little help in guiding the diagnostic process. This study shows, however, that it is possible to group patients with hypomyelination of known cause in clusters based on MRI features and that the clusters correspond with specific hypomyelinating disorders.
The diagnosis of 4H syndrome is based on hypomyelination on MRI, hypogonadotropic hypogonadism and hypodontia (Wolf et al., 2005; Timmons et al., 2006). The underlying defect is unknown. Of the 40 patients in this study, 36 were grouped in Cluster 1 (Table 4), demonstrating that the syndrome displays a distinct pattern of MRI abnormalities. This pattern is characterized by T2 hypointensity of optic radiation, pyramidal tracts at the level of the posterior limb of the internal capsule and anterolateral part of the thalamus (Fig. 1). The cerebellar white matter often has a mild T2 hyperintensity and the dentate nucleus stands out as relatively dark. Another dominant feature is cerebellar atrophy, as described previously (Wolf et al., 2005; Timmons et al., 2006). This atrophy is usually already seen before the age of 10, a feature uncommon in other hypomyelinating disorders. The T1 signal intensity of the white matter varies from high throughout the brain, suggesting presence of substantial amounts of myelin, to high in the optic radiation, brain stem and cerebellar white matter only, suggesting a much more limited myelin deposition. Four patients with the 4H syndrome were not included in Cluster 1. One patient had a homogeneous T2 signal of the cerebral white matter, a feature predominantly seen in PMD patients. The other three patients were included in the less specific Clusters 9 and 10. Cluster 1 contains only one patient with a diagnosis other than 4H syndrome, i.e. HCC.
In view of the combination of hypomyelination and early cerebellar atrophy, one could also consider a diagnosis of HABC, but HABC is characterized by early disappearance of the putamen (Van der Knaap et al., 2002), a feature not present in 4H syndrome. Cerebellar atrophy may be observed in other hypomyelinating disorders, but often milder and at an older age. If an MRI scan obtained at a young age is not available, it may be difficult to suggest a diagnosis of 4H syndrome based on MRI criteria alone.
Fucosidosis is a lysosomal storage disorder caused by a deficiency of α-l-fucosidase (van Hoof and Hers, 1968). The MRI pattern of fucosidosis is distinct. All four patients are grouped in Cluster 4, which does not contain patients with other diagnoses. Characteristic MRI features include a dark globus pallidus and often also substantia nigra on T2-weighted images (Fig. 4). In healthy subjects, the T2 signal of the globus pallidus tends to decrease with age, but the patients described here are young children and age, therefore, cannot explain the signal alteration of the globus pallidus. Signal abnormalities of the basal ganglia and thalamus have been reported in a number of lysosomal storage diseases (Autti et al., 2007). However, T2 hypointensity of the globus pallidus has been reported in fucosidosis only (Provenzale et al., 1995; Inui et al., 2000). The magnetic resonance images published by Prietsch et al. (2008) show that the lateral geniculate bodies have a low T2 signal as well. This can also be seen in two of our patients. The structures are, however, very small and could not be evaluated in the other two patients, so we are not certain this feature is invariably present.
Infantile GM1 and GM2 gangliosidosis are lysosomal storage disorders, caused by a deficiency in β-galactosidase and β-hexosaminidase A/B, respectively (Sandhoff and Christomanou, 1979). The MRI pattern of infantile GM1 and GM2 gangliosidosis is indistinguishable. All 11 patients are grouped in Cluster 5 and this cluster does not contain patients with alternative diagnoses. Characteristic MRI features are mild T2 hyperintensity of the caudate nucleus and putamen with signs of diffuse hypomyelination, contrasting with a normal T2 signal intensity of the corpus callosum (Fig. 5), indicating more complete myelination of this structure. The anterolateral part of the thalamus was slightly abnormal in signal in a few patients.
It should be noted that later onset variants of GM1 and GM2 gangliosidosis do not display hypomyelination (Muthane et al., 2004; Inglese et al., 2005; De Grandis et al., 2009). GM1 and GM2 gangliosidosis are in fact, neuronal storage disorders and it is only if the onset is early-infantile that the process of myelination, as assessed by MRI, is disturbed and halted (Schiffmann and van der Knaap, 2009).
HCC is an autosomal recessive disorder caused by mutations in the gene FAM126A encoding the protein hyccin, which has an as yet undetermined role in myelination (Zara et al., 2006). Of the 13 HCC patients, 11 are classified in Cluster 6, which does not contain patients with other diagnoses. In this cluster, hypomyelination is combined with areas of prominent T2 hyperintensity and T1 hypointensity in the periventricular and deep cerebral white matter (Fig. 6), indicating focal lesions. These MRI features have been described by others (Biancheri et al., 2007; Rossi et al., 2008). Other hypomyelinating disorders, such as 4H syndrome and GM1 and GM2 gangliosidosis may also display some additional T1 hypointensity of the deep cerebral white matter, but it is the contrast with the more normal appearance of the subcortical white matter on T1-weighted images that makes HCC distinct from other disorders.
PMD is an X-linked disorder, caused by variations of the PLP1 gene (Gencic et al., 1989; Hudson et al., 1989), including single nucleotide changes, deletions, duplications and triplications. The majority of 21 patients with PMD have a strikingly homogeneous T2 signal of the cerebral white matter (Fig. 2), often in combination with hypointensity on T1-weighted images. This feature defines Cluster 2, which contains only PMD patients except for one patient with 4H syndrome. It is striking that the tigroid pattern of myelin deposition described in the histopathology of PMD (Merzbacher, 1910) is not observed on MRI scans. Six PMD patients were assigned to the less specific Clusters 9 and 10.
PMLD is caused by mutations in the gene GJC2 (Uhlenberg et al., 2004). Patients with PMLD were assigned to the Clusters 3, 7, 9 and 10. An MRI feature of PMLD patients that is seen in all patients but one consists of prominent T2 signal hyperintensity of the pons, which has been reported before (Salviati et al., 2007; Wolf et al., 2007; Orthmann-Murphy et al., 2008), although not consistently (Bugiani et al., 2006). The pontine abnormalities either consist of a global T2 hyperintensity often associated with T1 hypointensity of the pons or of T2 hyperintensity and T1 hypointensity confined to the pyramidal tracts at this level (Fig. 3). One PMLD patient did not show these pontine abnormalities on his first MRI included in the statistical tests but did display them on later MRI scans (not included in the study). The signal intensity of the cerebral white matter structures is rather variable and does not contribute to discrimination. Noteworthy is the T2 hyperintensity of the subcortical white matter contrasting with a lower T2 signal of the remaining cerebral white matter in four patients (Fig. 7A), which is a feature of Cluster 7. The latter together with a hypointensity of the anterolateral part of the thalamus is responsible for dividing PMLD patients over roughly two clusters.
Salla is a lysosomal storage disorder caused by a defect of the sialic acid transporter (Mancini et al., 1991). Only patients who had an MRI scan when they were older than 1 year were included in our study, which explains that only patients with classical Salla disease were included and no patients with infantile sialic acid storage disorder. Classical Salla disease has no distinct MRI features and is the least recognizable disorder in this study. The pattern of T2 hyperintensity of the subcortical white matter contrasting with T2 hypointensity of the remaining cerebral white matter, seen in several PMLD patients, was also seen in two patients with Salla disease (Fig. 7A), however, without the typical pons abnormalities of PMLD. These two Salla patients were assigned a separate Cluster 8.
The conclusion of our study is that MRI scans can give clues for the diagnosis in most cases of PMD, PMLD, HCC, fucosidosis, 4H syndrome, GM1 gangliosidosis and GM2 gangliosidosis. This implies that MRI can guide the diagnostic process (see flow chart in Fig. 8) and reduce the number of tests that need to be performed. This conclusion is substantiated by findings among patients with hypomyelination of unknown origin.
It is important to realize that these MRI guidelines may have exceptions. The MRI features characteristic for a specific disorder may not be invariably present in all patients or in all stages of the disease and features thought to be characteristic of a particular disorder may be present in patients with another diagnosis. This means that if the diagnosis suggested by the MRI findings has been excluded, other diagnoses should still be considered.
The ages of the various groups in the present study were different (Table 1). In particular patients with GM1 and GM2 gangliosidosis were young, whereas the age distribution in the other disorders is much broader. The differences can be explained by the fact that the various disorders present at different ages and have different disease courses, GM1 and GM2 gangliosidosis being among the most severe.
Age is an important item influencing MRI patterns in hypomyelinating disorders. In our experience, MRI scans of most adolescents and adults with a hypomyelination disorder display cerebral and cerebellar atrophy and little or no myelin in the cerebral white matter, hampering pattern recognition. MRI scans obtained in childhood are more informative.
A limitation of the study is that some hypomyelinating disorders were excluded. Among these, Tay syndrome, oculodentodigital dysplasia and Waardenburg–Hirschsprung syndrome related to SOX10 mutations are associated with the classical picture of hypomyelination on MRI (Gutmann et al., 1991; Østergaard and Christensen, 1996; Inoue et al., 1999, 2002; Loddenkemper et al., 2002). The diagnoses of these disorders is, however, relatively easy because of striking clinical characteristics. Tay syndrome is characterized by hypersensitivity of the skin to sunlight and abnormal hair (Happle et al., 1984); patients with oculodentodigital dysplasia have digital, teeth and eye manifestations (Gutmann et al., 1991) and patients with Waardenburg-Hirschsprung syndrome caused by SOX10 mutations have the typical features of Waardenburg-Hirschsprung syndrome (Pingault et al., 1998). HABC was also excluded, but this disorder can be easily recognized on MRI by the early disappearance of the putamen in combination with hypomyelination (Van der Knaap et al., 2002).
The current study raises the expectation that MRI may also be a valuable tool in the study of the large group of hypomyelinating disorders of unknown origin. In-depth studies of MRI-defined homogeneous subgroups may lead to the identification of novel disease entities and, eventually, their causes.
Funding
The study received financial support from the Dutch Organization for Scientific Research (ZonMw, TOP Grant 9120.6002) and the Optimix Foundation for Scientific Research.
Supplementary material
Supplementary material is available at Brain online.
Acknowledgements
We thank all referring colleagues for sending MRI scans and providing information on diagnoses.
Glossary
Abbreviations
- 4H syndrome
hypomyelination with hypogonadotrophic hypogonadism and hypodontia
- HABC
hypomyelination with atrophy of the basal ganglia and cerebellum
- HCC
hypomyelination with congenital cataract
- PMD
Pelizaeus–Merzbacher disease
- PMLD
Pelizaeus–Merzbacher-like disease
References
- Autti T, Joensuu R, Aberg L. Decreased T2 signal in the thalami may be a sign of lysosomal storage disease. Neuroradiology. 2007;49:571–8. doi: 10.1007/s00234-007-0220-6. [DOI] [PubMed] [Google Scholar]
- Barkovich AJ. Concepts of myelin and myelination in neuroradiology. Am J Neuroradiol. 2000;21:1099–09. [PMC free article] [PubMed] [Google Scholar]
- Barkovich AJ, Kjos BO, Jachson DE, Norman D. Normal maturation of the neonatal and infant brain: MR imaging at 1.5T. Radiology. 1988;166:173–80. doi: 10.1148/radiology.166.1.3336675. [DOI] [PubMed] [Google Scholar]
- Biancheri R, Zara F, Bruno C, Rossi A, Bordo L, Gazzerro E, et al. Phenotypic characterization of hypomyelination and congenital cataract. Ann Neurol. 2007;62:121–7. doi: 10.1002/ana.21175. [DOI] [PubMed] [Google Scholar]
- Bugiani M, Al Shahwan S, Lamantea F, Bizzi A, Bakhsh MD, Moroni I, et al. GJA12 mutations in children with recessive hypomyelinating leukoencephalopathy. Neurology. 2006;67:273–9. doi: 10.1212/01.wnl.0000223832.66286.e4. [DOI] [PubMed] [Google Scholar]
- De Grandis E, Di Rocco M, Pessagno A, Veneselli E, Rossi A. MR imaging findings in 2 cases of late infantile GM1 gangliosidosis. AJNR Am J Neuroradiol. 2009;30:1325–7. doi: 10.3174/ajnr.A1508. [DOI] [PMC free article] [PubMed] [Google Scholar]
- Formann AK. Latent class model diagnostics – a review and some proposals. Comput Statist Data Anal. 2003;41:549–59. [Google Scholar]
- Fukumizu M, Yoshikawa H, Takashima S, Sakuragawa N, Kurokawa T. Tay-Sachs disease: progression of changes on neuroimaging in four cases. Neuroradiology. 1992;34:483–6. doi: 10.1007/BF00598955. [DOI] [PubMed] [Google Scholar]
- Galluzzi P, Rufa A, Balestri P, Cerase A, Federico A. MR brain imaging of fucosidosis type I. AJNR Am J Neuroradiol. 2001;22:777–80. [PMC free article] [PubMed] [Google Scholar]
- Gay CT, Hardies LJ, Rauch RA, Lancaster JL, Plaetke R, DuPont BR, et al. Magnetic resonance imaging demonstrates incomplete myelination in 18q- syndrome: evidence for myelic basic protein haploinsufficiency. Am J Med Genet. 1997;74:422–31. doi: 10.1002/(sici)1096-8628(19970725)74:4<422::aid-ajmg14>3.0.co;2-k. [DOI] [PubMed] [Google Scholar]
- Gencic S, Abuelo D, Ambler M, Hudson LD. Pelizaeus-Merzbacher disease: an X-linked neurologic disorder of myelin metabolism with a novel mutation in the gene encoding proteolipid protein. Am J Hum Genet. 1989;45:435–42. [PMC free article] [PubMed] [Google Scholar]
- Gutmann DH, Zackai EH, McDonald-McGinn DM, Fischbeck KH, Kamholz J. Oculodentodigital dysplasia syndrome associated with abnormal cerebral white matter. Am J Med Genet. 1991;41:18–20. doi: 10.1002/ajmg.1320410106. [DOI] [PubMed] [Google Scholar]
- Happle R, traupe H, grobe H, Bonsmann G. The Tay syndrome (congenital ichthyosis with trichothiodystrophy. Eur J Pediatr. 1984;141:147–52. doi: 10.1007/BF00443212. [DOI] [PubMed] [Google Scholar]
- van Hoof F, Hers HG. Mucopolysaccharidosis by absence of alpha-fucosidase. Lancet. 1968;1:1198. doi: 10.1016/s0140-6736(68)91895-3. [DOI] [PubMed] [Google Scholar]
- Hudson LD, Puckett C, Berndt J, Chan J, Gencic S. Mutation of the proteolipid protein gene PLP in a human X chromosome-linked myelin disorder. Proc Natl Acad Sci USA. 1989;86:8128–31. doi: 10.1073/pnas.86.20.8128. [DOI] [PMC free article] [PubMed] [Google Scholar]
- Inglese M, Nusbaum AO, Pastores GM, Gianutsos J, Kolodny EH, Gonen O. MR imaging and proton spectroscopy of neuronal injury in late-onset GM2 gangliosidosis. AJNR Am J Neuroradiol. 2005;26:2037–42. [PMC free article] [PubMed] [Google Scholar]
- Inoue K, Shilo K, Boerkoel CF, Crowe C, Sawady J, Lupski JR, et al. Congenital hypomyelinating neuropathy, central dysmyelination, and Waardenburg-Hirschsprung disease: phenotypes linked by SOX10 mutattion. Ann Neurol. 2002;52:836–42. doi: 10.1002/ana.10404. [DOI] [PubMed] [Google Scholar]
- Inoue K, Tanabe Y, Lupski JR. Myelin deficiencies in both the central and the peripheral nervous system associated with SOX10 mutation. Ann Neurol. 1999;46:313–8. doi: 10.1002/1531-8249(199909)46:3<313::aid-ana6>3.0.co;2-7. [DOI] [PubMed] [Google Scholar]
- Inui K, Akagi M, Nishigaki T, Muramatsu T, Tsukamoto H, Okada S. A case of chronic infantile type of fucosidosis: clinical and magnetic resonance image findings. Brain Dev. 2000;22:47–9. doi: 10.1016/s0387-7604(99)00082-0. [DOI] [PubMed] [Google Scholar]
- Jaeken J, Detheux M, van Maldergem L, Foulon M, Carchon H, van Schaftingen E. 3-Phosphoglycerate dehudrogenase deficiency: an inborn error of serine biosynthesis. Arch Dis Child. 1996;74:542–5. doi: 10.1136/adc.74.6.542. [DOI] [PMC free article] [PubMed] [Google Scholar]
- Koelfen W, Freund M, Jaschke W, Koenig S, Schultze C. GM-2 gangliosidosis (Sandhoff’s disease): two year follow-up by MRI. Neuroradiology. 1994;36:152–4. doi: 10.1007/BF00588086. [DOI] [PubMed] [Google Scholar]
- de Koning TJ, Jaeken J, Pineda M, van Maldergem L, Poll-The BT, van der Knaap MS. Hypomyelination and reversible whiet matter attenuation in 3-phosphoglycerate dehydrogenase deficiency. Neuropediatrics. 2000;31:287–92. doi: 10.1055/s-2000-12944. [DOI] [PubMed] [Google Scholar]
- Lin H-C, Tsai F-J, Shen C-H, Peng C-T. Infantile form GM1 gangliosidosis with dilated cardiomyopathy: a case report. Acta Paediatr. 2000;89:880–3. doi: 10.1080/080352500750043828. [DOI] [PubMed] [Google Scholar]
- Loddenkemper T, Grote K, Evers S, Oelerich M, Stögbauer F. Neurological manifestations of the oculodentodigital dysplasia syndrome. J Neurol. 2002;249:584–95. doi: 10.1007/s004150200068. [DOI] [PubMed] [Google Scholar]
- Loevner LA, Shapiro RM, Grossmann RI, Overhauser J, Kamholz J. White matter changes associated with deletions of the long arm of chromosome 18 (18q- syndrome): a dysmyelinating disorder? AJNR Am J Neuroradiol. 1996;14:1843–8. [PMC free article] [PubMed] [Google Scholar]
- Mancini GM, Beerens CE, Aula PP, Verheijen FW. Sialic acid storage diseases. A multiple lysosomal transport defect for acidic monosaccharides. J Clin Invest. 1991;87:1329–35. doi: 10.1172/JCI115136. [DOI] [PMC free article] [PubMed] [Google Scholar]
- Merzbacher L. Eine eigenartige familiäre Erkrankungsform (Aplasia axialis extracorticalis) Zges Neurol Psychiatr. 1910;3:1–138. [Google Scholar]
- Miller G, Mowrey PN, Hopper KD, Frankel CA, Ladda RL. Neurologic manifestations in 18q- syndrome. Am J Med Genet. 1990;37:128–32. doi: 10.1002/ajmg.1320370130. [DOI] [PubMed] [Google Scholar]
- Mugikura S, Takahashi S, Higano S, Kurihara N, Non K, Sakamoto K. MR findings in Tay-Sachs disease. J Comput Assist Tomogr. 1996;20:551–5. doi: 10.1097/00004728-199607000-00009. [DOI] [PubMed] [Google Scholar]
- Muthane U, Chickabasaviah Y, Kaneski C, Shankar SK, Narayanappa G, Christopher R, et al. Clinical features of adult GM1 gangliosidosis: report of three Indian patients and review of 40 cases. Mov Disord. 2004;19:1334–41. doi: 10.1002/mds.20193. [DOI] [PubMed] [Google Scholar]
- Nishio H, Kodama S, Matsuo T, Ichihashi M, Ito H, Fujiwara Y. Cockayne syndrome: magnetic resonance images of teh brain in a severe form with early onset. J Inherit Metab Dis. 1988;11:88–102. doi: 10.1007/BF01800059. [DOI] [PubMed] [Google Scholar]
- Orthmann-Murphy JL, Salsano E, Abrams CK, Bizzi A, Uziel G, Freidin MM, et al. Hereditary spastic paraplegia is a novel phenotype for GJA12/GJC2 mutations. Brain. 2008;132:426–38. doi: 10.1093/brain/awn328. [DOI] [PMC free article] [PubMed] [Google Scholar]
- Østergaard JR, Christensen T. The central nervous system in Tay syndrome. Neuropediatrics. 1996;27:326–30. doi: 10.1055/s-2007-973803. [DOI] [PubMed] [Google Scholar]
- Pelizaeus F. Über eine eigentümliche Form spastischer Lähmung mit Zerebralerscheinungen auf hereditärer Grundlage (multiple Sklerose) Arch Psychiatr Nervenkr. 1885;16:698–710. [Google Scholar]
- Pingault V, Bondurand N, Kuhlbrodt K, Goerich DE, Préhu MO, Puliti A, et al. SOX10 mutations in patients with Waardenburg-Hirschsprung disease. Nat Genet. 1998;18:171–3. doi: 10.1038/ng0298-171. [DOI] [PubMed] [Google Scholar]
- Prietsch V, Arnold S, Kraegeloh-Mann I, Kuehr J, Santer R. Severe hypomyelination as the leading neuroradiological sign in a patiënt with fucosidosis. Neuropediatrics. 2008;39:51–4. doi: 10.1055/s-2008-1077048. [DOI] [PubMed] [Google Scholar]
- Provenzale JM, Barboriak DP, Sims K. Neuroradiological findings in fucosidosis, a rare lysosomal storage disease. AJNR Am J Neuroradiol. 1995;16:809–13. [PMC free article] [PubMed] [Google Scholar]
- Rossi A, Biancheri R, Zara F, Bruno C, Uziel G, van der Knaap MS, et al. Hypomyelination and congenital cataract: neuroimaging features of a novel inherited white matter disorder. AJNR Am J Neuroradiol. 2008;29:301–5. doi: 10.3174/ajnr.A0792. [DOI] [PMC free article] [PubMed] [Google Scholar]
- Salviati L, Trevisson E, Baldoin MC, Toldo I, Sartori S, Calderone M, et al. A nopvel deletion in the GJA12 gene causes Pelizaeus-Merzbacher-like disease. Neurogenetics. 2007;8:57–60. doi: 10.1007/s10048-006-0065-x. [DOI] [PubMed] [Google Scholar]
- Sandhoff K, Christomanou H. Biochemistry and genetics of gangliosidosis. Hum Genet. 1979;50:107–43. doi: 10.1007/BF00390234. [DOI] [PubMed] [Google Scholar]
- Schiffmann R, van der Knaap MS. Invited article: an MRI-based approach to the diagnosis of white matter disorders. Neurology. 2009;72:750–9. doi: 10.1212/01.wnl.0000343049.00540.c8. [DOI] [PMC free article] [PubMed] [Google Scholar]
- Shen W-C, Tsai F-J, Tsai C-H. Myelination arrest demonstrated using magnetic resonance imaging in a child with type GM1 gangliosidosis. J Formos Med Assoc. 1998;97:296–9. [PubMed] [Google Scholar]
- Sonninen P, Autti T, Varho T, Hämäläinen M, Raininko R. Brain involvement in Salla disease. AJNR Am J Neuroradiol. 1999;2:433–43. [PMC free article] [PubMed] [Google Scholar]
- Timmons M, Tsokos M, Abu Asab M, Seminara SB, Zirzow GC, Kaneski CR, et al. Peripheral and central hypomyelination with hypogonadotrophic hypogonadism and hypodontia. Neurology. 2006;67:2066–9. doi: 10.1212/01.wnl.0000247666.28904.35. [DOI] [PMC free article] [PubMed] [Google Scholar]
- Uhlenberg B, Schuelke M, Rüschendorf F, Ruf N, Kaindl AM, Henneke M, et al. Mutations in the gene encoding gap junction protein α12 (connexin 46.6) cause Pelizaeus-Merzbacher-like disease. Am J Hum Genet. 2004;75:251–60. doi: 10.1086/422763. [DOI] [PMC free article] [PubMed] [Google Scholar]
- Van der Knaap MS, Breiter SN, Naidu S, Hart AA, Valk J. Defining and categorizing leukoencephalopathies of unknown origin: MR imaging approach. Radiology. 1999;213:121–33. doi: 10.1148/radiology.213.1.r99se01121. [DOI] [PubMed] [Google Scholar]
- Van der Knaap MS, Naidu SB, Pouwels PJW, Bonavita S, van Coster R, Lagae L, et al. New syndrome characterized by hypomyelination with atrophy of the basal ganglia and cerebellum. AJNR Am J Neuroradiol. 2002;23:1466–74. [PMC free article] [PubMed] [Google Scholar]
- Wolf NI, Cundall M, Rutland P, Rosser E, Surtees R, Benton S, et al. Frameshift mutation in GJA12 leading to nystagmus, spastic ataxia and CNS dys-/demyelination. Neurogenetics. 2007;8:39–44. doi: 10.1007/s10048-006-0062-0. [DOI] [PubMed] [Google Scholar]
- Wolf NI, Harting I, Boltshauser E, Wiegand G, Koch MJ, Schmitt-Mechelke T, et al. Leukoencephalopathy with ataxia, hypodontia, and hypomyelination. Neurology. 2005;64:1461–4. doi: 10.1212/01.WNL.0000158615.56071.E3. [DOI] [PubMed] [Google Scholar]
- Zara F, Biancheri R, Bruno C, Uziel G, van der Knaap MS, Minetti C, et al. Deficiency of hyccin, a newly identified membrane protein, causes hypomyelination and congenital cataract. Nat Genet. 2006;38:1111–3. doi: 10.1038/ng1870. [DOI] [PubMed] [Google Scholar]