Abstract
Fluorescence in situhybridization (FISH) is an extremely effective and sensitive approach to analyzing chromosome aberrations. Until recently, this procedure has taken multiple days to complete. The introduction of telomeric and centromeric peptide nucleic acid (PNA) probes has reduced the procedure's duration to several hours, but the protocols still call for a high temperature (80–90°C) step followed by 1–3 h of hybridization. The newest method to speed up the FISH protocol is the use of a microwave to shorten the heating element to less than a minute; however this protocol still calls for a 1-h hybridization period. We have utilized PNA centromere/telomere probes in conjunction with a microwave oven to show telomere and centromere staining in as little as 30 s. We have optimized the hybridization conditions to increase the sensitivity and effectiveness of the new protocol and can effectively stain chromosomes in 2 min and 30 s of incubation. We have found that our new approach to FISH produces extremely clear and distinct signals. Radiation-induced dicentric formation in mouse and human fibroblast cells was analyzed by two individual scorers and the observed dicentrics matched very well.
Keywords: PNA FISH, cytogenetics, chromosome aberrations
INTRODUCTION
Cytogenetic analysis, especially analysis of dicentric and centric ring formation, is the most reliable and strongest biomarker for assessing the prognosis of individuals who have been exposed to radiation when no physical dose estimate is available [1, 2]. The biologically estimated doses are obtained by comparing the observed yield of unstable chromosomal aberrations (dicentrics and centric rings) in peripheral blood lymphocytes of the studied individual to a standard dose–response curve obtained after in vitroirradiation. In the event of a nuclear accident or detonation of a weapon of mass destruction, thousands of people could be exposed to radiation, and these circumstances would require a quick and easy method to determine whether individuals were exposed to a significant dose of radiation to be readily available. The traditional fluorescence in situhybridization (FISH) method is an extremely long and difficult procedure, requiring a 3-day ‘aging’ period and 12-h hybridization [3, 4]. The introduction of peptide nucleic acid (PNA) telomere and centromere probes has greatly decreased the time that it takes to stain the centromeres and telomeres of chromosomes [5]. The sugar phosphate backbone is replaced by a neutral pseudo-peptide polymer, this structure gives the PNA probe high affinity and specificity to the target DNA [5]. The newest method to speed up the FISH protocol is the use of a microwave oven to shorten the heating duration to less than a minute; however this protocol still calls for a 1-h hybridization period [4, 6, 7]. The FISH techniques can be useful for the estimation of the irradiated doses by the quantification of various types of chromosome abnormalities. With our novel protocol, we can rapidly stain and identify chromosome abnormalities [8]. In addition, we have also streamlined the classical protocol by removing the hybridization period, so the FISH procedure can be easily performed and produce high-quality chromosome stains to aid in the identification of chromosome abnormalities.
Here we have altered the microwave protocol and utilized the PNA probes' high affinity for telomere and centromere sequences to stain the chromosomes in as little at 30 s and have optimized the protocol to stain the chromosomes in 2 min30 s. To show that the protocol can be used to effectively identify chromosomal aberrations, we have irradiated human and mouse fibroblast cells, at 0, 1, 2 and 4 Gy. Two independent scorers scored 50 chromosome spreads for a total of 100 chromosome spreads for each dose and the number of chromosome aberrations was compared and averaged. The average number of chromosome aberrations was compared to the ‘expected’ number of chromosome aberrations based on the available literature [9, 10].
METHODS
Cell lines
B70 mouse fibroblast cell strains are isolated from the skin of female C57/B6 mice, using only early passages 3 and 4. For human study, early passages (passages 10 to 12) of AG1521 normal male human fibroblast cells were used and human peripheral lymphocytes were obtained from a healthy 25-year-old male donor with approval from the human use committee. Seven milliliters of peripheral blood was placed into Vacutainer CPT Tubes (Beckton Dickinson CO, Franklin Lakes, NJ, USA) and centrifuged (3300 rpm, 15 min) to separate lymphocytes from whole blood. Isolated lymphocytes were placed into Roswell Park Memorial Institute 1640 medium (Invetrogen, Grand Island, NY, USA) with 20% fetal bovine serum (FBS), 180 μg/ml of phytohemagglutinin (PHA, Remel, Lenexa, KS, USA), 0.1 μg/ml Colcemid (Invitrogen) and 60 μg/ml kanamycin, and then incubated for 48 h (37°C, 5% CO2). B70 and AG1521 cells were cultured in Minimum Essential Medium Alpha media (Hyclone, ThermoFisher, Waltham, MA, USA) with 15% FBS (Sigma, St. Louis, MO, USA) antibiotics (Anti-Anti, Invitrogen). Prior to irradiation, cells were synchronized into G0/G1-phase by contact inhibition. These cells were irradiated with gamma radiation using a J. L. Shepherd Model Mark I-68 6000Ci Cs-137 source at room temperature.
Metaphase chromosome preparation
Cells were sub-cultured immediately after irradiation and 0.1 µg/ml of colcemid was added to the flask of cells to harvest the first post-irradiated metaphases. Cells were trypsinized and were suspended in 6 ml of a 75 mM KCl solution warmed to 37°C and placed in a 37°C water bath for 20 min. Carnoy's solution (3:1 methanol to acetic acid) was added to the samples according to the standard protocol. Slides were placed in ice water and allowed to chill. The cell solution was dropped onto the cold slides. These were set aside and allowed to dry until the Carnoy's solution had evaporated, roughly 4–5 min [2].
Fixation and treatments
Once the slides were dry, they were immersed in a 4% paraformaldehyde in phosphate-buffered saline (PBS) solution for 10 min. They were quickly washed in PBS and placed in 0.1 mg/ml of RNase A in PBS solution for 10 min then washed in fresh PBS. The slides were then placed in a solution of 0.002% pepsin in 50 ml of 100 mM HCl for 15 min. The slides were then washed in fresh PBS and placed in 70, 90 and 100% ethanol for 2 min each.
Staining solutions
We prepared 60% of formamide, 20 mM of Tris-HCl, 200 nM of TelG-Cy3 (Cy3-O-TTAGGGTTAGGGTTAGGG) and 200 nM of CENPB Box-FAM (FAM-O-ATTCGTTGGAAACGGGA) (Panagene, Thousand Oaks, CA, USA).
FISH protocol
A total of 10 µl of staining solution was placed on each slide and a cover slip was added. The cover slip was fixed in place by applying rubber cement to the edges of the cover slip, it was best to let the rubber cement set for at least 5 min before placing the slides in water. The cover slips had to be completely watertight. The slides were then submerged in 200 ml of tap water in a 1-l polyethylene/polypropylene container. The sealed slides were microwaved (Sharp R-3A66) for 30 sat 850 W. The water was immediately removed and replaced with tap water again and microwaved at 85 W for 120 s. After microwaving the cover slip was removed then the slides washed in 37°C 1 × PN buffer twice for 5 min. After washing, the slides were counterstained with Prolong Gold Antifade with 4′,6-diamidino-2-phenylindole (DAPI) (Invitrogen) was performed according to standard protocol.
Image analysis
An Olympus BX51 fluorescence microscope (Olympus, Tokyo, Japan) equipped with a Q-imaging aqua-cooled CCD camera (Q-imaging, Surrey, BC, Canada) was used for image capture. Images were captured using QCapture Pro software and the DAPI, centromere and telomere images were merged. The combined images were scored for quality and presence of chromosome abnormalities. Image qualities were scored based on signal intensity of the centromere and telomere signal and level of background. The different treatments were categorized on a scale of 1 to 5, with 1 being complete lack of telomere/centromere signal or extremely high background and 5 being bright, defined centromere/telomeres and lack of high background. We defined a lack of background as limited to no red/green signals outside of the centromere or telomere. Two scorers used independent slides and analyzed a total of 100 metaphase cells for chromosome abnormalities at each dose, focusing on dicentric and centric rings.
RESULTS
Detection and optimization of FISH protocol
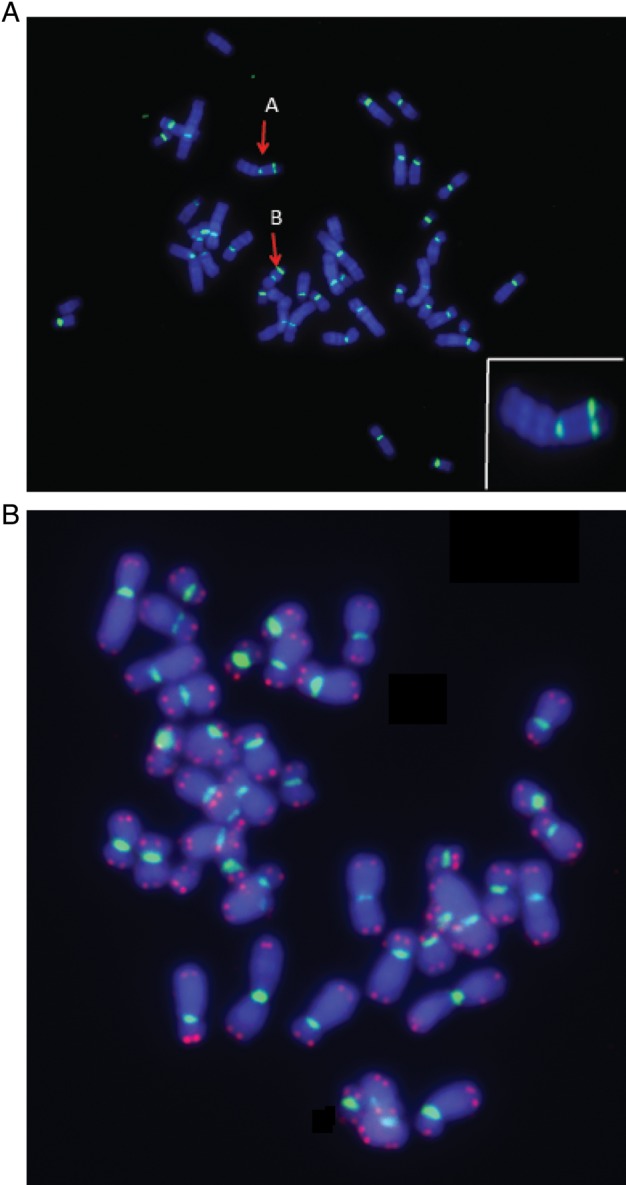
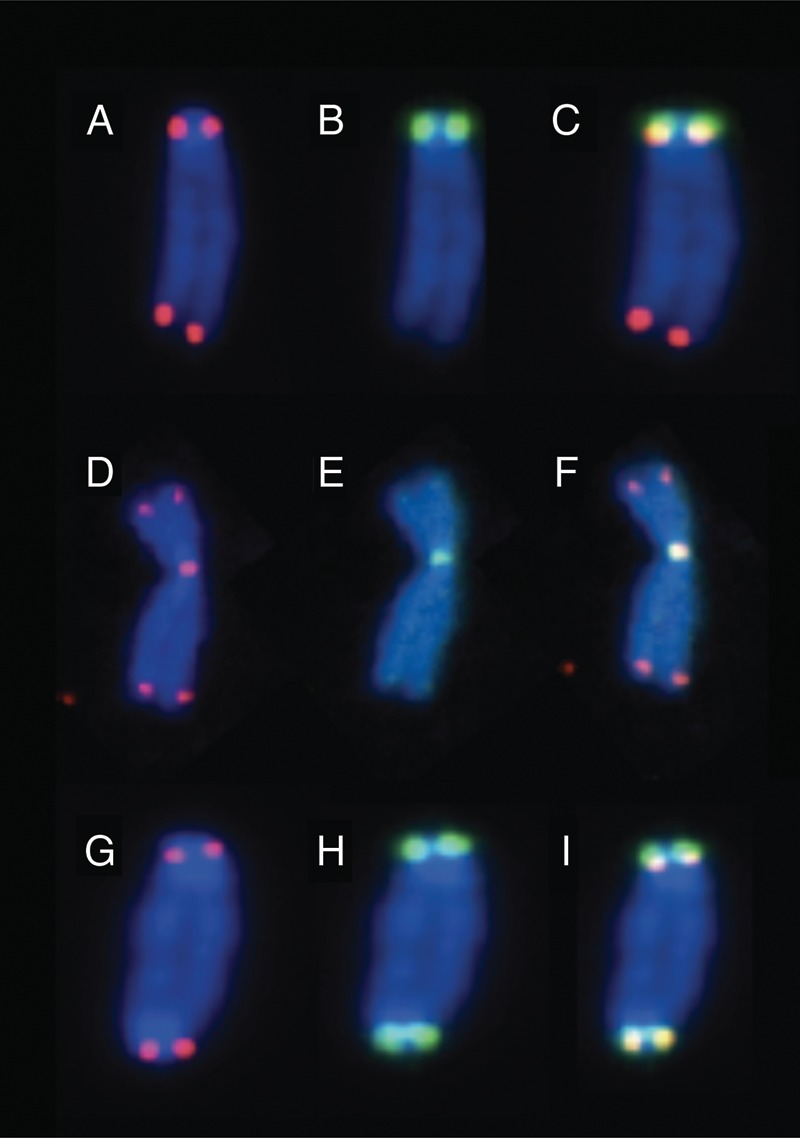
To find the optimal staining conditions, both human and mouse slides were stained with centromere and telomere PNA probes under varying conditions. The signal strength of the telomeres and centromeres was evaluated and can be seen in Table 1. The signals were rated on a scale from 1 to 5 based on the description in the methods and material section. It was seen that any heating beyond 30 s at 850 W produced a poor staining quality and elevated background. After 30 s at 850 W, the water reached a temperature of 50°C. At times exceeding 45 s the water reached temperatures of 60–65°C. Microwave treatment of 30 s at 850 W and 2 min at 85 W gives the best results among our trials. As seen in Figure 1B, the centromeres and telomeres are well defined and easily identifiable. Additionally, Figure 2indicates that our protocol can effectively stain mouse centromere and telomeres. It was noted that water was required for hybridization; slides heated without water produced no telomere or centromere signal after 1 min of microwaving.
Table 1.
Microwave times and relative signal strength
| Time |
Signal quality | |
|---|---|---|
| High | Low | |
| (850 Watts) | (85 Watts) | |
| 30 s | 0 s | 4 |
| 45 s | 0 s | 2 |
| 60 s | 0 s | 1 |
| 30 s | 30 s | 4 |
| 30 s | 60 s | 3 |
| 30 s | 60 s x2 | 2 |
| 60 s | 60 s | 1 |
| 15 s x2 | 60 s | 3 |
| 30 s | 120 s | 5 |
Signal strength rated from 1–5, 1 being poor to not visible and 5 being strong. The strength of the signal was based on the overall intensity of the signal, the ability to distinguish between signals, which were located very close together, and the overall background of the image. High indicates 850 W and low indicates 85 W.
Fig. 1.

Metaphase early passage of a human fibroblast cell line, AG1521, and metaphase human peripheral lymphocytes (Aand B, respectively) were stained by PNA FISH probes using our microwave method. Green signals are centromeres. Two centromeres on one chromosome clearly show a dicentric aberration, seen in A and B. The lower right image is an enlargement of chromosome A. Telomere signal was omitted in the human fibroblast cell line due to a low signal intensity from shortened telomeres in cultured cells.
Fig. 2.

Metaphase early passage of a mouse fibroblast cell line, B70, was stained by PNA FISH probes using our microwave method. Green signals are centromeres and red signals are telomeres. A, Band Cdepict a ‘normal’ mouse chromosome, four telomere signals (A) and two centromere signals (B). D, Eand Fdepict an abnormality where two chromosomes have fused at the centromere region. This is indicated by five telomere signals (D) and one centromere signal (E). G, Hand Idepict a classical dicentric chromosome. This is indicated by the four centromere signals (G) and only four telomere signals (H). A, B and D, E and G, H were merged to create Figures C, F and I, respectively.
Evaluation of quick FISH protocol
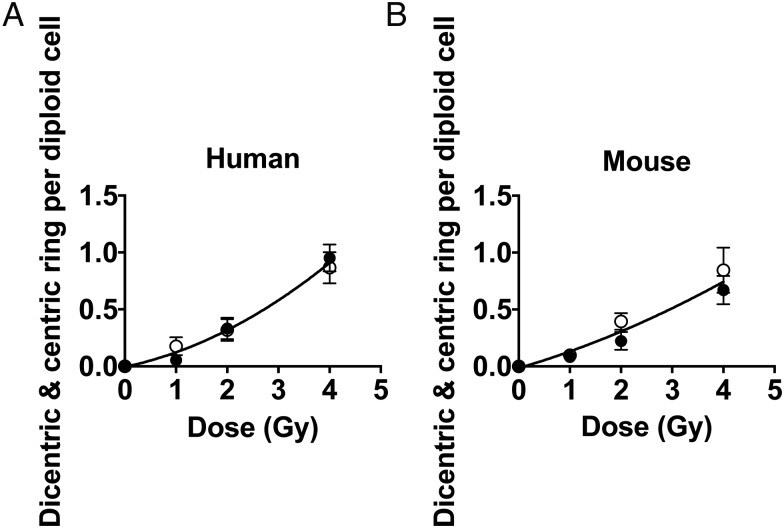
Figure 3(A and B) represents the dose–response curve of early passage normal human fibroblast cells and mouse fibroblast cells, respectively, obtained by two independent scorers using the microwave FISH technique. The results of the scoring groups matched very well in the independent slides. The statistical analysis of an Ftest with Prism 5 software revealed that the P-values of two independent curves between two scorers of both the mouse and human fibroblasts were not statistically different, 0.2086 for mouse fibroblast cells and 0.8209 for the human fibroblasts. Therefore, we concluded that the two independent curves are not significantly different. Additionally, we noted that the number of observed dicentrics for the human fibroblasts, AG1521, matched well with the number of dicentrics documented in previous papers, at all doses 1 Gy, 2 Gy and 4 Gy [9, 10].
Fig. 3.
Dose–response curves obtained by two students. Each scorer used independent slides and scored a minimum of 50 metaphase cells, for a total of 100 metaphase spreads per dose. Cells were exposed to gamma rays in G0/G1-phase and the first post-irradiated metaphases were harvested and stained as described in the Methods section using a fast FISH microwave time of 3 min. Ais a dose–response curve for AG1521 early passage of normal human fibroblast cell lines. Bis a dose–response curve for B70 C57bl6 mouse fibroblast cells. A white circle represents scorer 1 and a black circle represents scorer 2. Error bars indicate standard deviation for 50 scored cells.
DISCUSSION
We have effectively altered the traditional microwave FISH protocol to optimize it to 2 min 30 s using a commercially available microwave. In this study we have shown that the new protocol can be used to quickly and effectively identify chromosome abnormalities in irradiated human and mouse fibroblast cells. By clearly identifying the centromeres and telomeres this protocol allows for better distinction between normal chromosomes and dicentrics. When scoring dicentric chromosome abnormalities, the use of a telomere probe allowed for the identification of ‘true’ dicentrics and two chromosomes overlapping. When using centromere and telomere probes it is extremely easy to identify a chromosome with two centromere signals and only four telomere signals, a ‘true’ dicentric, versus an overlapping chromosome with two centromere signals and eight telomere signals. As seen in Figure 2(G–I), a 'normal' appearing mouse chromosome is clearly a dicentric and the PNA FISH staining allows for easy identification.
More often FISH analysis using centromere and telomere PNA probes is used to identify chromosome abnormalities because of the probes' high specificity and the ease of identifying abnormalities when stained in this fashion [11, 12]. However, the process still requires several heating and hybridization steps that can take up to 1 h to complete. We have utilized the PNA probes' extremely high affinity for its DNA target to streamline the staining process from 1 h to less than 3 min (1/20 of the total time of older techniques). In addition to shortening the hybridization period, our optimized protocol does not require any advanced techniques and can be easily performed in any laboratory.
This suggests that fast FISH staining using the microwave technique can be integrated into a reliable tool for rapid automated cytogenetic analysis [13, 14]. Moreover, computer software can detect two green centromeric signals in a chromosome spread, thus detecting a dicentric. Combining the automatic cytogenetic analysis and computer systems, chromosome analysis will be an extremely important tool for analysis after radiation associated disasters and accidents.
ACKNOWLEDGEMENTS
We would like to thank the Dr Akiko M. Ueno Radiation Biology Research Fund, the Dr John H. Venable Memorial Scholarship and the Technology Fee Stipend Student Experimental Learning Fund in the College of Veterinary Medicine and Biosciences in Colorado State University for helping support our research and making this project a possibility.
REFERENCES
- 1.Hayata I, Kanda R, Minamihisamatsu M, et al. Cytogenetical dose estimation for 3 severely exposed patients in the JCO criticality accident in Tokai-mura. J Radiat Res. 2001;42(Suppl):S149–55. doi: 10.1269/jrr.42.s149. [DOI] [PubMed] [Google Scholar]
- 2.Sasaki MS, Hayata I, Kamada N, et al. Chromosome aberration analysis in persons exposed to low-level radiation from the JCO criticality accident in Tokai-mura. J Radiat Res. 2001;(Suppl):S107–16. doi: 10.1269/jrr.42.s107. [DOI] [PubMed] [Google Scholar]
- 3.Garcia-Sagredo JM. Fifty years of cytogenetics: a parallel view of the evolution of cytogenetics and genotoxicology. Biochimica et Biophysica Acta. 2008;1779:363–75. doi: 10.1016/j.bbagrm.2008.05.003. [DOI] [PubMed] [Google Scholar]
- 4.Durm M, Haar FM, Hausmann M, Ludwig H, Cremer C. Optimized Fast-FISH with alpha-satellite probes: acceleration by microwave activation. Brazilian J Med Biol Res/Revista brasileira de pesquisas medicas e biologicas/Sociedade Brasileira de Biofisica. 1997;30:15–23. doi: 10.1590/s0100-879x1997000100003. [DOI] [PubMed] [Google Scholar]
- 5.Paulasova P, Pellestor F. The peptide nucleic acids (PNAs): a new generation of probes for genetic and cytogenetic analyses. Annales de Genetique. 2004;47:349–58. doi: 10.1016/j.anngen.2004.07.001. [DOI] [PubMed] [Google Scholar]
- 6.Kitayama Y, Igarashi H, Sugimura H. Initial intermittent microwave irradiation for fluorescence in situ hybridization analysis in paraffin-embedded tissue sections of gastrointestinal neoplasia. Laboratory Investigation; J Tech Methods Pathol. 2000;80:779–81. doi: 10.1038/labinvest.3780081. [DOI] [PubMed] [Google Scholar]
- 7.Shi L, Fujioka K, Sun J, et al. A modified system for analyzing ionizing radiation-induced chromosome abnormalities. J Radiat Res. 2012;177:533–8. doi: 10.1667/rr2849.1. [DOI] [PubMed] [Google Scholar]
- 8.Boei JJ, Vermeulen S, Fomina J, Natarajan AT. Detection of incomplete exchanges and interstitial fragments in X-irradiated human lymphocytes using a telomeric PNA probe. Int J Rad Biol. 1998;73:599–603. doi: 10.1080/095530098141843. [DOI] [PubMed] [Google Scholar]
- 9.Cornforth M, Bedford J. A quantitative comparison of potentially lethal damage repair and the rejoining of interphase chromosome breaks in low passage normal human fibroblasts. Rad Res. 1987;111:385–405. [PubMed] [Google Scholar]
- 10.Mühlmann-Díaz M, Bedford J. Comparison of gamma-ray-induced chromosome ring and inversion frequencies. Rad Res. 1995;143:175–80. [PubMed] [Google Scholar]
- 11.Boei JJ, Vermeulen S, Natarajan AT. Analysis of radiation-induced chromosomal aberrations using telomeric and centromeric PNA probes. Int J Rad Biol. 2000;76:163–7. doi: 10.1080/095530000138817. [DOI] [PubMed] [Google Scholar]
- 12.Natarajan AT, Boei JJ. Formation of chromosome aberrations: insights from FISH. Mutation Res. 2003;544:299–304. doi: 10.1016/j.mrrev.2003.09.005. [DOI] [PubMed] [Google Scholar]
- 13.Garty G, Karam A, Brenner DJ. Infrastructure to support ultra high throughput biodosimetry screening after a radiological event. Int J Rad Biol. 2011;87:754–65. doi: 10.3109/09553002.2011.583317. [DOI] [PMC free article] [PubMed] [Google Scholar]
- 14.Hausmann M, Winkler R, Hildenbrand G, et al. COMBO-FISH: specific labeling of nondenatured chromatin targets by computer-selected DNA oligonucleotide probe combinations. BioTechniques. 2003;35:564–70. doi: 10.2144/03353rr03. 572–567. [DOI] [PubMed] [Google Scholar]


