Abstract
Introduction: Small cell lung cancer (SCLC) is an aggressive form of lung cancer with poor prognosis. Adequate staging and therapeutic evaluation is necessary for therapy planning. Fluorodeoxyglucose (FDG)-positron emission tomography (PET)/computed tomography (CT) has been shown to be useful for staging and therapy response evaluation. The European Organization for Research and Treatment of Cancer (EORTC) and Positron Emission Tomography Response Criteria In Solid Tumors (PERCIST) criteria were compared in the evaluation of response assessment and prognostic factors were defined in a cohort of SCLC patients. Methods: Twenty-nine consecutive patients with SCLC were included in this study. Sixteen patients had extensive disease and 13 had limited disease. All patients had chemotherapy, 21 had thoracic radiotherapy. FDG-PET/CT scans were performed before and after therapy to evaluate treatment response. Metabolic responses were assessed using the EORTC criteria and PERCIST criteria. Univariate and multivariate analysis were performed using a Cox model to investigate the association between progression-free and overall survival time with a number of covariates. Results: There was perfect concordance between the EORTC and PERCIST criteria. Eight patients had a complete metabolic response (CMR), 9 had a partial metabolic response (PMR), 5 had stable metabolic disease (SMD) and 7 had progressive metabolic disease (PMD). Overall survival time in patients with CMR was significantly longer compared with patients who did not have CMR. The initial or delayed CMR and post-therapeutic standardized uptake value corrected for lean body mass were significantly associated with overall survival. Conclusion: CMR on post-therapeutic FDG-PET/CT in patients with SCLC is an important prognostic factor and may help decision making for therapeutic management.
Keywords: Small cell lung cancer, FDG-PET/CT, prognosis, therapy, EORTC, PERCIST
Introduction
Lung cancer is the leading cause of cancer death in the United States for men and women. The estimated number of new cases in 2010 was 222,520[1]. Ten to 15% of lung cancers are small cell lung cancers (SCLC). SCLC is more aggressive than non-small cell lung cancer (NSCLC) and requires a dedicated therapeutic approach. Initial staging with fluorodeoxyglucose (FDG)-positron emission tomography (PET)/computed tomography (CT) is sensitive and specific for SCLC except for the assessment of brain metastases. It also leads to improve patient management compared with conventional imaging[2]. SCLC is classified as limited disease (LD) or extensive disease (ED). Therapy consists of combined chemotherapy and thoracic radiotherapy (TRT) for patients with LD and systemic chemotherapy for patients with ED. SCLC is chemosensitive and most patients show clear response to therapy. Unfortunately, most patients relapse soon after the end of therapy. The accurate assessment of response to therapy is essential for identifying non-responders and avoiding inefficient therapy and its potential side effects. Identification of patients who are more likely to relapse can lead to further treatment such as consolidation therapy or closer follow-up.
The 2 most widely used sets of criteria to evaluate response to therapy with FDG-PET in solid tumours are the European Organization for Research and Treatment of Cancer (EORTC) criteria, based on the standardized uptake value (SUV), which has become the standard for assessment of metabolic tumour response and follow-up in solid tumours since 1999[3], and the Positron Emission Tomography Response Criteria In Solid Tumors (PERCIST) criteria, described by Wahl et al.[4] in 2009. PERCIST criteria are based on a combination of the radiologic Response Evaluation Criteria In Solid Tumors (RECIST) criteria[5], and the EORTC criteria with the difference that SUV should be corrected for lean body mass (SUL or SUV lean body mass). Both of these criteria allow the measurement of tumoural response in the absence of anatomic change through assessment of metabolic activity.
We have compared the EORTC and PERCIST criteria in a population of SCLC patients and assessed how metabolic response was associated with progression-free survival and overall survival.
Materials and methods
Patients
Twenty-nine consecutive patients with SCLC referred to the lung cancer multidisciplinary meeting of the Limoges University Hospital were included retrospectively. All patients had undergone at least 2 FDG-PET/CT examinations (PET 1 and PET 2) between October 2005 and July 2010. The patient characteristics including age, disease stage, treatment and response to therapy are summarized in Table 1.
Table 1.
Summary of patient characteristics
| Patient no. | Gender | Age (years) | Stage | Metastasis | Chemotherapy | TRT before PET 2 | EORTC response | PERCIST response | Progression-free survival (days) | Overall survival (days) | Death |
|---|---|---|---|---|---|---|---|---|---|---|---|
| 1 | M | 80 | LD | NM | CP | x | PMR | PMR | 340 | 424 | – |
| 2 | F | 61 | ED | B | EP | – | PMR | PMR | 360 | 420 | – |
| 3 | M | 65 | LD | NM | EP | – | PMD | PMD | 88 | 307 | x |
| 4 | M | 62 | ED | NM, L, B, A | EP | – | SMD | SMD | 198 | 198 | – |
| 5 | M | 62 | ED | NM, L, B | EP | – | PMR | PMR | 188 | 408 | x |
| 6 | M | 48 | ED | NM, L, B | EP | – | PMD | PMD | 224 | 329 | – |
| 7 | M | 57 | LD | B | EP | x | CMR | CMR | 381 | 675 | x |
| 8 | M | 52 | LD | NM | EP | x | PMR | PMR | 328 | 500 | x |
| 9 | F | 60 | ED | NM, L, B | EP | – | SMD | SMD | 202 | 225 | x |
| 10 | F | 55 | ED | NM | EP | – | PMR | PMR | 160 | 160 | – |
| 11 | M | 66 | LD | NM | CAV | x | PMD | PMD | 79 | 162 | x |
| 12 | M | 66 | LD | – | CP | x | PMD | PMD | 160 | 347 | – |
| 13 | M | 54 | LD | NM | EP | x | PMR | PMR | 1028 | 1566 | – |
| 14 | F | 51 | LD | – | EP | x | SMD | SMD | 1363 | 1363 | – |
| 15 | M | 71 | LD | NM | EP | x | SMD | SMD | 360 | 1163 | x |
| 16 | F | 76 | ED | A | EP | – | PMR | PMR | 265 | 265 | – |
| 17 | M | 51 | LD | – | EP | x | CMR | CMR | 1241 | 1241 | – |
| 18 | M | 59 | LD | – | EP | x | CMR | CMR | 1386 | 1386 | – |
| 19 | M | 43 | LD | – | CP | x | CMR | CMR | 513 | 590 | x |
| 20 | M | 76 | LD | – | EP | x | CMR | CMR | 1344 | 1344 | – |
| 21 | F | 61 | ED | A | EP | x | PMD | PMD | 234 | 711 | x |
| 22 | F | 48 | LD | – | EP | x | CMR | CMR | 260 | 260 | – |
| 23 | M | 52 | ED | NM, L, B | EP | – | PMD | PMD | 158 | 201 | x |
| 24 | M | 69 | ED | L, B | EP | – | SMD | SMD | 167 | 251 | – |
| 25 | F | 51 | ED | B | EP | – | PMR | PMR | 151 | 405 | x |
| 26 | M | 55 | LD | NM | EP | x | PMD | PMD | 264 | 557 | – |
| 27 | M | 51 | LD | – | EP | x | CMR | CMR | 1615 | 1615 | – |
| 28 | F | 62 | ED | L | EP | x | CMR | CMR | 465 | 1149 | – |
| 29 | F | 65 | ED | NM, L | CAV | x | PMR | PMR | 209 | 408 | x |
A, adrenal gland; B, bone; NM, nodal metastasis; L, liver; EP, etoposide and cisplatin; CAV, cyclophosphamide, adriamycin and vincristine; CMR, complete metabolic response; PMR, partial metabolic response; SMD, stable metabolic disease; PMD, progressive metabolic disease.
Therapy
All patients received chemotherapy. Twenty-four patients (82.8%) had first-line chemotherapy with cisplatin and etoposide (EP) with an average of 4.2 cycles. Four patients started EP before PET 1. Three patients (10.3%) had an average of 3 cycles of carboplatin and etoposide (CP) between PET 1 and PET 2. Two patients (6.9%) had cyclophosphamide, adriamycin and vincristine (CAV) as a second-line chemotherapy. They were considered as having achieved full remission previously.
Twenty-one patients (72.4%) had TRT with an average dose of 54 Gy. Sixteen patients (55.2%) had TRT between PET 1 and PET 2, 2 patients (those who were treated by CAV) before PET 1 and 3 patients (10.3%) had TRT after PET 2. Twelve patients (41.4%) had prophylactic cerebral radiotherapy with an average dose of 24 Gy. Eight patients did not have TRT, 7 because of ED and 1 because of a tumour that was considered too large to benefit from TRT.
Two patients had surgery after PET 2: 1 had a right medial lobectomy for persistence of an isolated metabolically active tumour after chemotherapy, and the other patient had a surrenalectomy for an isolated adrenal gland recurrence.
FDG-PET/CT acquisition
PET/CT was performed on a Biograph 6 (Siemens Medical Solution, Erlangen, Germany). Patients rested for 80 min before scanning. Injected activity was 5.55 MBq/kg. Time per bed position was 3 min, CT slice thickness was 3 mm. Ninety-three PET/CT scans were performed, with an average of 3.1 PET/CT scans per patient (range 2–8). For each patient, only the first and second PET were used to determine the metabolic response with the EORTC and PERCIST criteria. The average interval between PET 1 and PET 2 was 5.9 months (range 4.3–7.5 months and median 5.2 months).
Image interpretation
FDG-PET/CT scans were interpreted by 2 experienced blinded nuclear medicine physicians. PET 1 and PET 2 were compared for each patient using the EORTC and the PERCIST criteria.
Analysis according to the EORTC criteria
Visual analysis and quantitative measures using the maximum SUV (SUVmax) on the main tumoural targets were performed according to EORTC guidelines. For each target lesion the SUVmax variation between PET 1 and PET 2 was calculated. Responses to therapy were defined as: complete metabolic response (CMR), partial metabolic response (PMR), stable metabolic disease (SMD) and progressive metabolic disease (PMD). According to EORTC criteria[3], PMD was defined as an increase in SUV >25% within the tumour region defined on the baseline scan, a visible increase in the extent of FDG tumour uptake (20% in the longest dimension) or the appearance of new FDG uptake in metastatic lesions. SMD was defined as an increase in tumour FDG SUV <25% and no visible increase in extent of FDG tumour uptake (20% in the longest dimension). PMR was defined as a reduction >25% after more than 1 treatment cycle. CMR was defined as complete resolution of FDG uptake within the tumour volume so that it was indistinguishable from surrounding normal tissue.
Analysis according to PERCIST criteria
Quantitative measures of SULpeak were calculated according to the PERCIST criteria[6]. Briefly, a CMR was defined as visual disappearance of all metabolically active tumour. A PMR was defined as more than a 30% and a 0.8-unit decrease in SULpeak between the most intense lesion before treatment and the most intense lesion after treatment, although not necessarily the same lesion. More than a 30% and 0.8-unit increase in SULpeak or new lesions, if confirmed, was defined as PMD. SULpeak and SULtotal (sum of SUL for 1–5 lesions) variations between PET 1 and PET 2 were calculated.
Delayed CMR
Delayed CMR was defined as CMR after second-line chemotherapy.
Selection of predictor variables
Predictor variables studied for their potential impact on prognosis were the usual factors such as age, gender, metastasis state, stage or SUV, and first time tested covariates in SCLC such as SUL and types of response according to EORTC and PERCIST evaluation criteria.
Statistical analysis and grouping of responses
Statistical analysis was performed with Medcalc® (Mariakerke, Belgium) version 11.3.6 software. First, a kappa test[6] was performed to measure the intra-observer and inter-observer concordance for metabolic response (i.e. CMR, PMR, SMD and PMD) between the EORTC and PERCIST criteria. Second, the effect of different metabolic responses (studied as CMR, PMR, SMD and PMD) on overall survival was investigated using Kaplan–Meier plots, unadjusted for covariates and groups were compared using the log-rank test. Third, the effects of metabolic responses adjusted for predictor covariates on progression-free and overall survival were investigated using the Cox proportional hazard model; covariates were investigated in univariate analysis and those associated with a P value < 0.1 were included in the multivariate analysis. The significance of the covariates in the final model was tested by a backward stepwise process using the likelihood ratio to evaluate the effect of omitting the variables. In the final model, a P value <0.05 was considered significant.
If no statistical differences between metabolic responses were found (e.g. PMD vs PMR), clinically relevant groups of responses were compared (e.g. CMR vs non-CMR).
Results
The average follow-up time was 21.4 months (range 5.3–53 months). The follow-up was based on clinical and imaging data. The duration of overall survival was calculated from the time of PET 1.
Comparison of EORTC and PERCIST criteria
For intra-observer concordance, both observers found no disagreement between the EORTC and PERCIST criteria (κ = 1). For inter-observer concordance, there was one disagreement between the 2 observers out of 29 comparisons with the EORTC and PERCIST criteria (κ = 0.910 ± 0.087). After review by a third observer, it was found that one of the observers had made a calculation mistake. Eight patients had a CMR, 9 had a PMR, 5 had SMD and 7 had PMD.
Progression-free survival
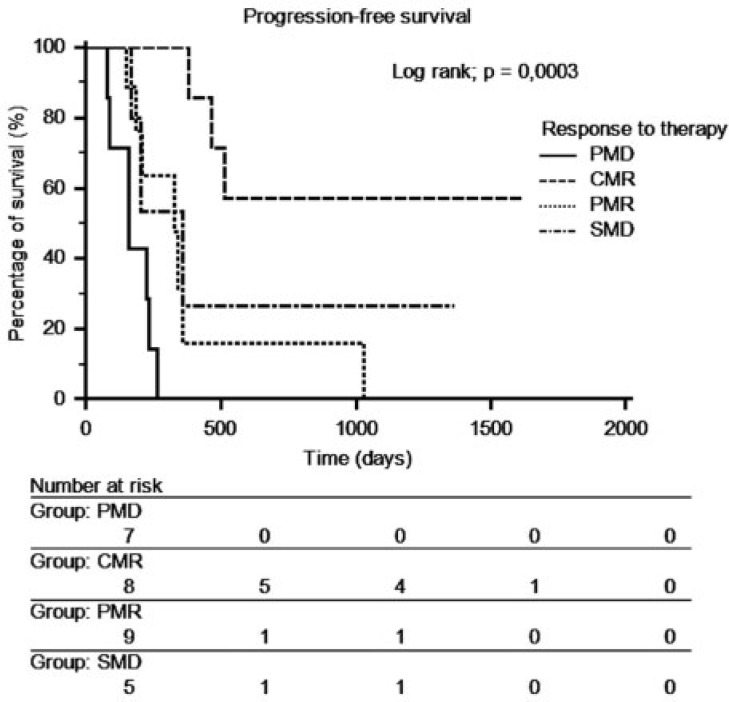
The median progression-free survival was 8.3 months (range 2.3–53.1 months). Twenty patients had disease progression during follow-up. Progression occurred between 2.6 and 34.2 months after PET 1. Nine patients (31%) showed no sign of progression by the end of follow-up (average follow-up time was 21.4 months). The median time to progression was: 6.6 months for patients with SMD (range 5.5–44.8 months), 8.7 months for patients with PMR (range 5.0–33.8 months) and 28.8 months for patients with CMR (range 8.6–53.1 months).
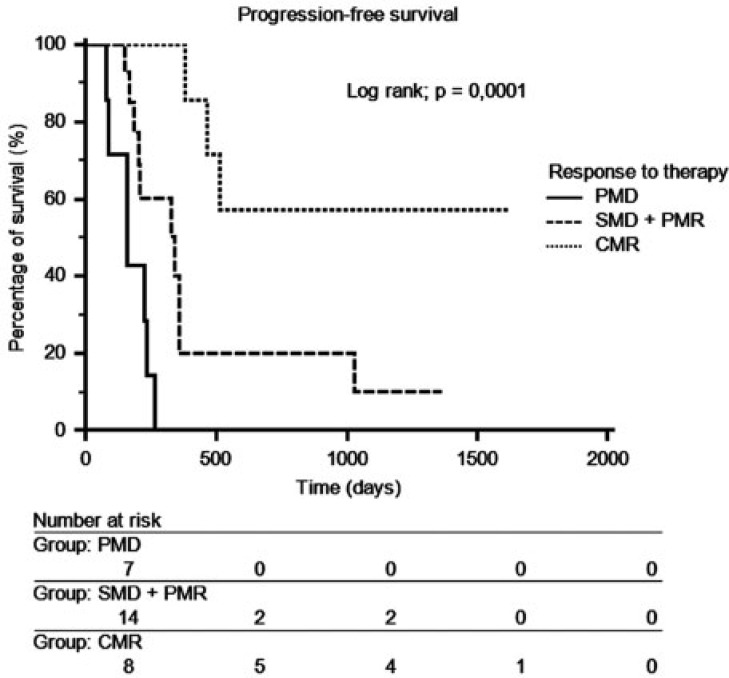
There was a significant difference in progression-free survival between patients in CMR and patients in PMD (P = 0.0003). Because there was no significant difference in progression-free survival between the PMR and the SMD groups (Fig. 1), a new group called SMD + PMR including SMD and PMR was created. The median time of progression was 7.8 months (range 5.0–44.8 months). There was a significant difference (P = 0.0001) in progression-free survival between the 3 groups (CMR, SMD + PMR, PMD) (Fig. 2).
Figure 1.
Progression-free survival curves depending on response to therapy on FDG-PET/CT.
Figure 2.
Progression-free survival depending on response to therapy on FDG-PET/CT for the 3 groups CMR, SMD + PMR and PMD.
Table 2 lists the effects of different covariates on progression-free survival with univariate and multivariate analysis.
Table 2.
Effects of different covariates on progression-free survival
| Covariates | Relative risk | Confidence interval | P |
|---|---|---|---|
| Univariate analysis | |||
| SULtotal | 1.0510 | 1.0200–1.0829 | 0.0012 |
| SUVmax | 1.1069 | 1.0413–1.1768 | 0.0012 |
| CMR | 0.1580 | 0.0447–0.5583 | 0.0044 |
| Number of lesions | 1.0722 | 1.0214–1.1254 | 0.0050 |
| Bone metastases | 3.3701 | 1.2746–8.9108 | 0.0148 |
| Presence of metastases | 3.1435 | 1.1888–8.3124 | 0.0216 |
| Liver metastases | 3.2010 | 1.1791–8.6898 | 0.0231 |
| ED vs LD | 2.8198 | 1.0866–7.3181 | 0.0340 |
| Age | 1.0150 | 0.9724–1.0594 | 0.4986 |
| PMR | 1.2264 | 0.4660–3.2274 | 0.6809 |
| SMD | 0.9350 | 0.2746–3.1831 | 0.9148 |
| Gender | 0.9987 | 0.3815–2.6146 | 0.9979 |
| Multivariate analysis | |||
| CMR | 0.2069 | 0.0540–0.7923 | 0.0221 |
| Presence of metastases | 3.0456 | 1.0661–8.7002 | 0.0386 |
| SULtotal | 1.0305 | 0.9975–1.0646 | 0.0719 |
Overall survival
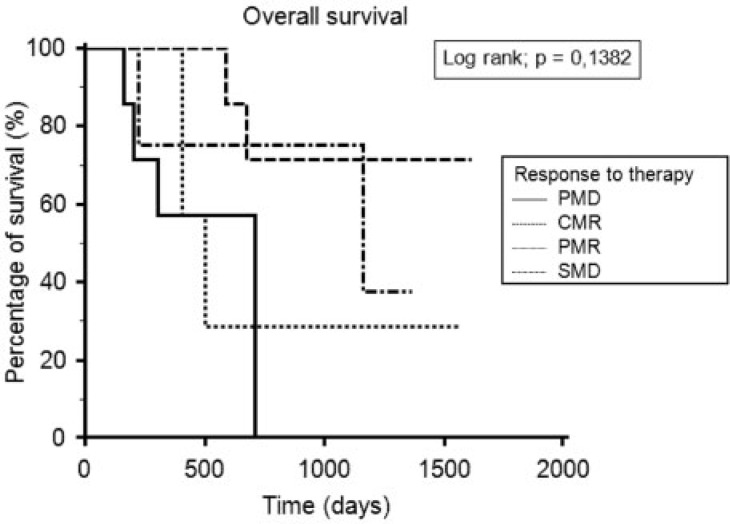
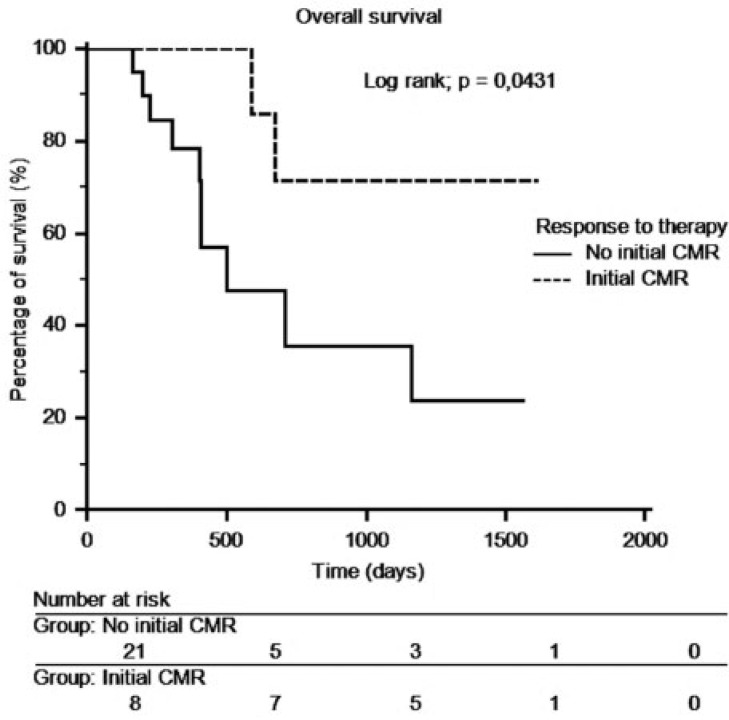
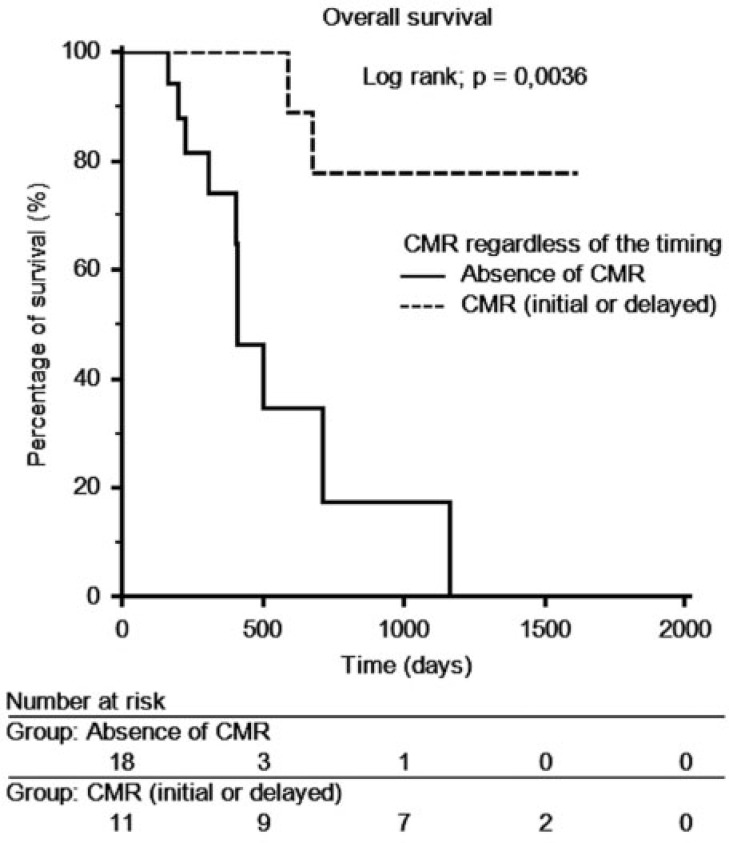
At the end of follow-up, 17 patients were still alive and 12 had died. The median overall survival time was 13.8 months (range 5.2–53.1 months). The median overall survival was 10.8 months (range 5.3–20.4) for PMD patients, 8.3 months (range 6.5–44.8 months) for SMD patients, 13.4 months (range 5.2–51.5 months) for PMR patients and 39.3 months (range 8.6–53.1 months) for CMR patients. Kaplan–Meier curves did not show a significant difference between the 4 groups (Fig. 3). A new group called non-CMR including PMR, SMD and PMD was created. The median overall survival period was 13.3 months (range 5.3–51.5 months). There was a significant difference in the overall survival between the 2 groups (CMR and non-CMR). CMR patients lived significantly longer than non-CMR patients (P = 0.0431) (Fig. 4). After an analysis of patients with overall survival longer than 1000 days who were not in CMR on PET 2, we showed that 2 of these 3 patients were in CMR on a later PET/CT scan. These CMRs occurred after a series of 3 new cycles of the same chemotherapy. A new Kaplan–Meier curve was generated for patients in CMR, regardless of the timing of the CMR. This curve showed a longer overall survival time for patients with CMR compared with patients with non-CMR (P = 0.0036) (Fig. 5).
Figure 3.
Overall survival depending on the metabolic response.
Figure 4.
Overall survival depending on the presence of initial CMR on FDG-PET/CT.
Figure 5.
Overall survival depending on the presence of CMR on FDG-PET/CT regardless of the timing of CMR.
Effects of different covariates on overall survival
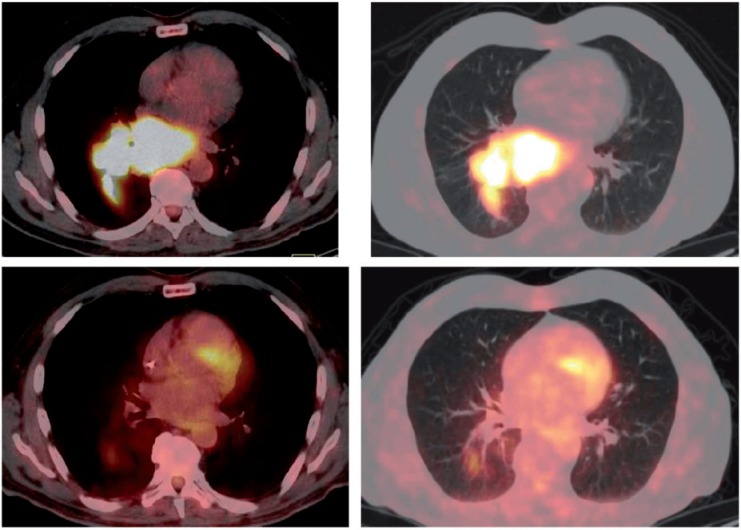
Univariate and multivariate analysis showed that initial or delayed CMR (P = 0.0072) and post-therapeutic SULtotal (P = 0.0365) were significantly associated with overall survival. A Fisher exact test showed that initial and delayed CMR were not independent (P < 0.0001). Only the delayed CMR was included in the multivariate analysis. Table 3 lists the effects of different covariates on overall survival. Fig. 6 shows an example of PET/CT findings before and after therapy in a patient showing CMR.
Table 3.
Effects of different covariates on overall survival
| Covariates | Relative risk | Confidence interval | P |
|---|---|---|---|
| Univariate analysis | |||
| Initial or delayed CMR | 0.1033 | 0.0212–0.5039 | 0.0052 |
| SULtotal | 1.0509 | 1.0105–1.0930 | 0.0135 |
| Bone metastases | 4.4438 | 1.2266–16.0992 | 0.0239 |
| SUVmax | 1.0868 | 1.0031–1.1774 | 0.0429 |
| Presence of metastases | 3.3590 | 0.9697–11.6355 | 0.0572 |
| Initial CMR | 0.2306 | 0.0496–1.0722 | 0.0627 |
| PMD | 3.2099 | 0.9201–11.1986 | 0.0688 |
| Liver metastases | 2.9000 | 0.8246–10.1987 | 0.0987 |
| Number of lesions | 1.0592 | 0.9829–1.1415 | 0.1337 |
| ED vs LD | 2.4348 | 0.7299–8.1221 | 0.1498 |
| Gender | 0.8259 | 0.2476–2.7546 | 0.7568 |
| PMR | 1.1910 | 0.3138–4.5197 | 0.7983 |
| Age | 0.9958 | 0.9358–1.0597 | 0.8949 |
| SMD | 1.0039 | 0.2170–4.6432 | 0.9961 |
| Multivariate analysis | |||
| Initial or delayed CMR | 0.1030 | 0.0198–0.5356 | 0.0072 |
| SULtotal | 1.0461 | 1.0030–1.0911 | 0.0365 |
Figure 6.
Patient presenting with a large right hilar mass and large mediastinal lymphadenopathy in the posterior mediastinum including the subcarinal region had CMR to therapy. (Top row) Baseline axial view of SCLC in the soft tissue and parenchymal lung CT windows. (Bottom row) Post-therapy scan, axial view of the same slice as the baseline scan in soft tissue and parenchymal lung CT windows.
Discussion
In our population of 29 patients with SCLC, 2 experienced nuclear medicine physicians found excellent concordance between the EORTC and PERCIST criteria. To our knowledge, this is the first study to compare the EORTC and PERCIST criteria for the assessment of therapy response. In the era of personalized medicine and targeted therapy, there is a need to find the most robust, accurate and reproducible tools to evaluate therapeutic response. This study is a first step in this direction because it shows that the use of the EORTC and PERCIST criteria leads to identical assessment of therapeutic response in a population of 29 patients with SCLC. The EORTC criteria were first described in 1999, and have been used and studied since then and are recognized criteria. The PERCIST criteria are more recent and have not been validated by large prospective studies. The perfect agreement we have shown in this study is a first step towards validating the PERCIST criteria. However, is there a need for multiple criteria, especially if they yield the same results. The nuclear medicine community might benefit more from one widely accepted set of criteria to assess metabolic response to therapy, especially given its growing importance.
The major finding in our study is that the overall survival was longer in patients with CMR compared with patients with non-CMR. Survival time was nearly 3 times as long in patients showing CMR on PET/CT as in patients showing any other response. Progression-free survival was also significantly longer in the CMR group. What is particularly interesting is that our population was very heterogeneous in terms of therapy conditions. Some patients started chemotherapy before PET 1, some patients had chemotherapy and TRT between PET 1 and PET 2 and other patients had chemotherapy alone between PET 1 and PET 2. Furthermore different chemotherapy regimens were used. Despite this marked therapeutic heterogeneity, patients with CMR lived significantly longer than patients who were not in CMR after treatment. Patients who achieved CMR after failing or relapsing after first-line chemotherapy had prolonged survival times.
To our knowledge, 4 previous reports have assessed metabolic therapeutic responses with FDG-PET in SCLC. Azad et al.[7] evaluated the response to therapy in 46 patients with SCLC on the basis of the extent of the disease (LD and ED) before and after therapy. Patients who remained in the LD stage after therapy had longer survival rates than patients who went from LD to ED. Patients who went from ED to LD during therapy had longer survival times than patients who remained in ED. Yamamoto et al.[8] studied 12 patients with SCLC with early and late FDG-PET to evaluate therapeutic responses. Change in SUVmax was used to define responders and non-responders. Eleven of the 12 patients were responders. The number of patients included in the study was too small to associate metabolic responses with survival rates. Onitilo et al.[4] evaluated the prognostic value of post-treatment FDG-PET in 22 patients with LD SCLC. Within 4 months of the end of chemotherapy, the patients had a post-treatment PET scan. The interpretation consisted of visual analysis or SUV-based analysis with SUVmax >2.5 considered positive. Progression-free survival was significantly longer for PET-negative patients than for PET-positive patients. Although not statistically significant, the estimated average survival time for the PET-negative patients (29.2 months) was longer than for the PET-positive patients (10.3 months). Fischer et al.[9] prospectively investigated 20 patients using PET/CT; the CT was diagnostic and contrast-enhanced. Therapeutic response was evaluated on CT according to the RECIST criteria and on PET/CT, according to the criteria described by MacManus et al.[10]. Metabolic changes on PET were significantly correlated with changes in size on CT. No difference was found between a visual and a semi-quantitative analysis on the PET data.
Our study is the first to use standardized criteria to assess therapy response in patients with SCLC. Although the 4 reports mentioned earlier found better survival in patients who had a metabolic response on FDG-PET, the criteria used were different in each study, thus limiting the power of potential comparisons and future meta-analyses.
We found that CMR (whether initial or delayed) was an independent prognostic factor, significantly associated with overall survival. To our knowledge, this study is the first to investigate metabolic responses as a prognostic factor in patients with SCLC. A high post-therapeutic SULtotal value also identified patients with a worse prognosis. FDG-PET/CT could have a role in the identification of patients who would benefit from more aggressive therapy, particularly if they present with LD. However, CMR is a qualitative finding. It is not clear how useful quantitative assessment of response to therapy with EORTC and PERCIST criteria is in this patient population as there was no significant difference in overall survival between the PMR, SMD and PMD groups.
Previous reports have mentioned the prognostic value of FDG-PET in patients with SCLC. Lee et al.[11] reported that tumour metabolic activity as estimated by SUVmax was a significant prognostic factor, capable of identifying subgroups of patients with a worse prognosis. Pandit et al.[12] evaluated 46 patients with SCLC with FDG-PET, including 38 patients treated for detection of recurrent or residual disease. Patients with a negative PET scan had significantly longer survival time than patients with a positive scan
One of the main limitations of our study is the small size of the patient population. SCLC is not as frequent as NSCLC and the value of FDG-PET/CT in this indication has not been studied as extensively; and it is more difficult to conduct large prospective trials. Another important limitation is the therapeutic heterogeneity in terms of different chemotherapy regimens, combination of chemotherapy and TRT and the timing of therapy relative to PET scanning. This is a frequent pitfall in retrospective studies, probably made more acute here by the aggressiveness of SCLC and the limited efficacy of the available treatments. Despite this heterogeneity, this study reveals important findings, in particular the strong prognostic role of CMR irrespective of treatment. The available literature also seems to indicate that FDG-PET/CT may have a role in patient management for therapeutic assessment and follow-up in patients with SCLC. These findings need to be validated by a large prospective trial.
Conclusions
Perfect concordance was achieved between the EORTC and PERCIST criteria. Complete metabolic response on post-therapeutic FDG-PET/CT in patients with SCLC is an important prognostic factor and may help decision making for therapeutic management. Subcategorizing patients who are not in CMR (in PMR, SMD and PMD) does not seem to have prognostic value.
Conflict of interest
T. Wagner has worked as a consultant for IBA pharmaceutical company. The other authors do not have any conflicts of interest.
Acknowledgements
No funding was provided for this work.
Footnotes
This paper is available online at http://www.cancerimaging.org. In the event of a change in the URL address, please use the DOI provided to locate the paper.
References
- 1.Jemal A, Siegel R, Xu J, Ward E. Cancer statistics, 2010. CA Cancer J Clin. 2010;60:277–300. doi: 10.3322/caac.20073. . PMid:20610543. [DOI] [PubMed] [Google Scholar]
- 2.Brink I, Schumacher T, Mix M, et al. Impact of [18F]FDG-PET on the primary staging of small-cell lung cancer. Eur J Nucl Med Mol Imaging. 2004;31:1614–1620. doi: 10.1007/s00259-004-1606-x. . PMid:15258700. [DOI] [PubMed] [Google Scholar]
- 3.Young H, Baum R, Cremerius U, et al. Measurement of clinical and subclinical tumour response using[18F]-fluorodeoxyglucose and positron emission tomography: review and 1999 EORTC recommendations. European Organization for Research and Treatment of Cancer (EORTC) PET Study Group. Eur J Cancer. 1999;35:1773–1782. doi: 10.1016/S0959-8049(99)00229-4. . PMid:10673991. [DOI] [PubMed] [Google Scholar]
- 4.Wahl RL, Jacene H, Kasamon Y, Lodge MA. From RECIST to PERCIST: evolving considerations for PET response criteria in solid tumors. J Nucl Med. 2009;50:122S–150S. doi: 10.2967/jnumed.108.057307. . PMid:19403881. [DOI] [PMC free article] [PubMed] [Google Scholar]
- 5.Eisenhauer E, Therasse P, Bogaerts J, et al. New response evaluation criteria in solid tumours: Revised RECIST guideline (version 1.1) Eur J Cancer. 2009;45:228–247. doi: 10.1016/j.ejca.2008.10.026. . PMid:19097774. [DOI] [PubMed] [Google Scholar]
- 6.Bergeri I, Michel R, Boutin JP. [Everything (or almost everything) about the Kappa coefficient] Med Trop (Mars) 2002;62:634–636 (in French). [PubMed] [Google Scholar]
- 7.Azad A, Chionh F, Scott AM, et al. High impact of 18F-FDG-PET on management and prognostic stratification of newly diagnosed small cell lung cancer. Mol Imaging Biol. 2010;12:443–451. doi: 10.1007/s11307-009-0295-z. . PMid:19921339. [DOI] [PubMed] [Google Scholar]
- 8.Yamamoto Y, Kameyama R, Murota M, Bandoh S, Ishii T, Nishiyama Y. Early assessment of therapeutic response using FDG PET in small cell lung cancer. Mol Imaging Biol. 2009;11:467–472. doi: 10.1007/s11307-009-0227-y. . PMid:19434460. [DOI] [PubMed] [Google Scholar]
- 9.Fischer BM, Mortensen J, Langer SW, et al. PET/CT imaging in response evaluation of patients with small cell lung cancer. Lung Cancer. 2006;54:41–49. doi: 10.1016/j.lungcan.2006.06.012. . PMid:16919841. [DOI] [PubMed] [Google Scholar]
- 10.Mac Manus MP, Hicks RJ, Matthews JP, et al. Positron emission tomography is superior to computed tomography scanning for response-assessment after radical radiotherapy or chemoradiotherapy in patients with non–small-cell lung cancer. J Clin Oncol. 2003;21:1285–1292. doi: 10.1200/JCO.2003.07.054. . PMid:12663716. [DOI] [PubMed] [Google Scholar]
- 11.Lee YJ, Cho A, Cho BC, et al. High tumor metabolic activity as measured by fluorodeoxyglucose positron emission tomography is associated with poor prognosis in limited and extensive stage small-cell lung cancer. Clin Cancer Res. 2009;15:2426–2432. doi: 10.1158/1078-0432.CCR-08-2258. . PMid:19318478. [DOI] [PubMed] [Google Scholar]
- 12.Pandit N, Gonen M, Krug L, Larson SM. Prognostic value of [18F]FDG-PET imaging in small cell lung cancer. Eur J Nucl Med Mol Imaging. 2003;30:78–84. doi: 10.1007/s00259-002-0937-8. . PMid:12483413. [DOI] [PubMed] [Google Scholar]


