Abstract
Computational modeling of cardiac electrophysiology is a powerful tool for studying arrhythmia mechanisms. In particular, cardiac models are useful for gaining insights into experimental studies, and in the foreseeable future they will be used by clinicians to improve therapy for the patients suffering from complex arrhythmias. Such models are highly intricate, both in their geometric structure and in the equations that represent myocyte electrophysiology. For these models to be useful in a clinical setting, cost-effective solutions for solving the models in real time must be developed. In this work, we hypothesized that low-cost GPGPU-based hardware systems can be used to accelerate arrhythmia simulations. We ported a two dimensional monodomain cardiac model and executed it on various GPGPU platforms. Electrical activity was simulated during point stimulation and rotor activity. Our GPGPU implementations provided significant speedups over the CPU implementation: 18X for point stimulation and 12X for rotor activity. We found that the number of threads that could be launched concurrently was a critical factor in optimizing the GPGPU implementations.
I. Introduction
Each year approximately 300,000 people in the US die suddenly of a cardiac arrhythmia. Patients with arrhythmias are typically treated with pharmaceutical and/or ablation therapies. Cardiac ablations are conducted using a catheter that delivers radio frequency energy to sites in the heart to kill tissue from which an arrhythmia originates. To identify these ablation sites, cardiac mapping systems calculate local depolarization times by recording extracellular potentials (electrograms) from many locations on the endocardial surface, which are rendered as an activation map to show the progression of electrical waves. With activation maps, arrhythmia pathways can be rendered on a realistic geometry of the surface of a patient’s heart. Cardiologists use the maps to guide the ablation to interrupt the pathway and cure the arrhythmia. This type of image-guided therapy has cured many patients suffering from arrhythmias; however, arrhythmias with complex pathways often require multiple ablation procedures which, ultimately, may not be successful.
Computational cardiac modeling provides a powerful approach for improving the efficacy of cardiac ablation therapy. One strategy is to use the data provided by clinical imaging systems, such as electroanatomical mapping or high resolution MRI systems, to build a detailed numerical model of a patient’s heart. A cardiologist could then test an ablation procedure using the model to determine if it would successfully interrupt an arrhythmia pathway to cure the arrhythmia. If the model does not indicate therapy success, then alternate ablation strategies could be explored using the model.
To accomplish this goal, the time required to solve cardiac models must be significantly reduced; especially if the model is to be solved multiple times to optimize an ablation strategy. This requirement demands vast computational resources that are currently only provided by supercomputers, which typically entail high cost and strict physical constraints (e.g., space and energy).
Recent developments in the field of high performance computing have leveraged the computational capabilities of General-Purpose Graphics Processing Units (GPGPUs), which have been extensively used in many research fields, e.g., bioinformatics, signal processing, astronomy, weather forecasting, and molecular modeling. For cardiac models, parallel computations of ionic currents at a large number of model nodes using GPGPUs shall provide significant performance improvements over that of traditional processors (CPUs). Previous work showed that, running on an Xbox, a GPGPU implementation of a cardiac tissue model was twice as fast as a CPU, even for a small-scale model [1]. In this paper, we demonstrate that significant speed-ups can be achieved when a cluster of GPGPUs are used to solve a two dimensional monodomain cardiac action potential model.
II. Background
A. GPGPUs
General-Purpose Graphics Processing Units (GPGPUs) achieve high performance through massively parallel processing of hundreds of computing cores. With the help of a parallel programming model, e.g., CUDA (Compute Unified Device Architecture), application developers can take advantage of CUDA-enabled GPUs that are available in desktop and notebook computers, professional workstations, and supercomputer clusters.
B. Cardiac Model
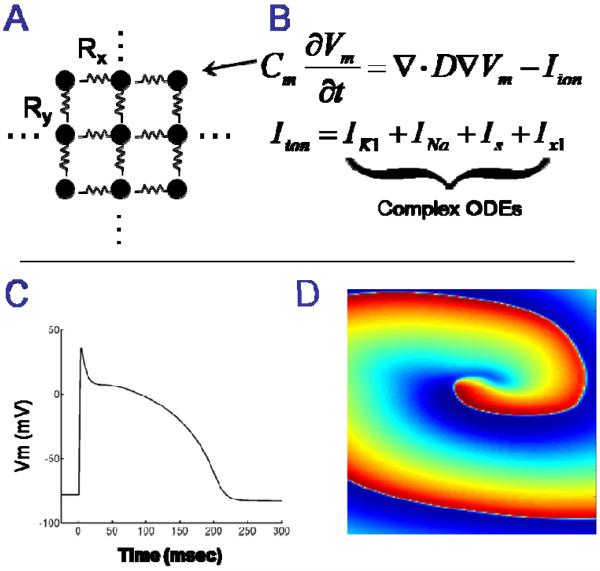
In our cardiac model, transmembrane potential (Vm) at each node in a rectilinear 2D grid was computed using a continuum approach with no-flux boundary conditions and finite difference integration, as we have previously described [2-3]. Although the 2D model is not clinically relevant, it allows us to quickly prototype different techniques that could then be applied to a clinically relevant 3D model. An overview of the model and representative results are shown in Figure 1. The general algorithm for the model is shown in Figure 2. The differential equations were solved independently on a matrix of Nx*Ny nodes at each time step. Therefore, within each time step there is no data inter-dependency, which fits the GPU architecture well – ample opportunities can be exploited for data-level parallelism.
Figure 1.
A: Cardiac muscle is modeled as a large geometrical network of nodes that are electronically coupled. B: The electrical potential of the cell membrane at each node is represented as a large set of differential equations. C: Numerical integration of the differential equations provides transmembrane voltage (action potentials) at each node. D: Spatiotemporal visualization of transmembrane voltage reveals electrophysiological mechanisms of arrhythmias (an electrical rotor is shown).
Figure 2.
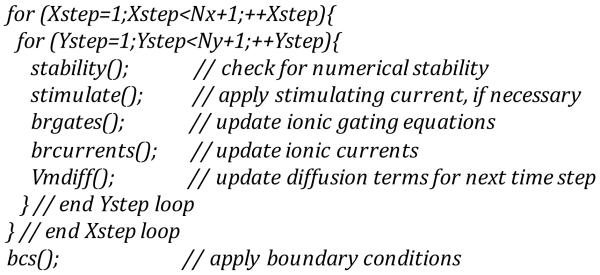
General code that is solved at each time step to compute transmembrane potential (Vm).
Membrane ionic current kinetics (Iion, μA/cm2) are computed using the Drouhard-Roberge formulation of the inward sodium current (INa) [4] and the Beeler-Reuter formulations of the slow inward current (Is), time independent potassium current (IK1), and time-activated outward current (Ix1) [5]. Fiber orientation was 33deg. Diffusion coefficient along fibers was 0.00076 cm2/msec and diffusion across fibers was 0.00038 cm2/msec. Point stimulation and electrical rotor activity were simulated. All simulations were checked for accuracy and numerical stability.
III. GPGPU-based Cardiac Arrhythmia Model
As shown in Figure 2, the general algorithm loops through each node in a 2D grid (Xstep represents the coordinate of the X direction and Ystep the coordinate of the Y direction). Inside the loop, the same set of functions is solved at each node. The temporal loop is outside the nested spatial loops. Because of the sequential structure of the program, large spatial domains and/or long-time simulations require solution times that increase as a factor of domain area.
Typical parallel implementations of N dimensional cardiac models are relatively straightforward because, once the diffusion currents have been computed; there is no data dependency between the neighboring nodes in the grid at any particular time step. Therefore, the differential equations that represent myocyte electrophysiology (the brgates and brcurrents functions) can be solved at each node, in any sequence.
In our GPGPU implementation of the cardiac model, the basic idea is to get rid of the double (Xsteps and Ysteps) inner loops where data parallelism resides and the speedup can be achieved. The outside time loop is impossible for us to eliminate. The GPGPU model works basically the same way as the CPU model but with larger “bandwidth”: thanks to hundreds of cores in a commodity GPGPU, the set of functions could be applied to different nodes in the grid in parallel. Note that GPGPU computing falls into SIMD (Single Instruction Multiple Data) category, which means that the instructions the threads execute are the same but the data processed by these threads belong to different nodes.
We have implemented a model running on GPGPUs that completely eliminates one loop (Xsteps or Ysteps) and reduces the number of iterations in the other. This is done by assigning a number of threads to execute the set of functions on the corresponding grid nodes. Theoretically, the relation between the threads and the nodes is a one-to-one mapping. However, because limited resources (e.g. registers) are available on a GPU card, a large number of threads can only handle a portion (say 30 columns) of grid nodes. The same threads are used again to calculate another portion of the grid after finishing the previous part. It is easy to achieve the assignment of threads using CUDA directives. For example, for the 2D grid containing Nx by Ny nodes, i.e. Nx columns and Ny rows of nodes, we can compute W columns using W*Ny threads. The following CUDA code will accomplish this task.

In the CUDA programming model [6], a GPU device is usually viewed as a grid containing a large amount of equally-shaped blocks, into which the threads are grouped. For the above code, W*Ny threads are grouped into W blocks, each of which contains Ny threads. The parameters of dimGrid and dimBlock define how the blocks (threads) align in the grid (block). Each thread block in the grid executes on a multiprocessor and the threads in the block execute on multiple cores inside the multiprocessor. Such parallel execution of blocks of threads on W columns of data reduces the initial double loops shown in Figure 2 to one small loop as follows.
![]()
Considering multiple threads would concurrently execute the Vmdiff function, serialized execution is needed because each node would update the diffusion terms of the neighbors in this function and eventually multiple threads would be writing to the same memory location. Without serialization, this would potentially lead to data overwritten and incoherence, and as a result, produce incorrect simulation results. To solve this problem, we utilized atomic add operations in the Vmdiff function. Note that normal arithmetic operations are used in other functions, as there are no updates to neighboring nodes. Both GPU cards we used in the experiments support the atomic add operation.
IV. Results
A. Environment
We ran our GPGPU-based model on two different GPU cards and the CPU-based model was run on the respective machines they reside on. The first machine had 4 Intel E5520 2.26GHz Quad Core (total 16 cores) CPUs, 8MB L1 cache and 16GB memory. It also had a Tesla C1060GPU card which contains 30 multiprocessors, each having 8 cores (total 240 cores) and 4GB global memory. The second machine had 2 Intel E5530 2.4GHz Quad Core (total 8 cores) CPUs, with 8MB L1 cache and 24GB memory, as well as a Fermi Tesla C2050 GPU card, which has 14 multiprocessors, each with 32 cores (total 448 cores), and 3GB global memory. The CUDA driver version was 3.1 on Tesla C1060 and 3.2 on Tesla C2050.
B. Scalability and Performance
We report the scalability and performance results for both point stimulation and electrical rotor activity on two GPU cards. Both GPUs ran the same code. We use a well-developed CPU-implementation [3] as the basis for comparison. While we didn’t specifically optimize the CPU code, we feel that our current GPU implementations can be further improved by utilizing shared memory, grouping threads into more blocks, etc. Our GPU implementation is a straightforward port of the CPU implementation.
1. Point stimulation
Table 1 shows the input parameters used for the stimulation of different sizes as well as the runtimes on the two GPU cards. Nx (Ny) in the leftmost column specifies the number of nodes in X (Y) dimension of a grid. The size of the grids we experimented with varied from 64*64 to 448*448.
Table 1. Point Stimulation Input Parameters and Runtime.
| Nx (=Ny) |
dx=dy (mm) |
dt (msecs) |
simulation steps |
C1060 (secs) |
C2050 (secs) |
|---|---|---|---|---|---|
| 64 | 0.3125 | 0.025 | 10,000 | 22 | 15 |
| 128 | 0.15625 | 0.025 | 10,000 | 43 | 27 |
| 256 | 0.078125 | 0.025 | 10,000 | 112 | 89 |
| 320 | 0.0625 | 0.0125 | 20,000 | 302 | 259 |
| 384 | 0.052083 | 0.001 | 250,000 | 4905 | 3763 |
| 448 | 0.041322 | 0.001 | 250,000 | 6382 | 5483 |
In Table 1, dx and dt are spatial and temporal parameters of the cardiac model respectively. The simulated length in x-dimension is Lx (2cm). “dx”, which is equal to dy, is calculated as Lx/Nx and “simulation steps” is calculated as total/dt (total means the overall simulated time is 250msecs). We fed the same input to the model running on CPU and two GPUs and also recorded the execution times for comparison. The last two columns in the table are the runtimes in seconds on the Tesla C1060 GPU and the Tesla C2050 GPU.
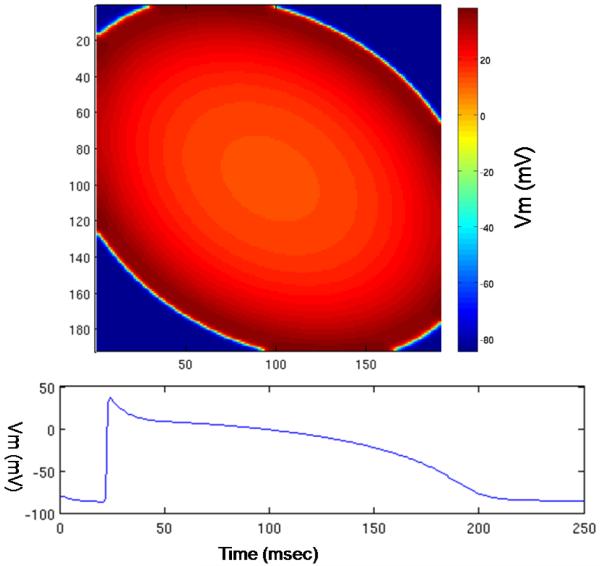
In terms of correctness, the model outputs are identical between the original CPU (sequential) implementation and the GPGPU (parallel) implementation. The voltage curve for each node is similar the one in Figure 1-C. The picture at the top of Figure 3 is a snapshot of the transmembrane potential for sampled nodes in the 2D grid; the grid size is 384*384. The sample interval is one node in both directions of the grid so the coordinates are less than 192. The bottom graph shows the voltage curve of a node at the final stage of simulation. The X axis shows that the total simulated time (in msec) is 250 and the Y axis shows the values of the potential voltage (in mV) during the simulation.
Figure 3.
GPGPU implementation: results of the model for point stimulation. Top: an image of transmembrane potential. Bottom: transmembrane potential for one node.
Figure 4 shows the speedups we achieved on both the Tesla C1060 and the Tesla C2050 over the sequential version. The X axis is the grid size from 64*64 to 448*448, the Y axis is the relative speedup value. One can see that both cards can yield more than 16X speedups running on large input sizes like 384*384 and 448*448. While the sequential model takes one or two days to finish, both GPU models finish in one or two hours. The larger the input size, the larger the speedups we can get from both GPU cards. Note that, as shown in the last two columns in Table 1, the Fermi-architecture Tesla C2060 runs faster than the Tesla C1050 for all input sizes. We stop at the grid size of 448*448 because limited threads could be launched in a thread block, given limited resources (e.g. registers) on the GPU cards. For the 448*448 case, we were able to assign 30 blocks of threads to run the code and each of the 30 blocks contained 448 threads. Our future work will include scaling our model to run with even larger grid sizes.
Figure 4.
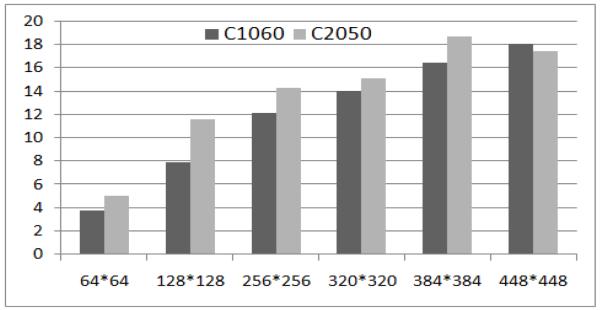
Speedups from Tesla C1060 and Tesla C2050 given different input sizes.
2. Electrical rotor
For the electrical rotor activity, we ran our model with 2D grid size (Nx*Ny) ranging from 256*256 to 448*448. Table 2 displays the input parameters and the run times on two GPUs for these sizes. The input parameters have the same meaning as in Table 1. Here 500msecs is the simulated time and all the dt values are 0.025, so the simulations all took 20,000 steps. Lx, the simulated length, is 10cm.
Table 2. Electrical Rotor Simulation Parameters and Runtime.
| Nx (=Ny) |
dx=dy (mm) |
dt (msecs) |
simulation steps |
C1060 (secs) |
C2050 (secs) |
|---|---|---|---|---|---|
| 256 | 0.390625 | 0.025 | 20,000 | 223 | 173 |
| 320 | 0. 3125 | 0.025 | 20,000 | 332 | 264 |
| 384 | 0.260417 | 0.025 | 20,000 | 441 | 325 |
| 448 | 0.2232 | 0.025 | 20,000 | 718 | 465 |
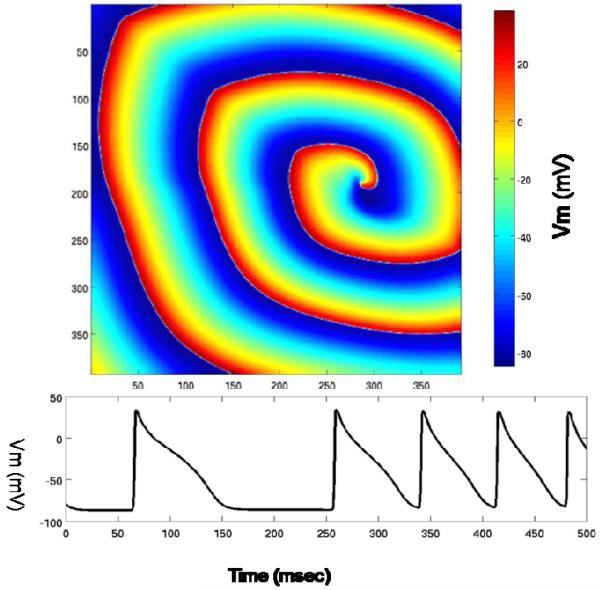
We again got identical outputs between the CPU and GPU implementations. The final voltage values for all nodes at the end of simulation are represented graphically at the top of Figure 5, and the voltage curve for each node during the simulation is shown at the bottom of Figure 5. The grid size in the top figure is 384*384: voltage values for all nodes in the grid are displayed. In the bottom figure, the X axis is the time (in msecs) and the Y axis is the Voltage (in mV). 500msec is the last millisecond of simulation. We have similar curves and graphs for other grid sizes as well.
Figure 5.
GPGPU implementation: results of the model for reentrant activity. Top: an image of transmembrane potential. Bottom: transmembrane potential for one node.
Figure 6 shows the GPU speedups over CPU from running various problem sizes on the Tesla C1060 and the TeslaC2050. The X axis represents the grid size and the Y axis shows the speedup value. The two cards yield at least 10X speedups for all the input sizes. The program running on GPU would finish in minutes compared to hours on the CPU. Also, the general trend is that the bigger input sizes lead to better speedups. For example, the Tesla C2050 ran 14.5, 15, 17.4 and 16.5 faster than CPU with grid size of 256*256, 320*320, 384*384 and 448*448 respectively. We can also see from the rightmost columns of Table 2 that the Tesla C2050 GPU outperformed the Tesla C1060 by as much as 50%.
Figure 6.
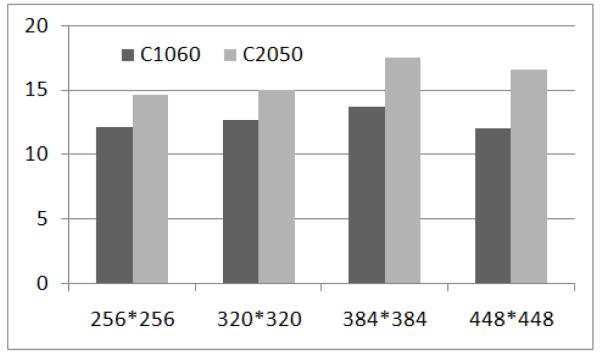
Speedups from the Tesla c1060 and the Tesla c2050 on electrical rotor simulation for different sizes.
V. Conclusions
In this paper, we ported an existing cardiac arrhythmia model to GPGPUs and significantly reduced the running time. We ran our GPGPU-based simulation on Tesla C1060 and Tesla C2050 and compared the results to the CPU implementation. We found that the outputs were identical and the speedups could reach as high as 18X upon point stimulation and 12X on electrical rotor activity. We believe that computational modeling of cardiac electrophysiology can benefit from running on GPGPUs, which are a cost-effective tool for a clinical setting. In the future, we plan to extend our work to run 3D models with realistic geometries.
Acknowledgement
This work was in part supported by a grant from the Institute of Biomedical Engineering at the George Washington University.
References
- [1].Scarle S. Implications of the Turing Completeness of Reaction-Diffusion Models, Informed by Gpgpu Simulations on an Xbox 360: Cardiac Arrhythmias, Re-Entry and the Halting Problem. Computational Biology and Chemistry. 2009;33(4):253–260. doi: 10.1016/j.compbiolchem.2009.05.001. [DOI] [PubMed] [Google Scholar]
- [2].Agladze K, Kay MW, Krinsky V, Sarvazyan N. Interaction between spiral and paced waves in cardiac tissue. Am J Physiol Heart Circ Physiol. 2007;293:H503–13. doi: 10.1152/ajpheart.01060.2006. [DOI] [PMC free article] [PubMed] [Google Scholar]
- [3].Kay MW, Gray RA. Measuring curvature and velocity vector fields for waves of cardiac excitation in 2-D media. IEEE Trans Biomed Eng. 2005;52:50–63. doi: 10.1109/TBME.2004.839798. [DOI] [PubMed] [Google Scholar]
- [4].Drouhard JP, Roberge FA. Revised formulation of the hodgkin-huxley representation of the sodium current in cardiac cells. Comput Biomed Res. 1987;20 doi: 10.1016/0010-4809(87)90048-6. [DOI] [PubMed] [Google Scholar]
- [5].Beeler GW, Reuter H. Reconstruction of the action potential of ventricular myocardial fibres. J Physiol. 1977;268:177–210. doi: 10.1113/jphysiol.1977.sp011853. [DOI] [PMC free article] [PubMed] [Google Scholar]
- [6].NVIDIA CUDA C PROGRAMMING GUIDE. http://www.nvidia.com. [Google Scholar]
- [7].Xu L, Taufer M, Collins S, Vlacho D. Parallelization of Tau-Leap Coarse-Grained Monte Carlo Simulations on GPUs; Proceeding of the 24th IEEE International Parallel & Distributed Processing Symposium (IPDPS); Atlanta, Georgia, USA. April 2010. [Google Scholar]
- [8].Lionetti FV, McCulloch AD, Baden SB. Source-to-source optimization of CUDA C for GPU Accelerated Cardiac Cell Modeling. In: D’Ambra Pasqua, Guarracino Mario, Talia Domenico., editors. Proceedings of the 16th international Euro-Par conference on Parallel processing: Part I (EuroPar’10) Springer-Verlag; Berlin, Heidelberg: pp. 38–49. [Google Scholar]


