Abstract
Uncertainties in the estimated mean excitation energies (I-values) needed for calculating proton stopping powers can be in the order of 10–15%, which introduces a fundamental limitation in the accuracy of proton range determination. Previous efforts have quantified shifts in proton depth dose distributions due to I-value uncertainties in water and homogenous tissue phantoms. This study is the first to quantify the clinical impact of I-value uncertainties on proton dose distributions within patient geometries. A previously developed Geant4 based Monte Carlo code was used to simulate a proton treatment plan for three patients (prostate, pancreases, and liver) with varying tissue I-values. A uniform variation study was conducted in which the tissue I-values were varied by ±5% and ±10% of the nominal values as well as a probabilistic variation study in which the I-values were randomly sampled according to a normal distribution with the mean equal to the nominal I-value and a standard deviation of 5 and 10% of the nominal values. Modification of tissue I-values impacted both the proton range and SOBP width. R90 range shifts up to 7.7 mm (4.4.%) and R80 range shifts up to 4.8 mm (1.9%) from the nominal range were recorded. Modulating the tissue I-values by 10% the nominal value resulted in up to a 3.5% difference mean dose in the target volumes and organs at risk (OARs) compared to the nominal case. The range and dose differences were the largest for the deeper-seated prostate and pancreas cases. The treatments that were simulated with randomly sampled I-values resulted in range and dose differences that were generally within the upper and lower bounds set by the 10% uniform variations. This study demonstrated the impact of I-value uncertainties on patient dose distributions. Clearly, sub-millimeter precision in proton therapy would necessitate a reduction in I-value uncertainties to ensure an efficacious clinical outcome.
1. Introduction
Proton therapy is gaining a reputation as one of the most advanced forms of therapy offered to cancer patients. This appeal stems from a proton beams unique depth dose characteristics that culminates with a signature “Bragg peak” at a well-defined depth in a medium. As a result, for a given prescribed dose, proton therapy will always deliver less integral dose to a patient compared to photon therapy, making it a convincing treatment option for cases where exit dose needs to be minimized (e.g. pediatric patients).
In theory, the sharp fall off of the Bragg peak can also be used to spare critical structures located immediately behind the target. Despite these inherent advantages, clinical gains from proton therapy compared to photon therapy for some treatment sites have not been fully realized. Most notably, a recent retrospective analysis of Medicare records has demonstrated that prostate patients who received intensity-modulated radiation therapy (IMRT) had better clinical outcomes than patients who received proton therapy (Sheets et al 2012). Arguably the reduction in efficacy for prostate treatments is due to the field arrangement in proton therapy with parallel opposed fields which does not allow the full clinical potential of protons to be utilized but is being used because range uncertainties prevent stopping the beam close to the rectum. For stationary targets, one of the largest sources of range uncertainty is the fundamental uncertainty in the mean excitation energy of human tissues (Paganetti 2012).
The mean excitation energy, or I-value (usually expressed by the symbol I), constitutes the main source of uncertainty in the Bethe-Bloch stopping power equation (Emfietzoglou et al 2009, Kamakura et al 2006). I-values for some elements can be determined accurately using experimental data on the interactions of photons with matter. For gases it can be derived from the knowledge of oscillator-strength distributions (Zeiss et al 1977, Inokuti et al 1981, Wilson et al 1984, Kamakura et al 2006) and for condensed materials it can be obtained from dielectric response functions (Fano 1956, Fano 1963, Shiles et al 1980, Emfietzoglou et al 2009). Additionally, ab initio calculations have been done for some atomic gases (ICRU 1984). The most common method to determine elemental I-values is from the analysis of stopping power and range measurements under conditions where the Bethe theory holds (ICRU 1984, ICRU 1993, Bischel and Hiraoka 1992, Kumazaki et al 2007, Garcia-Molina et al 2009). Uncertainties of the elementary I-values provided by ICRU and elsewhere are arrived at by subjective judgments accounting for uncertainties of the underlying measurements, the errors inherent in the analysis of the measurements, and the dispersion of the I-values derived from various sources (ICRU 1984).
In order to obtain an accurate estimate of the I-value, it is necessary to account for the specific electronic structure of the atom, molecule, or solid. Therefore, the evaluation of I-values for compounds and mixtures is particularly complex. Even the determination of the I-value of liquid water is not a trivial task. A wide range of values have been suggested in literature: 67.2 eV (ICRU-73 2005), 72.5 eV (Tan et al 2004), 74 eV (Luo et al 1991, Akkerman and Akkerman 1999), 75 eV (Sihver et al 1998), 75 ± 3 eV (ICRU-37 1984, ICRU-49 1993), 77 eV (Krämer et al 2000) , 77.8 ± 1 eV (Emfietzoglou et al 2009), 78.4 ± 1 eV (Kumazaki et al 2007), 79.4 eV (Garcia-Molina et al 2009), 79.7 ± 0.5 eV (Bischel and Hiraoka 1992), 80.8 ± 2 eV (Paul et al 2007a, 2007b), and 81.8 eV (Dingfelderet al 1998). Even when excluding the lowest value1, there is still approximately a 10 eV (12–14%) spread in the results and a generally accepted I-value for water has not been established yet.
It is therefore not surprising that a limited amount of experimental data exists from which the I-values of compounds and human tissues can be determined. Instead, these values are approximated using Bragg’s additivity rule (Bragg and Kleenman 1905), which is based on the assumption that the collisional stopping power of a compound can be approximated by the weighted sum of the stopping powers of the atomic constituents. Therefore, the I-value of a compound can be calculated using a similar weighted sum of the elementary I-values of the atomic constituents (ICRU 1984, ICRU 1993). However, because the Bragg additivity approximation ignores the effects of chemical bonds, the I-value estimates of human tissues have even larger uncertainties than elemental I-values which are derived from empirical data (Andreo 2009, ICRU 1984). Additional uncertainty is also incurred due to the variation in the tissue compositions even in tissues that are considered clinically identical (Andreo 2009, Espana and Paganetti 2010). Andreo (2009) estimated that the uncertainties in the I-values of human tissues could to be up to the order of 10–15%.
In the context of proton therapy, previous work by Andreo (2009) has shown that variations in the I-value of water between 67 and 80 eV result in an energy dependent spread in the proton range for monoenergetic proton beams. The spread in the Bragg peaks due to the variation in I-values was found to be more significant for higher beam energies. Andreo (2009) also observed differences up to 0.3 g/cm2 due to the slight variations in the I-values of four homogeneous human tissues phantoms that are typically considered almost identical in clinical practice. It was concluded that uncertainties in the I-values can cause range uncertainties on the order of ±1.5–2%. Yang et al (2012) varied the elemental I-values by 10% and found that the calculated stopping power of water and human tissues varied by about 1% and the stopping power ratios of human tissues relative to water varied by less than 1.4%. Additionally, a study by Bednarz et al (2011) simulated a ±20% variation in the nominal I-value of the materials in the Francis H. Burr proton treatment head (Carbon, Lead, and Lexan) and found range variations greater than 1.5 mm in a water phantom.
These previous studies have provided valuable insights on the effects of I-value uncertainties on the proton range in water and homogeneous human tissues phantoms and suggest it might be a matter of clinical importance during therapy. This investigation is the first to quantify the clinical impact of I-value uncertainties on proton dose distributions within patient geometries. A Geant4 based Monte Carlo code was used to simulate a proton treatment plan for three patients with varying tissue I-values (Agnostinelli et al 2003, Paganetti et al 2004). The impact of the I-value variations on the range and dose distribution within the patient was investigated. This information will be useful for future investigations that aim to reduce the clinical margins used for proton therapy.
2. Materials and Methods
2.1 Monte Carlo simulations
All simulations in this study were performed using a detailed model of the Francis H. Burr treatment head at Massachusetts General Hospital (MGH) that was developed by Paganetti et al (2004) and implemented in Geant4 version 9.0 (Agnostinelli et al 2003). Patient-specific CT data was imported in the software following methods described elsewhere (Paganetti et al 2008, Jiang and Paganetti 2004). Most relevant to this paper is the conversion of Hounsfield Units (HUs) to density and composition of materials within the patient geometry. This software uses a stoichiometric calibration of CT numbers to material mass densities and elemental weights based on the method presented in Schneider et al (2000). The entire range of HUs is segmented into 27 groups with unique elemental compositions and weights as shown in Table 1. Each HU has a unique density but only the density of the center bin is listed in Table 1 for simplicity. The I-value of each HU bin was determined using the Bragg additivity rule that calculates a weighted average of the elementary I-values of its atomic constituents,
where wj is the fraction by weight and Zj, Aj, and Ij are the atomic number, atomic mass, and I-value of the j'th constituent given by the ICRU (ICRU 1984, ICRU 1993), respectively. The I-value calculated for each HU bin is given in Table 1.
Table 1.
The CT number range, relative electron densities of the center HU bin, and mean excitation energies for tissues. Group 27 represents high Z materials such as titanium implants.
| Group | Tissue | HU range | Relative electron density |
I-value (eV) [Nominal] |
I-value (eV) [−10% ; +10%] |
|---|---|---|---|---|---|
| 1 | [;−951] | 0.024 | 85.68 | [77.11; 94.25] | |
| 2 | Lung | [−950; −121] | 0.476 | 69.44 | [62.50; 76.38] |
| 3 | Adipose tissue | [−120; −83] | 0.929 | 60.59 | [54.53; 66.65] |
| 4 | [−82; −53] | 0.958 | 62.23 | [56.01; 68.45] | |
| 5 | Yellow marrow | [−52; −23] | 0.982 | 63.97 | [57.57; 70.37] |
| 6 | Red marrow | [−22; 7] | 1.007 | 65.39 | [58.85; 71.93] |
| 7 | [8; 18] | 1.024 | 66.58 | [59.92; 73.24] | |
| 8 | Soft tissues | [19; 79] | 1.052 | 69.02 | [62.12; 75.92] |
| 9 | [80; 119] | 1.102 | 69.58 | [62.62; 76.54] | |
| 10 | [120; 199] | 1.094 | 69.03 | [62.13; 75.93] | |
| 11 | [200; 299] | 1.14 | 71.72 | [64.55; 78.89] | |
| 12 | Sternum | [300; 399] | 1.19 | 74.75 | [67.28; 82.23] |
| 13 | [400; 499] | 1.24 | 77.66 | [69.89; 85.43] | |
| 14 | Femur, head | [500; 599] | 1.291 | 80.2 | [72.18; 88.22] |
| 15 | [600; 699] | 1.342 | 82.83 | [74.01; 90.45] | |
| 16 | Ribs | [700; 799] | 1.391 | 85.42 | [76.88; 93.96] |
| 17 | [800; 899] | 1.441 | 88.16 | [79.34; 96.98] | |
| 18 | Cranium | [900; 999] | 1.491 | 90.42 | [81.38; 99.46] |
| 19 | [1000; 1099] | 1.542 | 92.48 | [83.23; 101.73] | |
| 20 | [1100; 1199] | 1.592 | 94.85 | [85.37; 104.34] | |
| 21 | [1200; 1299] | 1.642 | 96.8 | [87.12; 106.48] | |
| 22 | [1300; 1399] | 1.693 | 98.78 | [88.90; 108.66] | |
| 23 | Bone | [1400; 1499] | 1.743 | 100.8 | [90.72; 110.88] |
| 24 | [1500; 1599] | 1.794 | 102.22 | [92.00; 112.44] | |
| 25 | [1600; 1999] | 1.931 | 102.22 | [92.00; 112.44] | |
| 26 | [2000; 3060] | 2.287 | 102.22 | [92.00; 112.44] | |
| 27 | High Z Material | [3061;] | 3.757 | 233 | [209.7; 256.3] |
2.2 I-value variation studies
To investigate the clinical impact of I-value uncertainties on proton dose distributions within patient geometries, two separate sensitivity studies were conducted. The first study assumed a uniform variation in I-value. Each patient treatment was simulated by varying the tissue I-values by ±5% and ±10% of the nominal values. These variations are motivated by the uncertainty estimates given by Andreo (2009) as well as the range of values for liquid water currently cited in the literature. This was done to model the worst-case scenario and to investigate the upper and lower bounds on the range and dose variations within the patient. The ±10% variation of the nominal I-value for each HU bin is also provided in Table 1.
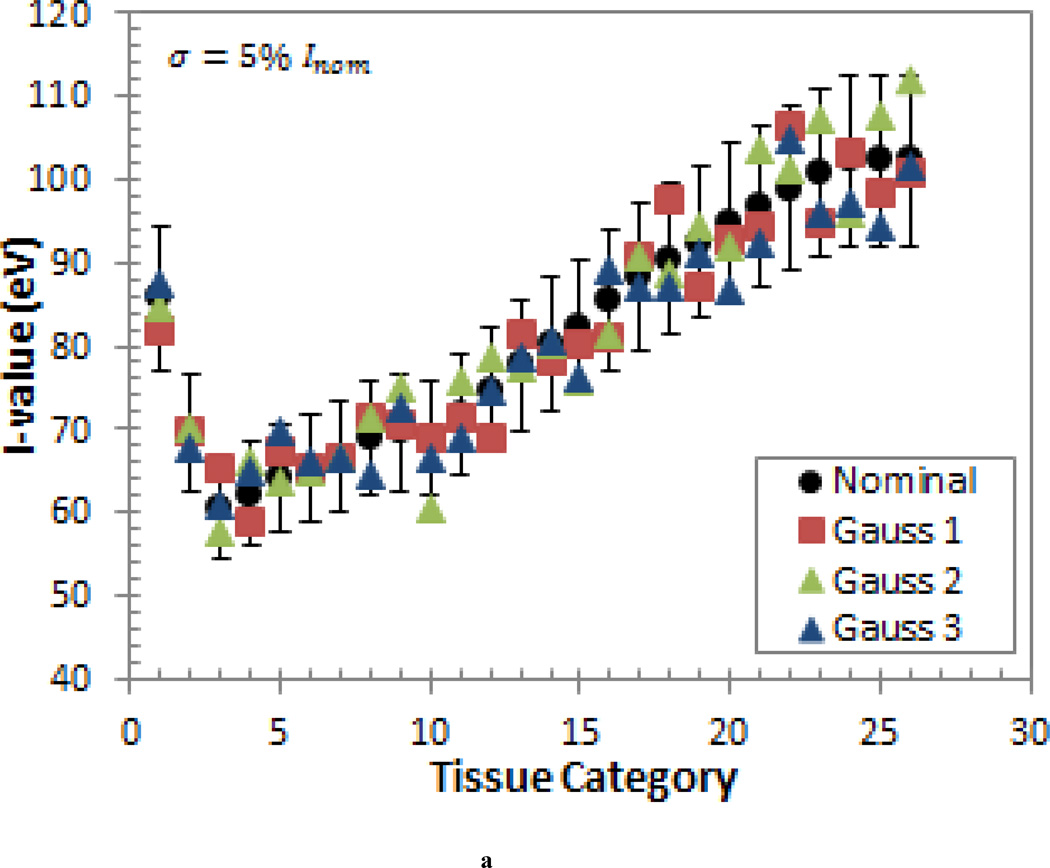
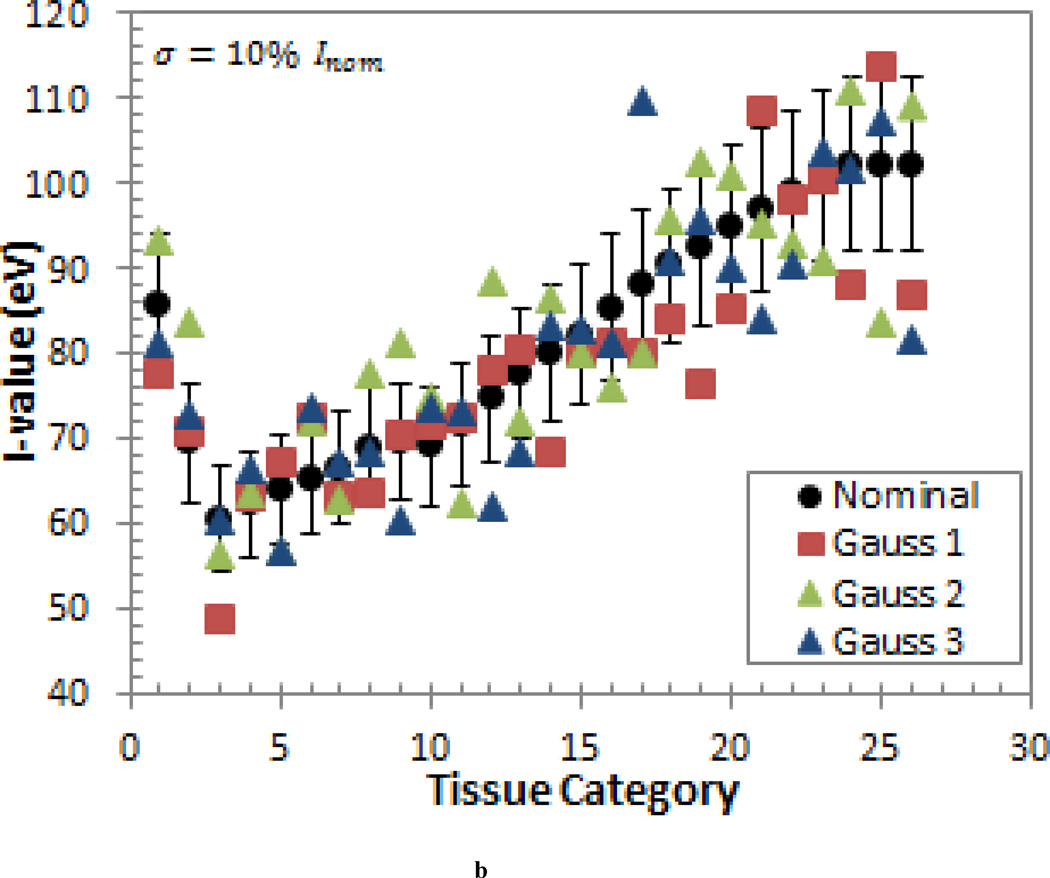
The second study was motivated by the fact that, in reality, some tissue I-values will be higher than then nominal value and some will be lower than the nominal value. To account for this, a probabilistic variation study was conducted in which the I-values were randomly sampled according to a normal distribution with the mean equal to the nominal I-value (Inom) and a standard deviation of σ = 5% · Inom and σ = 10% · Inom. This generic error model was also used because it does not depend on the detailed knowledge about the individual sources of the uncertainty (Nohadani et al 2009). This type of model better reflects the uncertainties provided in the ICRU-37 report (1984), which states that the uncertainties of the elementary I-values are arrived at by subjective judgments and with a meaning that is not easily defined (ICRU 1984). As mentioned previously, the uncertainties are even more indeterminate for the I-values of human tissues due to the use of the Bragg additivity rule. Three sets of randomly sampled I-values were produced to obtain three different scenarios for each standard deviation. These sets of I-values are shown in Figure 1.
Figure 1.
The three sets of I-values generated by randomly sampling a normal distribution with a mean equal to the nominal I-value (Inom) and a standard deviation of (a) σ = 5% · Inom and (b) σ = 10% · Inom. The ±10% error bars are shown for reference.
2.3 Patient populations
Detailed information about the three patient treatments simulated in this study is provided in Table 2. Patient 1 was a prostate patient who was treated with two opposing lateral fields and two lateral boost fields. Patient 2 was a pancreas patient who was treated with two opposing oblique lateral beams and an oblique PA beam. Both of these patients were chosen due to the deep-seated target volume and the large number of heterogeneities along the beam path. Patient 3 was a liver patient who was treated with a left lateral and PA beam. Patient 3 was chosen to investigate the impact of I-value uncertainties on a relatively shallow tumor near low density tissues. Dose Volume Histograms (DVHs), dose difference maps, and dose profiles were generated for each patient. All doses are reported as the dose-to-tissue.
Table 2.
Field characteristics for each patient studied.
| Patient | Field | Site | Range (cm) |
Modulation Width (cm) |
Beam Target Dose (Gy(RBE)) |
Total Target Dose (Gy(RBE)) |
Target Volume (cm3) |
||
|---|---|---|---|---|---|---|---|---|---|
| GTV | CTV | PTV | |||||||
| 1 | 1-1 | Prostate | 28 | 8.5 | 21.78 | 80.03 | 50.29 | 58.65 | 120.84 |
| 1-2 | 27.3 | 8.3 | 23.76 | ||||||
| 1-3 | 27.9 | 8 | 18.20 | ||||||
| 1-4 | 27.3 | 7.6 | 16.29 | ||||||
| 2 | 2-1 | Pancreas | 22.8 | 11.8 | 7.85 | 26.26 | 5.44 | 242.09 | 530.73 |
| 2-2 | 24.5 | 11.3 | 7.93 | ||||||
| 2-3 | 21 | 10 | 10.48 | ||||||
| 3 | 3-1 | Liver | 12.8 | 7.41 | 30.15 | 60.21 | 13.1 | ||
| 3-2 | 11.2 | 6.15 | 30.06 | ||||||
3. Results
3.1 Uniform variation study
3.1.1 Impact of I-value uncertainty on proton beam range
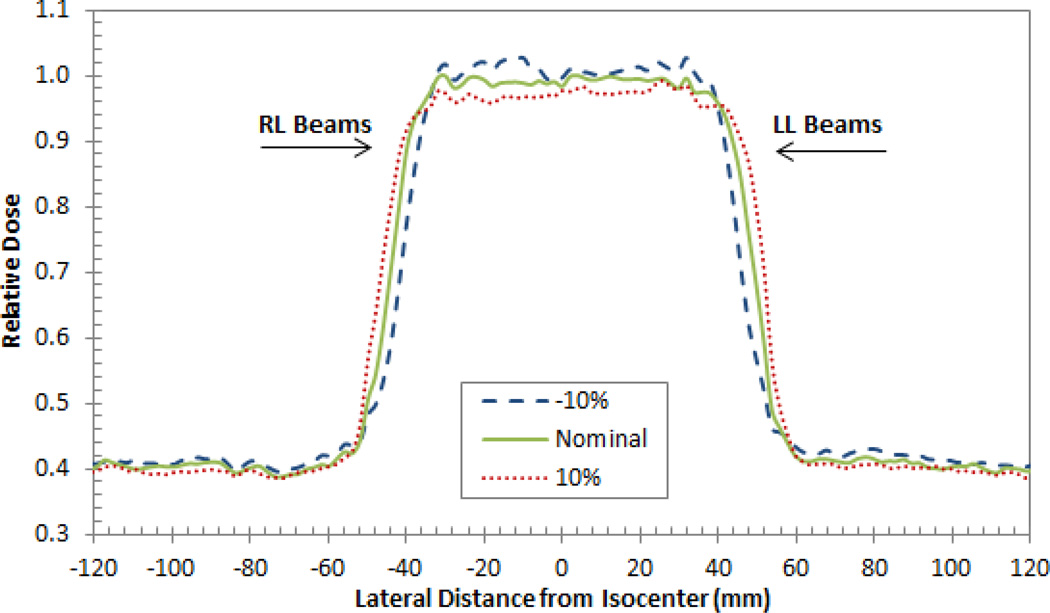
Uniformly changing the tissue I-values clearly impacts the shape of the SOBP within the patient as illustrated for the prostate patient in Figure 2. Increasing the I-value of the tissues increased the proton range within the patient due to a decrease in the stopping power. The increased range resulted in a wider spread-out Bragg peak (SOBP) which decreased the dose delivered to the target volume and increased the dose delivered to tissues near the distal edge of each beam. Additionally, the dose to normal tissues in the entrance region (entrance to the depth of the first 80% dose level,) decreased as well. Inversely, a decrease in the mean excitation energy resulted in a decrease in the range, which increased the dose in the center of the target volume, as well as the dose to the normal tissues in the entrance region, and decreased the dose near the distal edge of the target volume. When the tissue I-values were modulated up to ±10% the nominal value, the relative dose in the entrance region differed by about 1.5% from the nominal case while the while the relative dose in the SOBP region (to) deferred by approximately 2.5%. Thus, slightly larger dose differences were observed within the target volume regions.
Figure 2.
A lateral depth dose curve (SOBP) composed of two right lateral (RL) beams and two left lateral (LL) beams for the prostate patient. Note the interesting shape of the dose distribution is a reflection of the sum of two opposing fields. The fluctuations along the SOBP for each case are due to the tissue heterogeneities within the patient.
To quantify the range variations, the range was sampled along three different slices in the transverse plane for each patient field. The SOBP modulation width was defined as the region between the proximal 98% and distal 90% isodose levels and each curve was normalized to the average dose within the nominal I-value modulation width for that slice. Modulating the I-value up to ±10% the nominal value shifted the R90 range by up to 7.7 mm (2.7% of the range) from the nominal range due to the imperfect shape of the SOBP caused by statistical fluctuations as well the heterogeneities encountered along the beam path. The R80 range showed less fluctuation and only differed up to 4.8 mm (1.9% of the range) from the nominal range. The maximum absolute and percent differences from the R90 and R80 nominal range values are listed in Table 3 for each patient field. The R90 and R80 range shifted up to 4.4 and 3.8 mm for the prostate patient, up to 7.7 and 4.8 mm for the pancreas patient, and up to 3.7 and 1.6 mm for the liver patient, respectively. As expected from Andreo’s (2009) findings mentioned earlier, the deeper-seated prostate and pancreas targets resulted in larger range variations than the shallower liver target due to the use of higher energy beams.
Table 3.
Maximum variation from the nominal R90 and R80 range in mm, Ri − Rnom, and the maximum percent difference from the nominal range, (Ri − Rnom)/Rnom × 100% for each patient considered where Ri is the range of the beams simulated with increased/decreased tissue I-values.
| Prostate Patient |
Pancreas Patient |
Liver Patient |
|||||||
|---|---|---|---|---|---|---|---|---|---|
| Field 1 | Field 2 | Field 3 | Field 4 | Field 1 | Field 2 | Field 3 | Field 1 | Field 2 | |
| R90 Max Difference (mm) | 4.4 | −3.5 | −4.2 | −4.1 | −5.3 | −4.6 | 7.7 | 3.4 | 3.7 |
| R90 % of Range (%) | 1.7% | −1.4% | −1.7% | −1.6% | −2.1% | 1.7% | 4.4% | 2.5% | 3.2% |
| R80 Max Difference (mm) | −3.4 | −3.7 | −3.8 | −3.5 | −4.1 | −4.8 | 4.2 | 1.6 | 1.4 |
| R80 % of Range (%) | −1.3% | −1.5% | −1.5% | −1.4% | −1.6% | −1.9% | −1.4% | 1.2% | 1.2% |
3.1.2 Impact of I-value Uncertainty on Dose Homogeneity
The dose homogeneity index, DHI = D98%/D2%, was used to quantify how range variations impact the homogeneity of the target volume dose. A uniform decrease in the tissue I-values, and subsequent decrease in range, generally resulted in a less homogeneous dose to the target volumes. Inversely, the increased I-value and range generally resulted in a more homogeneous dose to the target. For most of the target volumes, the DHI differed from the nominal case by ≥1%. However, for the larger pancreas PTV (530.73 cm3) the effect was much more significant and the homogeneity was approximately 10% worse when the I-value was uniformly decreased by 10%. Thus, the dose homogeneity of larger target volumes could suffer due to an unexpected undershoot caused by tissue I-values uncertainties
3.1.3 Impact of I-value Uncertainty on Patient Dose Distributions
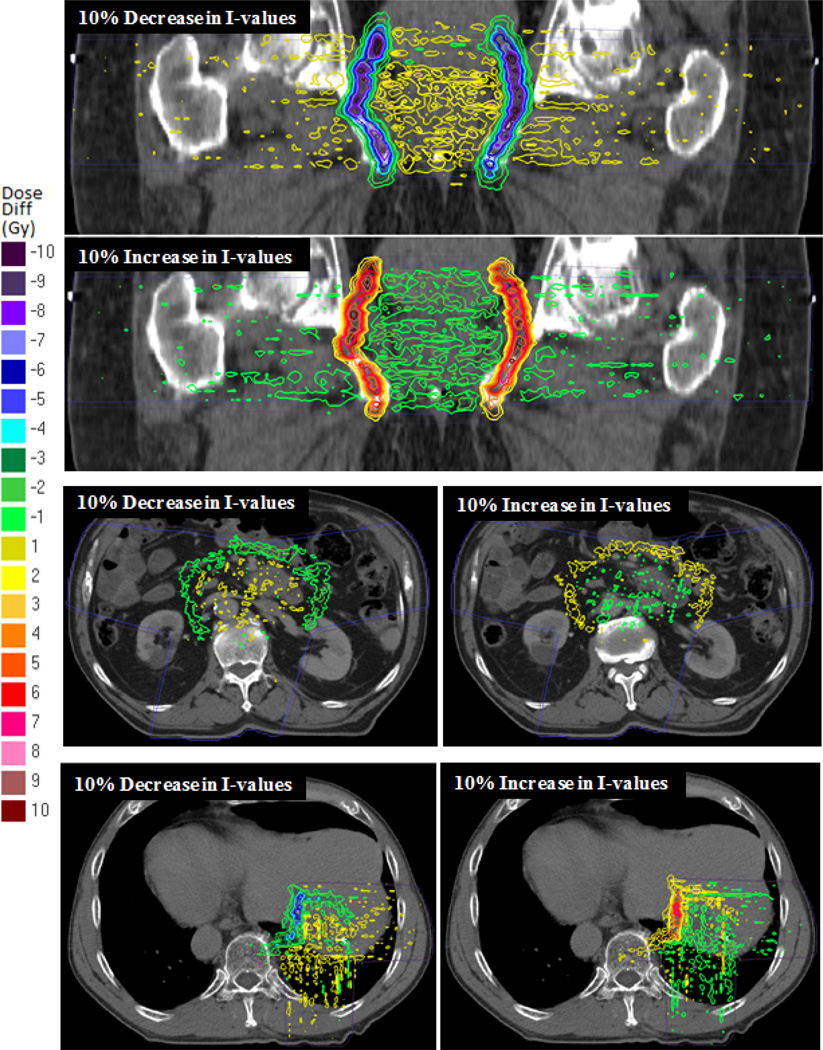
Figure 3 shows isodose curves which represent the dose difference between treatments with a 10% uniform decrease/increase in tissue I-values and treatment with the nominal tissue I-values for each patient. The range changes in the prostate patient resulted in two large dose gradients regions at the distal edges of the beams where the dose differs from the nominal case by larger than ±9 Gy in some regions. These sharp gradients are caused by the compounding effects of the two overlapping beams with similar ranges incident on each side. Outside of these regions the dose differs by only about ±1 Gy. The high dose gradients regions are not seen in the pancreas patient because of small overlap in distal edges of the two oblique lateral beams and the oblique PA beam. Additionally, each beam is delivering significantly smaller doses than the each of the prostate beams. Instead, there is large region where the dose differs by about ±2 Gy from the treatment with the nominal I-values. Because of the overlap of the distal edges of the perpendicular beams in the corner of the field and the high dose delivered, there is also a high dose gradient region in the liver patient. At some points in this region the dose differs by more than ±6 Gy. The dose in other areas differs by only about ±2 Gy.
Figure 3.
Isodose curves showing the dose difference between treatments with a 10% uniform decrease/increase in tissue I-values and treatment with the nominal tissue I-values for the (top) prostate, (middle) pancreas, and (bottom) liver patients. A negative dose difference (“cool” colors) indicates a lower delivered dose than the nominal case while a positive dose difference (“warm” colors) indicates a higher delivered dose than the nominal case. The light dotted lines are nominal isodose lines to show the beam directions.
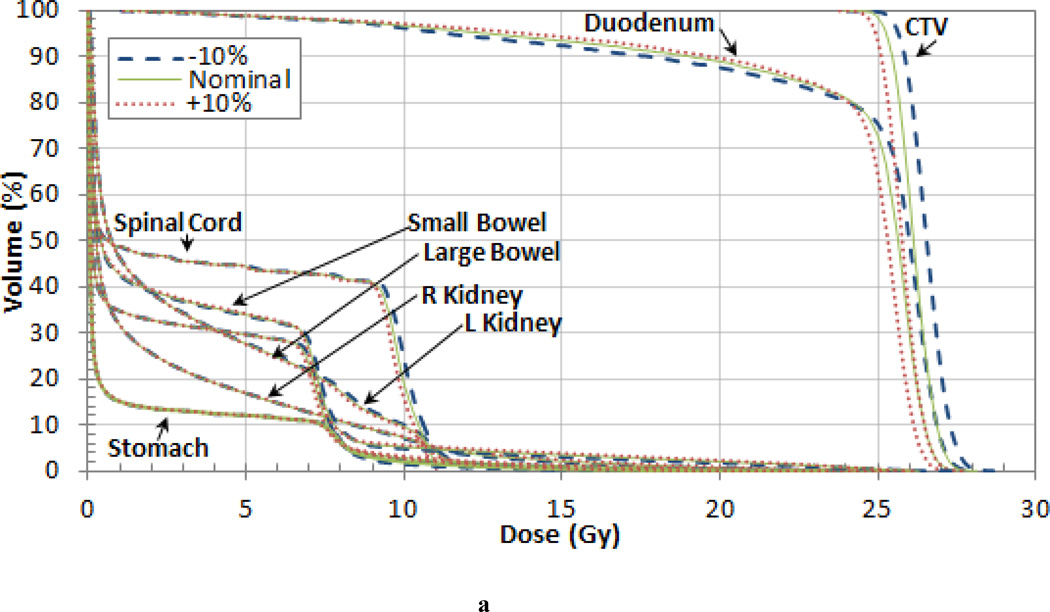
The variation of the dose delivered to the target volumes and organs at risk (OARs) was also investigated for each patient. The DVHs for each patient are shown in Figure 4 and the variations in mean dose are listed in Tables 4, 5 and 6. For the pancreas patient, as shown in the DVH in Figure 4 (a), an increase in range and SOBP will overshoot the target volume and result in a decrease in dose. When the I-value by was increased by 10% the nominal value the mean dose to the clinical target volume (CTV) decreased by 1.4% for the pancreas patient. When the I-value was decreased by 10%, the decrease in range and SOBP resulted in cold spots on the lateral edges of the tumor. However, the mean dose delivered to the CTV increased by 1.8% due to the increase in dose delivered to the center. The largest variation in the mean dose occurred in the planning treatment volume (PTV) which differed by up to 3.5% from the nominal case. The largest mean dose variation for the OARs occurred in the stomach, which also differed by 3.5%. Additionally, the 3% difference in the mean dose in the spinal cord and small bowel are also worth noting. The dose difference for the target volumes and OARS are listed in Table 4.
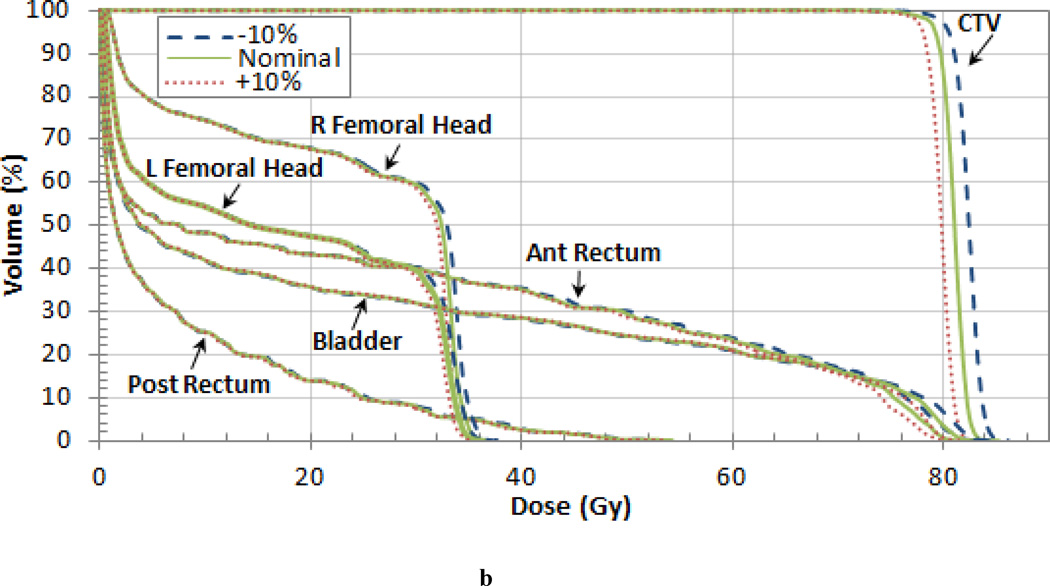
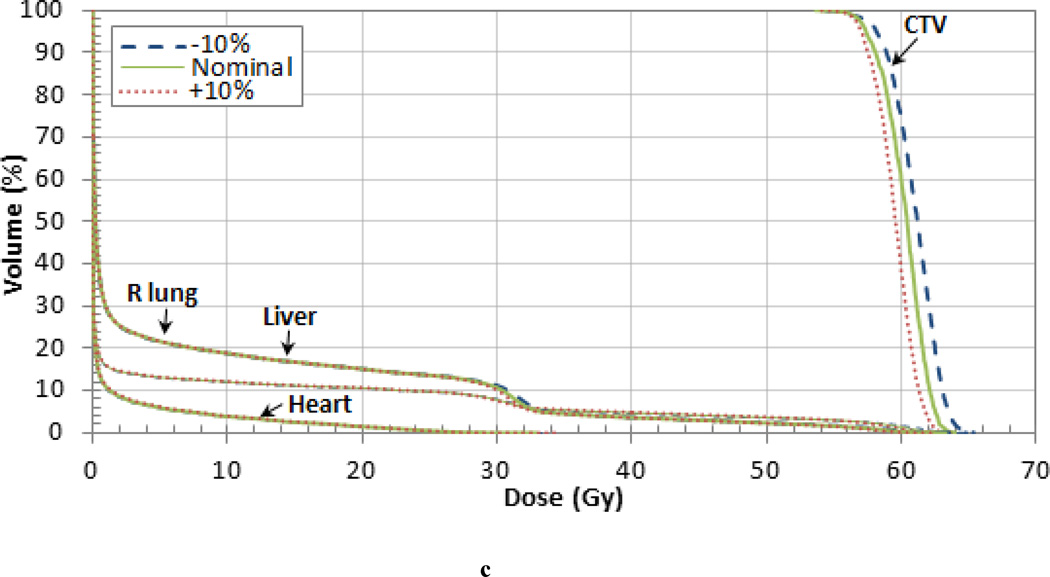
Figure 4.
Dose Volume Histograms (DVHs) for the (a) pancreas, (b) prostate, and (c) liver patient. Each OAR is shown but the CTV is the only target volume shown for clarity.
Table 4.
Differences between the dose delivered using the nominal tissue I-value and ±5% and ±10% the nominal value for different volume levels (95% and 10%) and the mean dose for the pancreas patient.
| Target Volumes | |||||
|---|---|---|---|---|---|
| +10% | −5% | +5% | +10% | ||
| GTV | 95% Volume | 1.6% | 0.9% | −0.4% | −1.3% |
| 10% Volume | 2.1% | 0.9% | −0.5% | −1.6% | |
| Mean | 1.8% | 0.9% | −0.5% | −1.4% | |
| CTV | 95% Volume | 1.5% | 0.8% | −0.8% | −1.3% |
| 10% Volume | 1.6% | 0.7% | −0.7% | −1.5% | |
| Mean | 1.4% | 0.8% | −0.8% | −1.4% | |
| PTV | 95% Volume | −4.6% | −2.1% | 1.2% | 1.9% |
| 10% Volume | 1.5% | 0.7% | −0.7% | −1.4% | |
| Mean | −3.5% | −1.7% | 1.4% | 3.0% | |
| Organs at Risk | |||||
| +10% | −5% | +5% | +10% | ||
| Celiac | 10% Volume | 1.8% | 1.2% | −0.4% | −1.2% |
| Mean | 1.6% | 1.1% | −0.8% | −1.7% | |
| Duodenum | 10% Volume | 1.4% | 0.9% | −0.6% | −1.3% |
| Mean | 0.0% | −0.2% | 0.1% | 0.0% | |
| SMA | 10% Volume | 0.7% | 0.5% | −0.9% | −2.2% |
| Mean | 0.8% | 0.5% | 0.2% | −0.8% | |
| Porta Hepatis | 10% Volume | 1.8% | 1.8% | 0.0% | −1.3% |
| Mean | 1.4% | 1.4% | −0.3% | −1.5% | |
| Spinal Cord | 10% Volume | 1.5% | 1.0% | −0.9% | −1.3% |
| Mean | 1.5% | 1.6% | −2.0% | −3.0% | |
| Liver | 10% Volume | 0.0% | 0.0% | 0.0% | 5.4% |
| Mean | −0.1% | 0.0% | 0.3% | 0.4% | |
| Stomach | 10% Volume | 1.3% | 0.1% | −0.1% | −0.4% |
| Mean | −3.4% | −1.7% | 1.4% | 3.5% | |
| Small Bowel | 10% Volume | 1.0% | 0.5% | −0.5% | −1.0% |
| Mean | −3.0% | −1.5% | 1.2% | 2.1% | |
| Large Bowel | 10% Volume | 1.1% | 0.5% | −0.5% | −1.1% |
| Mean | −1.7% | −0.8% | 0.9% | 1.6% | |
| L Kidney | 10% Volume | 1.0% | 1.0% | −0.8% | −1.0% |
| Mean | 1.0% | 0.6% | −0.3% | −0.9% | |
| R Kidney | 10% Volume | −0.2% | 0.0% | 1.8% | 1.4% |
| Mean | −2.6% | −1.4% | 1.3% | 2.8% | |
Table 5.
Differences between the dose delivered using the nominal tissue I-value and ±5% and ±10% the nominal value for different volume levels (95% and 10%) and the mean dose for prostate patient.
| Target Volumes | |||||
|---|---|---|---|---|---|
| −10% | −5% | +5% | +10% | ||
| GTV | 95% Volume | 1.8% | 0.9% | −0.8% | −1.5% |
| 10% Volume | 1.7% | 0.9% | −0.7% | −1.5% | |
| Mean | 1.2% | 0.7% | −0.9% | −1.5% | |
| CTV | 95% Volume | 1.6% | 0.9% | −0.8% | −1.5% |
| 10% Volume | 1.7% | 0.9% | −0.7% | −1.5% | |
| Mean | 1.4% | 0.8% | −0.6% | −1.4% | |
| PTV | 95% Volume | 1.7% | 0.8% | −0.8% | −1.5% |
| 10% Volume | 1.7% | 0.9% | −0.8% | −1.6% | |
| Mean | 1.6% | 0.9% | −0.6% | −1.2% | |
| Organs at Risk | |||||
| −10% | −5% | +5% | +10% | ||
| Ant Rectum | 10% Volume | 1.6% | 0.6% | −1.0% | −1.6% |
| Mean | 1.0% | 0.5% | −1.7% | −2.7% | |
| Post Rectum | 10% Volume | 2.0% | 1.8% | 0.6% | −1.9% |
| Mean | 1.0% | 0.2% | −0.9% | −1.2% | |
| Whole Rectum | 10% Volume | 1.0% | 1.1% | −0.2% | −1.6% |
| Mean | 1.8% | 0.9% | −0.8% | −1.3% | |
| Bladder | 10% Volume | 1.0% | 0.5% | −0.6% | −1.3% |
| Mean | 1.1% | 0.5% | −0.7% | −1.3% | |
| L Femoral Head | 10% Volume | 1.8% | 0.9% | −0.7% | −1.4% |
| Mean | 1.7% | 0.8% | −1.1% | −2.2% | |
| R Femoral Head | 10% Volume | 1.8% | 0.9% | −0.9% | −1.5% |
| Mean | 2.5% | 1.0% | −1.0% | −1.8% | |
Table 6.
Differences between the dose delivered using the nominal tissue I-value and ±5% and ±10% the nominal value for different volume levels (95% and 10%) and the mean dose for liver patient.
| Target Volume | |||||
|---|---|---|---|---|---|
| +10% | −5% | +5% | +10% | ||
| CTV | 95% Volume | 1.3% | 0.5% | −0.3% | −0.6% |
| 10% Volume | 1.5% | 0.9% | −0.4% | −1.3% | |
| Mean | 1.3% | 0.6% | −0.4% | −1.0% | |
| Organs at Risk | |||||
| +10% | −5% | +5% | +10% | ||
| Heart | 10% Volume | −14.3% | −10.5% | 3.8% | 6.8% |
| Mean | 0.1% | 0.5% | −0.2% | −0.1% | |
| Liver | 10% Volume | −1.5% | −0.5% | 0.6% | 2.4% |
| Mean | 0.5% | 0.3% | −0.1% | −0.3% | |
| R Lung | 10% Volume | 1.1% | 0.7% | −0.7% | −1.1% |
| Mean | 1.3% | 0.5% | −0.5% | −1.1% | |
The results were similar for the prostate patient as shown in the DVH in Figure 4 (b). Varying the tissue I-values by 10% of the nominal value changed the CTV dose by 1.4% as shown in Table 5. The mean dose to each of the target volumes differed by less than 2% from the nominal case. The difference in the mean dose to the some of the OARs was even larger. Notably, there was a 2.7% difference in the mean dose to the anterior rectum and a 2.5% difference in the right femoral head. In the case of decreased tissue I-values and subsequent increased in range, both the anterior rectum and the bladder contain a small volume of increased dose indicated by the high dose tail on the DVHs in Figure 4 (b).
The dose difference from the nominal case for the target volumes and OARS are listed in Table 6 and the DVH is shown in Figure 4 (c) for the liver patient. The 10% variations in the nominal I-value resulted in a mean dose difference of 1.3% for the CTV and also the right lung. The small CTV volume did not contain any of the high dose regions caused by range variations shown in Figure 3. However, the larger right lung and liver OARs did contain regions where with dose differences up to 6 Gy which may have an impact on pulmonary and hepatic toxicity. The fact that the dose differences were slightly less for the shallower liver treatment than the deeper-seated prostate and pancreas treatments are consistent with the energy dependence of the Bragg peak shifts found in Andreo (2009).
3.2 Probabilistic variation study
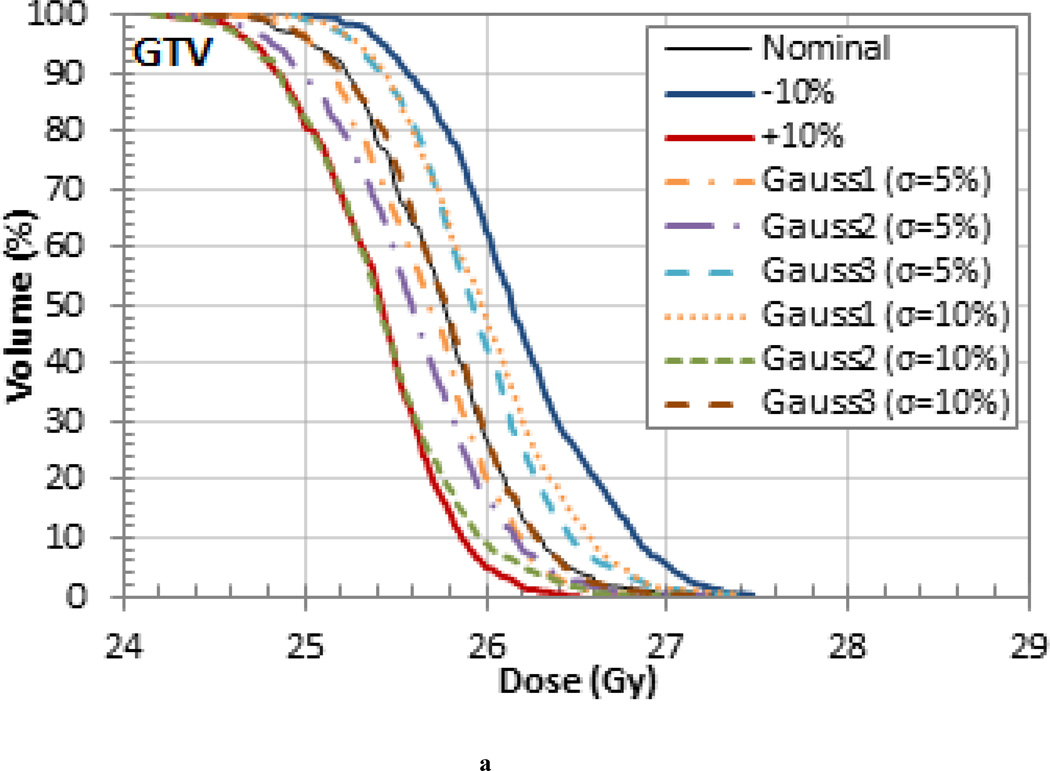
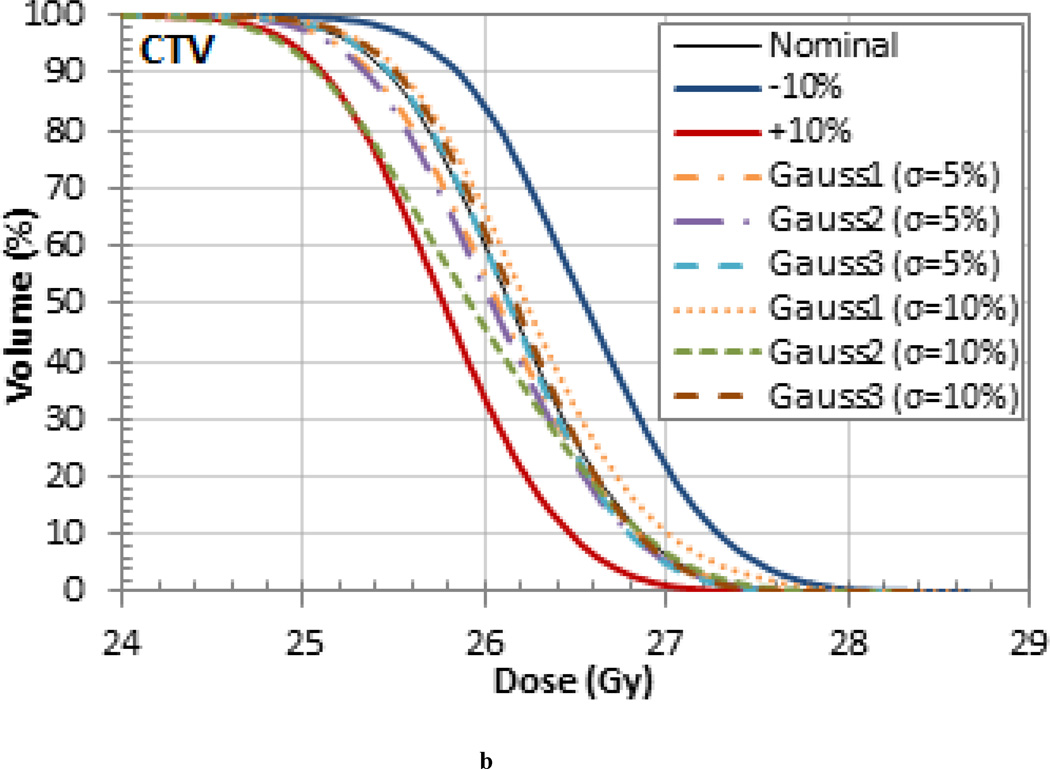
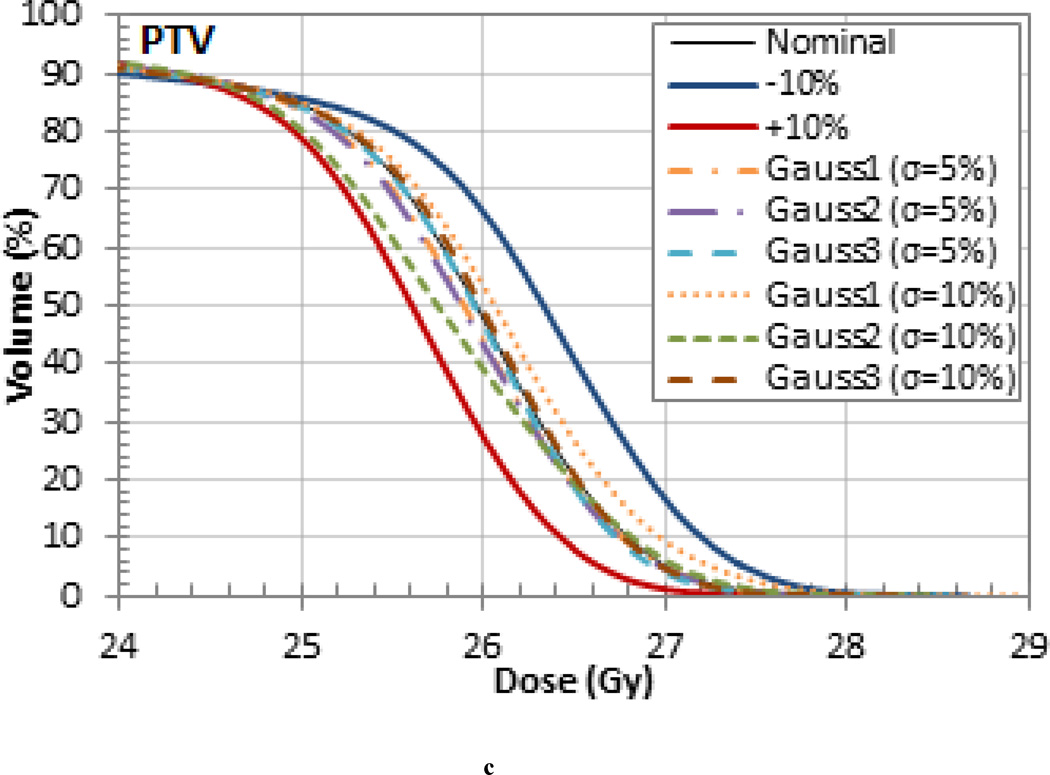
The treatments that were simulated with randomly sampled I-values resulted in range, homogeneity, and dose differences that were generally within the upper and lower bounds set by the 10% uniform variations. This is exemplified in the target volume DVHs in Figure 5 for the pancreas patient, which is representative of the results seen in the other patients. Note, the smaller variations are due to the washout effect caused by the combination of higher and lower tissue I-values. These results are likely to be more representative of the actual delivered dose. The probabilistic variation of I-values during dose calculations, as demonstrated in this work, might be useful for novel optimization methods recently proposed, most notably stochastic optimization (Nohadani et al 2009).
Figure 5.
(a) GTV, (c) CTV, and (d) PTV DVHs for the pancreas patient for treatments that were simulated with randomly sampled I-values.
4. Discussion
This work has demonstrated the clinical impact of tissue I-value uncertainties on patient dose distributions in proton therapy. The treatments of three patients (prostate, pancreas, and liver) were simulated by varying all the nominal tissue I-values by ±5% and ±10%. The goal of this uniform variation study was to investigate the upper and lower bounds on range and dose variations that could occur due to the current estimates of tissue I-values uncertainties given in literature. Uniformly changing the tissue I-values affected both the height and width of the SOBP and caused R90 range variations within the patient up to 7.7 mm (4.4% of the beam range) and R80 range variations up to 4.8 mm (1.9% of the beam range). The change in the shape of the SOBP also resulted in variations in the mean dose to the target volumes and OARS up to 3.5%. The impact on the range and dose variations were most significant for deep seated targets due to the use of higher energy beams. A second probabilistic variation study was conducted in which the treatments were simulated using I-values that were randomly sampled according to a normal distribution with the mean equal to the nominal I-value and a standard deviation 5% and 10% of the nominal value. The range and dose differences were generally within the upper and lower bounds set by the 10% uniform variations due to the wash-out effect caused by the combination of higher and lower tissue I-values.
This work has shown that there are significant range uncertainties in patients due to I-value uncertainties which challenges the claim that sub-millimeter precision is achievable in proton therapy in clinical practice. Additionally, it is important to assess whether the common clinical margin recipes used in most proton centers (Paganetti 2012) appropriately account for the impact of I-value related range uncertainties. Clearly, a reduction in I-value uncertainties is necessary to decrease clinical margins and move towards sub-millimeter precision.
The determination of tissue I-values is an active area of research and a variety of techniques to reduce I-value uncertainties are being investigated. I-values for materials relevant to proton therapy can be extracted from range or stopping power measurements using the stopping power formula and also from dielectric response functions. One of the major limitations of determining the I-value from range and stopping power measurements is that the shell and Barkas correction terms in the stopping power equation are typically not known independently and must be determined concurrently (ICRU 1993). Therefore, because the resulting I-values depend on the choice of correction model, the improvement of the shell and Barkas models would be one way to determine I-values with greater accuracy. Progress in these areas has been reported by Bichsel (2002). The dielectric response method has the advantage of intrinsically better accuracy but it is limited by the scarce amount of input data available and I-values can vary by several eV depending on the choice of K-shell and dielectric data that is used (ICRU 1993, Emfietzoglou 2009). A good overview of the current challenges in this area is provided by Emfietzoglou (2009). Additionally, improvements to the Bragg additivity rule would subsequently improve the accuracy of I-values for tissues in which experimental data is still not available. One approach would be to apply the additivity rule to the molecular fragments instead of the constituent atoms in order to take into account the effect of chemical bonds. This was first proposed and applied by Thompson (1952) for some compounds. More recent investigations have been done by several authors (Oddershede and Sabin 1989, Sabin and Oddershede 1994, Cruz et al 1993, and Cabrera-Trujillo et al 2002), but further work using these methods is needed.
Even if the I-values of human tissues could be determined with greater accuracy, clinically, the I-value could still be miss-assigned due to uncertainties in the conversion of CT numbers to tissue stopping powers, the different compositions of similar tissues typically assumed to be clinically identical, and the variability in the composition of the same tissue from site-to-site and person-to-person. So before sub-millimeter precision can be achieved with proton therapy, not only must we improve the current experimental techniques used to measure tissue I-values, but also a combined effort must be made to reduce the uncertainties in each of these other areas as well.
5. Conclusion
The volume of patients treated with proton therapy is steadily rising, evidenced by the recent surge in proton therapy clinics being constructed or planned. As the availability of proton therapy increases, it is imperative to further our understanding on the uncertainties associated with this advanced cancer treatment. Perhaps much of the attention should be afforded to minimizing the incomplete knowledge on the exact range of the “sharp edge” proton beam that is delivered in the patient. Hitherto, the clinical impact of one of the principal contributors to range uncertainties, i.e. the I-value, remained elusive. This investigation demonstrated that I-value uncertainties might impact the efficacy of proton therapy treatments. Therefore, a reduction in I-value uncertainties is necessary to reduce clinical margins and help ensure efficacious clinical outcomes.
Acknowledgements
Funding for this research was partially supported by the Morgridge Institute for Research. HP was supported by NIH/NCI grant P01 CA-21239 “Proton Therapy Research”. The authors would like to thank the UW-Madison Center for High Throughput Computing (CHTC) for providing computational support and Jan Schuemann for providing relevant data.
Footnotes
The Errata and Addenda for ICRU Report 73, Stopping of Ions Heavier than Helium (Sigmund et al 2009) states that the I-value of 67.2 eV given in Report 73 is erroneously less than the value of 75.5 eV given for water vapor and recommends using an I-value more consistent with current information.
References
- Akkerman A, Akkerman E. Characteristics of electron inelastic interactions in organic compounds and water over the energy range 20–1000 eV. J. Appl. Phys. 1999;86:5809–5816. [Google Scholar]
- Andreo P. On the clinical spatial resolution achievable with protons and heavier charged particle radiotherapy beams. Phys. Med. Biol. 2009;54:N205–N215. doi: 10.1088/0031-9155/54/11/N01. [DOI] [PubMed] [Google Scholar]
- Agnostinelli S, et al. GEANT4—a sim.toolkit. Nucl. Instrum. Methods Phys. Res. A. 2003;506:250–303. [Google Scholar]
- Bichsel H. Shell corrections in stopping power. Phys. Rev. A. 2002;65:052709. [Google Scholar]
- Bichsel H, Hiraoka T. Energy loss of 70 MeV protons in elements. Nucl. Instrum. Methods B. 1992;66:345–351. [Google Scholar]
- Cabrera-Trujillo R, Cruz SA, Soullard J. Bond stopping cross sections for protons incident on molecular targets within the OLPA/FSGO implementation of the kinetic theory. Nucl. Instrum. Methods Phys. Res. 1994;93:166–174. [Google Scholar]
- Cabrera-Trujillo R, Öhrn Y, Deumens E, Sabin JR. Trajectory and molecular binding effects in stopping cross section for hydrogen beams on H2. J. Chem. Phys. 2002;116:2783–2793. [Google Scholar]
- Cruz SA, Soullard J, Cabrera-Trujillo R. Firsov approach to chemical bond effects on the low energy electronic stopping power of heavy ions. Nucl. Instrum. Methods Phys. Res. 1993;83:5–14. [Google Scholar]
- Dingfelder M, Hantke D, Inokuti Mand, Paretzke HG. Electron inelastic-scattering cross sections in liquid water. Radiat. Phys. Chem. 1998;53:1–18. [Google Scholar]
- Emfietzoglou D, Garcia-Molina R, Kyriakou I, Abril I, Nikjoo H. A dielectric response study of the electronic stopping power of liquid water for energetic protons and a new I-value for water. Phys. Med. Biol. 2009;54:3451–3472. doi: 10.1088/0031-9155/54/11/012. [DOI] [PubMed] [Google Scholar]
- Espana S, Paganetti H. The impact of uncertainties in the CT conversion algorithm when predicting proton beam ranges in patients from dose and PET-activity distributions. Phys. Med. Biol. 2010;55:7557–7572. doi: 10.1088/0031-9155/55/24/011. [DOI] [PubMed] [Google Scholar]
- Fano U. Atomic Theory of Electromagnetic Interactions in Dense Materials. Phys. Rev. 1956;103:1202–1218. [Google Scholar]
- Fano U. Penetration of protons, alpha particles, and mesons. Annu. Rev. Nucl. Sci. 1963;13:1–66. [Google Scholar]
- Garcia-Molina R, Abril I, Denton CD, Heredia-Avalos S, Kyriakou I, Emfietzoglou D. Calculated depth-dose distributions for H+ and He+ beams in liquid water. Nucl. Instrum. Methods. 2009;267:2647–2652. [Google Scholar]
- ICRU. ICRU Report 37. Bethesda, MD: International Commission on Radiation Units and Measurements; 1984. Stopping Powers for Electrons and Positrons. [Google Scholar]
- ICRU. ICRU Report 49. Bethesda, MD: International Commission on Radiation Units and Measurements; 1993. Stopping Powers and Ranges for Protons and Alpha Particles. [Google Scholar]
- ICRU. ICRU Report 73. Bethesda, MD; ICRU; 2005. Stopping of Ions Heavier Than Helium. [DOI] [PubMed] [Google Scholar]
- Inokuti M, Dehmer JL, Baer T, Hanson JD. Oscillator-strength moments, stopping powers, and total inelastic-scattering cross sections of all atoms through strontium. Phys. Rev. A. 1981;23:95–108. [Google Scholar]
- Jiang H, Paganetti H. Adaptation of GEANT4 to Monte Carlo dose calculations based on CT data. Med. Phys. 2004;31:2811–2818. doi: 10.1118/1.1796952. [DOI] [PubMed] [Google Scholar]
- Kamakura S, Sakamoto N, Ogawa H, Tsuchida H, Inokuti M. Mean excitation energies for the stopping power of atoms and molecules evaluated from oscillator-strength spectra. J. Appl. Phys. 2006;100:064905. [Google Scholar]
- Kramer M, Jakel O, Haberer T, Kraft G, Schardt D, Weber U. Treatment planning for heavy-ion radiotherapy: physical beam model and dose optimization. Phys. Med. Biol. 2000;45:3299–3317. doi: 10.1088/0031-9155/45/11/313. [DOI] [PubMed] [Google Scholar]
- Kumazaki Y, Akagi T, Yanou T, Suga D, Hishikawa Y, Teshima T. Determination of the mean excitation energy of water from proton beam ranges. Radiat. Meas. 2007;42:1683–1691. [Google Scholar]
- Luo S, Zhang X, Joy DC. Experimental determination of electron stopping power at low energies. Radiat. Eff. Defects Solids. 1991;117:235–242. [Google Scholar]
- Nohadani O, Seco J, Martin B C, Bortfeld T. Dosimetry robustness with stochastic optimization. Phys. Med. Biol. 2009;54:3421–3432. doi: 10.1088/0031-9155/54/11/010. [DOI] [PubMed] [Google Scholar]
- Oddershede, Sabin Bragg rule additivity of bond stopping cross sections. Nucl. Instrum. Methods Phys. Res. 1989;42:7–10. [Google Scholar]
- Paganetti H, Jiang H, Lee S-Y and Kooy H. Accurate Monte Carlo for nozzle design, commissioning, and quality assurance in proton therapy. Med. Phys. 2004;31:2107–2118. doi: 10.1118/1.1762792. [DOI] [PubMed] [Google Scholar]
- Paganetti H, Jiang H, Parodi K, Slopsema R, Engelsman M. Clinical implementation of full Monte Carlo dose calculation in proton beam therapy. Phys. Med. Biol. 2008;53:4825–4853. doi: 10.1088/0031-9155/53/17/023. [DOI] [PubMed] [Google Scholar]
- Paganetti H. Range uncertainties in proton therapy and the role of Monte Carlo simulation. Phys. Med. Biol. 2012;57:R99–R117. doi: 10.1088/0031-9155/57/11/R99. [DOI] [PMC free article] [PubMed] [Google Scholar]
- Paul H. The mean ionization potential of water, and its connection to the range of energetic carbon ions in water. Nucl. Instrum. Methods B. 2007a;255:435–437. [Google Scholar]
- Paul H. New developments in stopping power for fast ions. Nucl. Instrum. Methods B. 2007b;261:1176–1179. [Google Scholar]
- Sabin JR, Oddershede J. Status of the calculation of the energy loss of swift ions in molecules sections. Nucl. Instrum. Methods Phys. Res. 1994;64:678–683. [Google Scholar]
- Schneider W, Bortfeld T, Schlegel W. Correlation between CT numbers and tissue parameters needed for Monte Carlo simulations of clinical dose distributions. Phys. Med. Biol. 2000;45:459–478. doi: 10.1088/0031-9155/45/2/314. [DOI] [PubMed] [Google Scholar]
- Sheets NC, et al. Comparative effectiveness of intensity modulated radiation therapy (IMRT), proton therapy (PT), and conformal radiation therapy (CRT) in the treatment of localized prostate cancer. GUCS. 2012 Abstract 3. [Google Scholar]
- Shiles E, Sasaki T, Inokuti M, Smith DY. Self-consistency and sum-rule tests in the Kramers Kronig analysis of optical data: Applications to aluminum. Phys. Rev. B. 1980;22:1612–1628. [Google Scholar]
- Sigmund P, Schinner A, Paul H. Errata and Addenda: ICRU Report 73 (Stopping of Ions Heavier than Helium), International Commission on Radiation Units and Measurements. 2009 [Google Scholar]
- Sihver L, Schardt D, Kanai T. Depth-dose distributions of high-energy carbon, oxygen and neon beams in water. Japan. J. Med. Phys. 1998;18:1–21. [Google Scholar]
- Tan Z, Xia Y, Zhao M, Liu X, Li F, Huang B, Ji Y. Electron stopping power and mean free path in organic compounds over the energy range of 20–10,000 eV. Nucl. Instrum. Methods B. 2004;222:27–43. [Google Scholar]
- Thompson JT. Ph.D. Thesis. University of California; 1952. (unpublished) [Google Scholar]
- Wilson JW, Xu YJ, Chang CK, Kamaratos E. Atomic mean excitation energies for stopping powers from local plasma oscillator strengths. J. Appl. Phys. 1984;56:860–861. doi: 10.1063/1.334023. [DOI] [PubMed] [Google Scholar]
- Yang M, Zhu XR, Park PC, Titt U, Mohan R, Virshup G, Clayton JE, Dong L. Comprehensive analysis of proton range uncertainties related to patient stopping-power-ratio estimation using the stoichiometric calibration. Phys. Med. Biol. 2012;57:4095–4115. doi: 10.1088/0031-9155/57/13/4095. [DOI] [PMC free article] [PubMed] [Google Scholar]
- Zeiss G, Meath W, MacDonald J, Dawson D. Accurate Evaluation of Stopping and Straggling Mean Excitation Energies for N, O, H2, N2, O2, NO, NH3, H2 O, and N2 O Using Dipole Oscillator Strength Distributions: A Test of the Validity of Bragg's Rule. Radiation Research. 1977;70:284–303. [Google Scholar]


