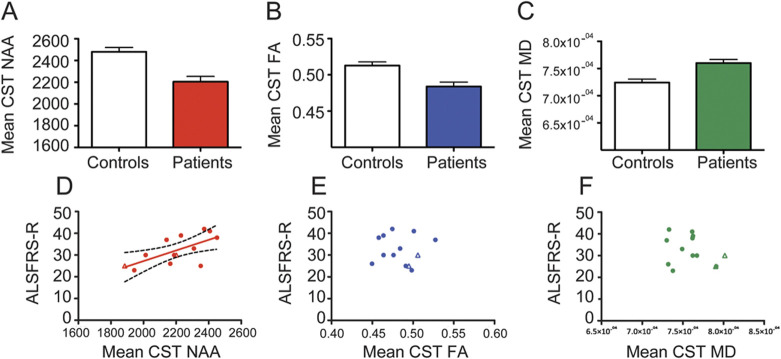
Figure 2. Comparison of CST NAA, FA, and MD between patients and controls (A–C), and in relation to disability in the patient group (D–F, 2 patients with PLS are shown as unfilled triangles in each).
Although all 3 measures are significantly different in the patient group, only NAA has a significant relationship with disability. (D) NAA: r = 0.65, p = 0.01; (E) FA: r = −0.03, p = 0.91; (F) MD: r = −0.29, p = 0.32. ALSFRS-R = Amyotrophic Lateral Sclerosis Functional Rating Scale–revised; CST = corticospinal tract; FA = fractional anisotropy; MD = mean diffusivity; NAA = N-acetylaspartate; PLS = primary lateral sclerosis.

