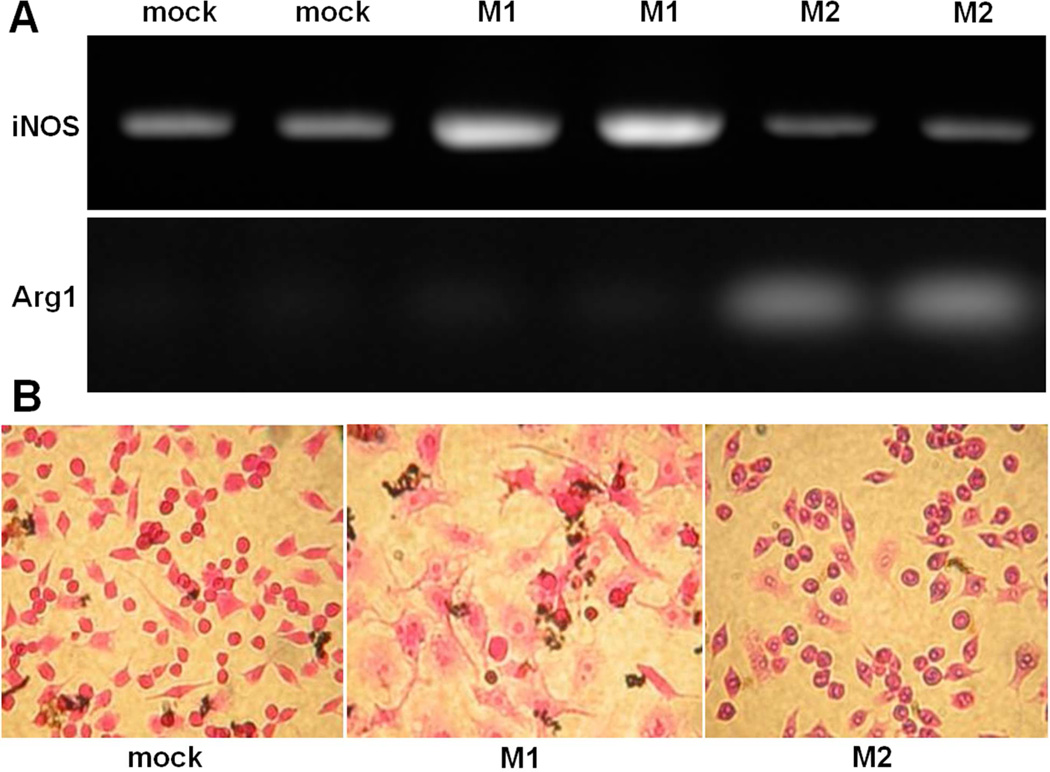
Figure 1.
(A) Assessment of iNOS (top) and Arg1 (bottom) expression. RAW 264.7 cells were stimulated for 24 h using 50 ng/mL of LPS (M1) and 50 ng/mL of IL-4 (M2) in comparison to untreated RAW 264.7 murine macrophage cell line (mock). The expected RT-PCR products of miNOS and mArg1 are 372 bp and 249 bp, respectively. (B) Phase contrast microscopy images (stained with hematoxylin and eosin) showing differences in granularity and nucleation between M1 and M2 macrophages compared to the unstimulated RAW 264.7 (mock-treated) cells.

