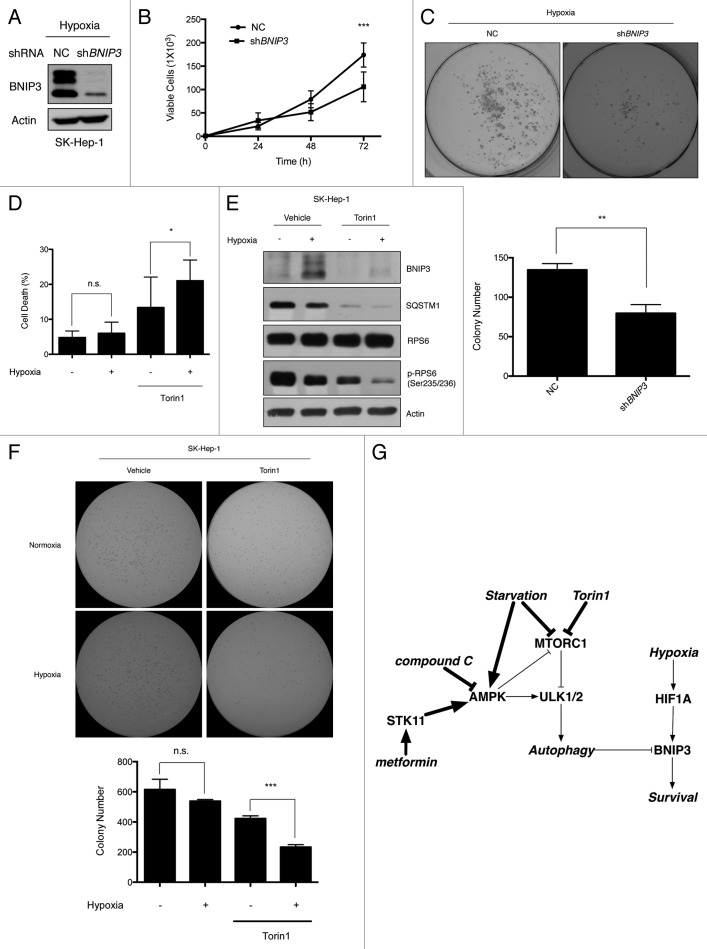
Figure 8. The viability of tumor cells is reduced in response to the loss of BNIP3 or Torin1 treatment. (A) Scrambled shRNA and BNIP3 shRNA were transfected into SK-Hep-1 cells. Knockdown of BNIP3 was confirmed by western-blot analysis. (B) Selected stable cell lines were incubated under hypoxic conditions for up to 72 h. The proliferation rate was assessed by counting viable cells at indicated time points. (C) For measurements of colony-forming ability, stable cell lines were plated at a low density (1000 cells/well) in 6-well plates and then incubated under hypoxic conditions for 7 d. Colonies were fixed and stained with crystal violet, and colony numbers were then counted using ImageJ software program (n = 3). (D) SK-Hep-1 cells were cultured under normoxia or hypoxia for 24 h, which was followed by the Torin1 treatment for additional 24 h. Cell death was assessed by the trypan blue assay. (E) BNIP3 degradation, MTORC1 inhibition and autophagy induction were confirmed by western-blot analysis. (F) SK-Hep-1 cells were cultured under normoxic or hypoxic conditions for 24 h and then treated with Torin1 for 24 h. After treatment, the cells were harvested and seeded in soft agar followed by incubation under hypoxia. Two weeks after the incubation, the cells were stained with crystal violet, and the colonies were counted by the ImageJ software program. (G) Schematic diagram of BNIP3 regulation by ULK1-dependent autophagy via MTORC1 and AMPK. The data are shown as means ± SD of three independent experiments performed in triplicate. t test; *p < 0.05, **p < 0.005, ***p < 0.0005, n.s., not significant.

An official website of the United States government
Here's how you know
Official websites use .gov
A
.gov website belongs to an official
government organization in the United States.
Secure .gov websites use HTTPS
A lock (
) or https:// means you've safely
connected to the .gov website. Share sensitive
information only on official, secure websites.
