

Abstract
Context:
People with prediabetes are at high risk of developing diabetes.
Objective:
The objective of this study was to determine the pathogenesis of fasting and postprandial hyperglycemia in prediabetes.
Design:
Glucose production, gluconeogenesis, glycogenolysis, and glucose disappearance were measured before and during a hyperinsulinemic clamp using [6,6-2H2]glucose and the deuterated water method corrected for transaldolase exchange.
Setting:
The study was conducted at the Mayo Clinic Clinical Research Unit.
Participants:
Subjects with impaired fasting glucose (IFG)/normal glucose tolerance (NGT) (n = 14), IFG/impaired glucose tolerance (IGT) (n = 18), and normal fasting glucose (NFG)/NGT (n = 16) were studied.
Intervention:
A hyperinsulinemic clamp was used.
Outcome Measures:
Glucose production, glucose disappearance, gluconeogenesis, and glycogenolysis were measured.
Results:
Fasting glucose production was higher (P < .0001) in subjects with IFG/NGT than in those with NFG/NGT because of increased rates of gluconeogenesis (P = .003). On the other hand, insulin-induced suppression of glucose production, gluconeogenesis, glycogenolysis, and stimulation of glucose disappearance all were normal. Although fasting glucose production also was increased (P = .0002) in subjects with IFG/IGT, insulin-induced suppression of glucose production, gluconeogenesis, and glycogenolysis and stimulation of glucose disappearance were impaired (P = .005).
Conclusions:
Fasting hyperglycemia is due to excessive glucose production in people with either IFG/NGT or IFG/IGT. Both insulin action and postprandial glucose concentrations are normal in IFG/NGT but abnormal in IFG/IGT. This finding suggests that hepatic and extrahepatic insulin resistance causes or exacerbates postprandial glucose intolerance in IFG/IGT. Elevated gluconeogenesis in the fasting state in IFG/NGT and impaired insulin-induced suppression of both gluconeogenesis and glycogenolysis in IFG/IGT suggest that alteration in the regulation of these pathways occurs early in the evolution of type 2 diabetes.
People with impaired fasting glucose (IFG) (ie, fasting glucose 100–125 mg/dL) have an increased likelihood of developing diabetes with the risk being particularly high in people with combined IFG and impaired glucose tolerance (IGT) (ie, a 2-hour oral glucose tolerance test [OGTT] glucose value of 140–199 mg/dL) (1–3). The pathogenesis of fasting and postprandial hyperglycemia in subjects with IFG remains an area of active investigation. People with IFG/IGT have defects in both insulin secretion and extrahepatic insulin action (4–10). On the other hand, the situation is not as clear in people with IFG and normal glucose tolerance (NGT). These individuals have been reported to have normal or minimally decreased insulin secretion and normal or minimally decreased insulin action (4–11).
We and others have reported that glucose production in individuals with IFG is either increased or inappropriately elevated relative to the prevailing glucose and insulin concentrations in the fasting state (11–13). It has been less clear whether IFG is associated with hepatic insulin resistance since Weyer et al (12) reported that insulin-induced suppression of glucose production is impaired in people with either isolated IFG or combined IFG/IGT, whereas Perreault et al (11) reported that suppression is normal in both groups. We recently reported that insulin-induced suppression of glucose production is impaired in people with IFG (13). However, the latter experiments combined individuals who had either IFG/NGT or IFG/IGT, precluding determination of whether hepatic insulin resistance was a characteristic of IFG or whether it was due to the concomitant presence of IGT. Lack of suppression of glucose production was attributed to increased rates of gluconeogenesis (13). Although not statistically significant, rates of glycogenolysis were numerically higher in the subjects with IFG than in those with normal fasting glucose (NFG). Interpretation of this observation was confounded by the fact that, despite infusion of insulin, glucose concentrations during the clamp remained higher in the subjects with IFG than in those with NFG (13).
With the present experiments, we sought to gain insight into the pathogenesis of IFG, alone or in combination with IGT, by measuring glucose production, gluconeogenesis, glycogenolysis, and glucose disposal in subjects with NFG/NGT, IFG/NGT, or IFG/IGT after an overnight fast and during a hyperinsulinemic-euglycemic clamp when somatostatin, insulin, and glucagon were infused to ensure comparable portal insulin and glucagon concentrations in all groups (5, 9). Glucose concentrations were raised to ∼6.2 mmol/L in the subjects with NFG and maintained at that level in the subjects with IFG so glucose concentrations would be the same in all groups during the clamp. Gluconeogenesis and glycogenolysis were measured using the deuterated water method corrected for transaldolase exchange using a concurrent infusion of [1-13C]acetate as described previously (14).
Subjects and Methods
Subjects
After approval by the Mayo Institutional Review Board and informed written consent, subjects were enrolled after screening for fasting glucose based on the American Diabetes Association position statement on diagnosis and classification of prediabetes published in Diabetes Care in January 2008 (at the time the study was designed) of fasting plasma glucose between 100 and 125 mg/dL. The primary aim was to determine the metabolic defects (hepatic and extrahepatic) that result in fasting hyperglycemia in people with either IFG alone or in combination with IGT. Hence we did not study people with NFG/IGT. They could be an interesting study group but present an entirely different disease because they would not qualify as having IFG under the American Diabetes Association guidelines applied for this study. A healthy control group consisting of subjects with NFG/NGT was included for comparison.
After screening, an OGTT was performed, and 16 subjects with NFG/NGT, 14 subjects with IFG/NGT, and 18 subjects with IFG/IGT matched for age and body mass index were included in the study. To avoid selection bias, subjects were consecutively accrued in the order they were screened and met the enrollment criteria. Subjects were in good health, were at a stable weight, and did not engage in regular vigorous exercise. Subjects did not have a history of diabetes in their first-degree relatives. No subjects were common to the current and prior reports (5, 13).
Experimental design
Subjects were admitted to the clinical research unit of the Mayo Center for Translational Science Activities at ∼1700 hours on the evening before the study and were provided a standard meal (10 cal/kg; carbohydrate/fat/protein, 55:30:15). Subjects then ingested 1.67 g of 2H2O per kg of lean body weight of water in 3 equally divided doses at 2200, 2400, and 0200 hours. The subjects were thereafter permitted sips of water containing 2H2O if they so desired but otherwise continued fasting.
Subjects were awakened the following morning, and catheters were placed in forearm veins for tracer infusion and sampling of arterialized venous blood as described previously (15). At 0600 hours (−180 min) infusions of [3-3H]glucose (12 μCi prime and 0.12 μCi/min continuous), and [1-13C] acetate (5.0 μmol/kg per min) were started and continued until the end of the study. A constant infusion containing somatostatin (60 ng/kg per min), glucagon (0.65 ng/kg per min), and insulin (0.35 mU/kg per min) was started at 1000 hours (time 0) and continued for the next 240 minutes to ensure constant and equal portal hormone concentrations (15). Blood was sampled for glucose and hormone measurements at timed intervals. Samples for [3-3H]glucose specific activity and [3-13C]glucose, [4-13C]glucose, [5-2H]glucose, and [2-2H]glucose enrichments were obtained at −30, −20, −10, 0, 210, 220, 230, and 240 minutes.
An infusion of 50% dextrose containing [3-3H]glucose was started at time 0 and given in amounts sufficient to maintain glucose at ∼6.2 mmol/L to match the concentrations that were expected to be observed in the subjects with IFG during the clamp (13). In addition, the basal infusions of [3-3H]glucose were tapered beginning at time 0 in a pattern that mimicked the anticipated changes in glucose production to minimize the changes in plasma glucose enrichment and specific activity as described previously (16).
Analytical techniques
All blood samples were stored at −80°C until analyses. Plasma glucose was analyzed using a GM9 Analox glucose analyzer (Analox Instruments, London, United Kingdom). Plasma insulin, C-peptide, glucagon concentrations, and [3-3H]glucose specific activity were measured as described previously (17, 18). Body composition was measured using dual-energy X-ray absorptiometry (DPX Scanner; Hologic, Inc, Waltham, Massachusetts). 13C enrichment of glucose was measured using nuclear magnetic resonance (NMR) analysis of monoacetone glucose derivative (14, 19, 20). NMR signals were quantified using the NUTS NMR spectral analysis program (Acorn NMR Inc, Fremont, California) (14).
Calculations
All rates are expressed per kilogram of lean body mass per minute. Glucose turnover was calculated using the steady-state equations of Steele et al (21). Glucose production was calculated by subtracting the glucose infusion rate required to clamp glucose concentration from total glucose appearance. At baseline, glucose production equals glucose disappearance. The fraction of plasma glucose derived from transaldolase exchange was calculated as the plasma [3-13C]glucose to [4-13C]glucose ratio (14). Deuterium enrichment on C5 was calculated by multiplying uncorrected C5 enrichment by the plasma [3-13C]glucose to [4-13C]glucose ratio (14). Gluconeogenesis was calculated by multiplying the corrected C5/C2 ratio times glucose production (14) and glycogenolysis was calculated by subtracting corrected gluconeogenesis from glucose production (14).
Statistical analyses
Data in the text and figures are expressed as means ± SEM. Values from −30, −20, −10, and 0 minutes were averaged as basal and values from 210, 220, 230, and 240 minutes were averaged as clamp for statistical analysis and presentation in the figures and text. A 3 group (NFG/NGT, IFG/NGT, IFG/IGT) by 2 study period (basal, steady state at end of clamp) repeated-measures ANOVA was fit using PROC Mixed for each outcome (SAS Institute, Cary, North Carolina). These models consisted of the main effects of study group and study period along with their interaction terms. The estimated model parameters were used to estimate differences in profiles of outcome variables at basal and at the end of the clamp between groups. Specifically, the model was used to test whether rates of glucose production, gluconeogenesis, and glycogenolysis were higher and glucose disappearance was lower in the subjects with IFG/IGT than in those with NFG/NGT and in the subjects with IFG/NGT than in those with the NFG/NGT. For comparisons of continuous measures among the 3 groups when only one observation was made (eg, glucose concentrations after OGTT or the ratio of plasma [3-13C]glucose/[4-13C]glucose was less than 1.0), a 1-way ANOVA was used. Planned statistical comparisons and the overall model likelihood ratio test were used to control the type I error rate (ie, Fisher least significant difference approach). As such, P values reported have not been adjusted for multiple comparisons. A value of P < .05 was considered statistically significant.
Results
Subject characteristics
Age, sex, weight, body mass index, and percent body fat did not differ among the 3 groups (please see Supplemental Table 1 published on The Endocrine Society's Journals Online web site at http://jcem.endojournals.org). At the time of screening, fasting glucose (89 ± 6 vs109 ± 6 vs 107 ± 7 mg/dL) and glycosylated hemoglobin (HbA1c) (5.2 ± 0.4 vs 5.5 ± 0.3 vs 5.7 ± 0.4%) were lower (P < .05) in subjects with NFG/NGT than in those with IFG/NGT and IFG/IGT. On the other hand, whereas glucose concentrations 2 hours after ingestion of 75 g of glucose did not differ in the subjects with NFG/NGT (122 ± 22 mg/dL) and IFG/NGT (121 ± 27 mg/dL), they were higher (P < .001) in the subjects with IFG/IGT (169 ± 18 mg/dL).
Isolated fasting hyperglycemia
Plasma glucose, insulin, C-peptide, and glucagon concentrations (Figure 1)
Figure 1.
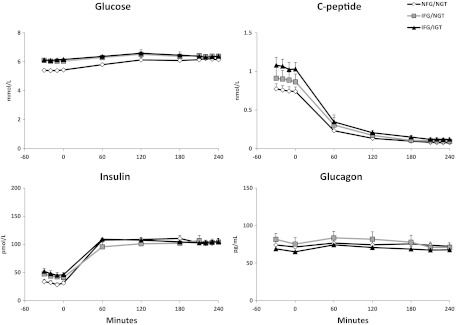
Plasma glucose, insulin, C-peptide, and glucagon concentrations observed before and during the clamp in the NFG/NGT (open diamonds), IFG/NGT (gray rectangles), and IFG/IGT (black triangles) subjects. An insulin infusion was started at time 0.
Plasma glucose concentrations were higher in subjects with IFG/NGT than in those with NFG/NGT before the clamp (6.1 ± 0.1 vs 5.4 ± 0.1 mmol/L; P < .001) but did not differ during the clamp (6.4 ± 0.1 vs 6.2 ± 0.1 mmol/L; P = .30). Insulin concentrations were not statistically different between the subjects with IFG/NGT and NFG/NGT either before (42 ± 8 vs 31 ± 3 pmol/L; P = .20) or during the clamp (104 ± 6 vs 103 ± 5 pmol/L; P = .84). Similarly, C-peptide concentrations did not differ in subjects with IFG/NGT and NFG/NGT (1.0 ± 0.1 vs 0.8 ± 0.1 pmol/L; P = .09) before the clamp and were no different during the clamp, indicating comparable suppression of endogenous insulin secretion. Glucagon concentrations did not differ in subjects with IFG/NGT and NFG/NGT either before (79 ± 8 vs 73 ± 5 pg/mL; P = .5) or during clamp (71 ± 6 vs 73 ± 4 pg/mL; P = .7).
Plasma [3-13C]glucose to [4-13C]glucose ratios
The plasma [3-13C]glucose to [4-13C]glucose ratio did not differ between the subjects with IFG/NGT and NFG/NGT either before (0.80 ± 0.04 vs 0.70 ± 0.03) or during (0.66 ± 0.04 vs0.50 ± 0.04) the clamp. The plasma [3-13C]glucose to [4-13C]glucose ratio was less than 1.0 (P < .001) in both groups both before and during the clamp, indicating the presence of transaldolase exchange (14).
Rates of glucose production and glucose disappearance (Figure 2)
Figure 2.
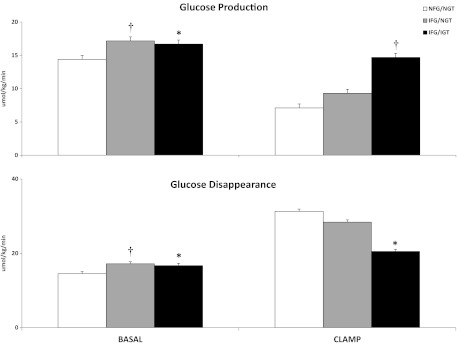
Rates of glucose production and glucose disappearance observed in the subjects with NFG/NGT (white bars), IFG/NGT (gray bars), and IFG/IGT (black bars) before (basal) and during the insulin infusion (clamp). *P < .05; †P < .0001 vs NFG/NGT.
The rate of glucose production and rate of glucose disappearance was higher in subjects with IFG/NGT than in those with NFG/NGT (17.1 ± 0.4 vs 14.4 ± 0.7 μmol/kg per min; P < .0001) before the clamp but did not differ during the clamp (9.3 ± 1.2 vs 7.1 ± 1.0 μmol/kg per min; P = .12). The rate of glucose disappearance at baseline was higher in subjects with IFG/NGT than in subjects with NFG/NGT, presumably because of the mass action effect of glucose. However, the rate of glucose disappearance did not differ between groups during the clamp (28.4 ± 4.1 vs 31.3 ± 2.6 μmol/kg per min; P = .47).
Rates of gluconeogenesis and glycogenolysis (Figure 3)
Figure 3.
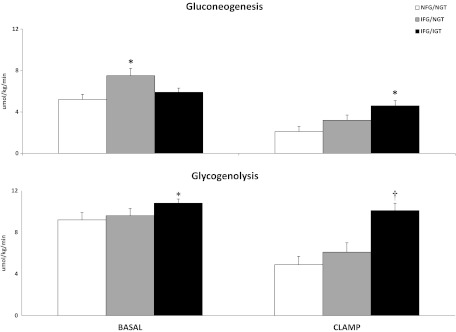
Rates of gluconeogenesis and glycogenolysis observed in the subjects with NFG/NGT (white bars), IFG/NGT (gray bars), and IFG/IGT (black bars) before (basal) and during the insulin infusion (clamp). *P < .05; †P < .0001 vs NFG/NGT.
The rate of gluconeogenesis was higher in the subjects with IFG/NGT than in those with NFG/NGT (7.5 ± 0.7 vs 5.2 ± 0.4 μmol/kg per min; P = .003) before the clamp but did not differ during the clamp (3.2 ± 0.5 vs 2.1 ± 0.4 μmol/kg per min; P = .1). In contrast, the rate of glycogenolysis did not differ between groups either before (9.6 ± 0.7 vs 9.2 ± 0.5 μmol/kg per min; P = .61) or during the clamp (6.1 ± 0.9 vs 4.9 ± 0.7 μmol/kg per min; P = .25).
Free fatty acid (FFA) concentrations
FFA concentrations did not differ in the IFG/NGT and NFG/NGT groups either before (0.46 ± 0.05 vs 0.49 ± 0.05 mmol/L; P = .73) or during (0.16 ± 0.05 vs 0.09 ± 0.03 mmol/L; P = .25) the clamp.
Lactate concentrations
Lactate concentrations were higher in the IFG/NGT than NFG/NGT groups before the clamp (1.4 ± 0.1 vs 1.0 ± 0.1 mmol/L; P = .03) but were not different during (1.1 ± 0.1 vs 1.0 ± 0.1 mmol/L; P = .44) the clamp.
Combined fasting and postprandial hyperglycemia
Plasma glucose, insulin, C-peptide, and glucagon concentrations (Figure 1)
Plasma glucose (6.1 ± 0.1 vs 5.4 ± 0.1 mmol/L; P < .001) and insulin (49 ± 6 vs 31 ± 3 pmol/L; P = .02) concentrations were higher in the subjects with IFG/IGT than in those with NFG/NGT before the clamp but did not differ during the clamp (respectively, 6.4 ± 0.2 vs 6.2 ± 0.1 mmol/L, P = .19; 104 ± 3 vs 103 ± 5 pmol/L, P = .8). C-peptide concentrations were significantly higher in subjects with IFG/IGT before the clamp (1.1 ± 0.1 vs 0.7 ± 0.1 pmol/L; P = .02) and were comparably suppressed in both groups after somatostatin infusion. Plasma glucagon concentrations did not differ between the subjects with IFG/IGT and NFG/NGT either before (66 ± 5 vs 73 ± 5 pg/mL; P = .4) or during the clamp (67 ± 2 vs 73 ± 4 pg/mL; P = .3).
Plasma [3-13C]glucose to [4-13C]glucose ratios
The plasma [3-13C]glucose to [4-13C]glucose ratio did not differ between the subjects with IFG/IGT and NFG/NGT either before (0.73 ± 0.02 vs 0.70 ± 0.03) or during (0.61 ± 0.02 vs 0.50 ± 0.04) the clamp. The plasma [3-13C]glucose to [4-13C]glucose ratio was less than 1.0 (P < .001) in both groups both before and during the clamps, indicating the presence of transaldolase exchange (14).
Rates of glucose production and glucose disappearance (Figure 2)
The rate of glucose production (and rate of glucose disappearance) was higher in the subjects with IFG/IGT than in those with NFG/NGT both before (16.7 ± 0.3 vs 14.4 ± 0.4 μmol/kg per min; P = .0002) and during the clamp (14.7 ± 0.7 vs 7.1 ± 1.0 μmol/kg per min; P < .0001). When glucose and insulin concentrations were matched during the clamp, the rate of glucose disappearance was lower in the subjects with IFG/IGT than in those with NFG/NGT (20.5 ± 1.2 vs 31.3 ± 2.6 μmol/kg per min; P = .005).
Rates of gluconeogenesis and glycogenolysis (Figure 3)
The rate of gluconeogenesis did not differ in the subjects with IFG/IGT and NFG/NGT before the clamp (5.9 ± 0.4 vs 5.2 ± 0.4 μmol/kg per min; P = .32) but was higher in the subjects with IFG/IGT during the clamp (4.5 ± 0.4 vs 2.1 ± 0.4 μmol/kg per min; P = .0002). In contrast, the rate of glycogenolysis was different in the subjects with IFG/IGT than in those with NFG/NGT both before (10.8 ± 0.4 vs 9.2 ± 0.5 μmol/kg per min; P = .03) and during the clamp (10.1 ± 0.4 vs 4.9 ± 0.7 μmol/kg per min; P < .0001).
FFA concentrations
FFA concentrations did not differ in the IFG/IGT and NFG/NGT groups either before (0.53 ± 0.05 vs 0.49 ± 0.05 mmol/L; P = .58) or during (0.18 ± 0.05 vs 0.09 ± 0.03 mmol/L; P = .12) the clamp.
Lactate concentrations
Lactate concentrations were higher in the IFG/IGT than in the NFG/NGT group both before (1.5 ± 0.1 vs 1.0 ± 0.1 mmol/L; P = .004) and during (1.4 ± 0.1 vs 1.0 ± 0.1 mmol/L; P = .001) the clamp.
Correlations
Fasting glucose correlated with basal glucose production (r = 0.52; P = .0002) and basal glycogenolysis (r = 0.29; P = .05), whereas 2-hour glucose correlated with clamp glucose production (r = 0.5; P = .0001), clamp gluconeogenesis (r = 0.33; P = .02), and clamp glycogenolysis (r = 0.57; P < .0001), respectively. However, fasting glucose was not correlated to basal gluconeogenesis (r = 0.20; P = .18).
Discussion
The current data provide insight regarding the mechanism of fasting hyperglycemia in people with IFG. After an overnight fast, glucose production is increased in people with isolated IFG (ie, IFG/NGT) due to excessive rates of gluconeogenesis. On the other hand, a small increase in insulin concentration, comparable to that commonly observed after eating (5, 9), results in normal (or near normal) suppression of glucose production, gluconeogenesis, and glycogenolysis as well as normal stimulation of glucose disappearance. In contrast, whereas fasting glucose production also is increased in people with combined IFG/IGT, insulin-induced suppression of glucose production, gluconeogenesis, and glycogenolysis and stimulation of glucose disappearance are impaired, indicating concomitant hepatic and extrahepatic insulin resistance.
These data indicate that an increase in glucose production is the cause of fasting hyperglycemia in both the IFG/NGT and IFG/IGT groups. These data also provide evidence that normal hepatic and extrahepatic insulin action coupled with preserved (at least relatively) insulin secretion (5, 9, 11), results in normal postprandial glucose concentrations in people with IFG/NGT. In contrast, impaired suppression of glucose production and stimulation of glucose disappearance in the absence of a compensatory increase in insulin secretion (5, 9, 11) leads to postprandial hyperglycemia in people with IFG/IGT.
Isolated fasting hyperglycemia
The current data indicate that regulation of glucose metabolism in people with isolated fasting hyperglycemia differs from that in those with NFG/NGT. The current experiments were designed so that regulation of hepatic glucose metabolism could be examined in people with IFG/NGT after an overnight fast when glucose concentrations differed from those present in people with NFG/NGT and during a pancreatic clamp when glucose (as well as insulin and glucagon) concentrations were matched. Consistent with previous reports (11), both fasting glucose production and glucose disappearance were increased in the IFG/NGT group, indicating that excessive glucose release rather than an absolute decrease in glucose disposal is the cause of fasting hyperglycemia. The present study establishes that the increase in glucose production was due to increased rates of gluconeogenesis. FFA concentrations did not differ between groups, suggesting an abnormality intrinsic to the gluconeogenic pathway rather than an indirect effect of altered lipid metabolism.
In contrast to the fasting state, insulin-induced suppression of glucose production and stimulation of glucose uptake did not differ in the subjects with IFG/NGT and NFG/NGT during the clamp, indicating normal hepatic and extrahepatic insulin action. These data are consistent with those previously reported by Perreault et al (11) but differ from those of Weyer et al (12), who observed defects in both suppression of glucose production and stimulation of glucose disposal. However, the insulin concentrations achieved in those experiments were approximately 3-fold higher than those in the present experiments (presumably due to differences in both insulin infusion rates and insulin assays). In addition, the subjects in those studies were Native Americans from the Gila Indian Community, suggesting that the pathogenesis of IFG/NGT may differ in different ethnic groups. On the other hand, although rates of glucose production during the clamp did not differ significantly, glucose production in the subjects with IFG/NGT was numerically higher than that in the subjects with NFG/NGT, indicating that a subtle defect in hepatic insulin action may have been present. The observation in the current study that insulin-induced suppression of gluconeogenesis and glycogenolysis also was not impaired further supports the conclusion that regulation of hepatic glucose metabolism by insulin is either normal or at most minimally impaired in people with IFG/NGT.
Combined fasting and postprandial hyperglycemia
Compared with people with NFG/NGT, people with IFG/IGT had increased rates of glucose production after an overnight fast as well as impaired insulin-induced suppression of glucose production and stimulation of glucose disposal during the clamp. These results are consistent with those reported by Weyer et al (12) but differ from those of Perreault et al (11) who reported normal rates of glucose production and uptake in people with IFG/IGT both before and during a clamp. In those studies (11), as well as in our own previous studies (12), glucose concentrations were higher in the subjects with IFG/IGT than in those with NFG/NGT during the clamp, possibly overestimating both suppression of glucose production and stimulation of glucose disappearance. This result also may be the reason that in the present experiments the rate of gluconeogenesis was not increased in the subjects with IFG/IGT before the clamp but clearly was elevated during the clamp when glucose as well as insulin and glucagon concentrations were matched to those present in the subjects with NFG/NGT.
Of note, the rate of glycogenolysis was higher in the subjects with IFG/IGT than in those with NFG/NGT both before and during the clamp, perhaps indicating a more severe defect in the regulation of the glycogenolytic pathway. Impaired insulin-induced suppression of glycogenolysis in the subjects with IFG/IGT is intriguing in view of the observation that glycogenolysis also is increased in subjects with mild but overt type 2 diabetes (14, 22) under conditions in which glucose and insulin concentrations are matched. Furthermore, C5 glucose (derived from the gluconeogenesic pathway) that is first incorporated into glycogen and then subsequently released from glycogen into the glucose pool during the 4 hours of the experiment would have been calculated as gluconeogenesis rather than glycogenolysis. Therefore, actual rates of glycogenolysis may have been higher than calculated rates. This could potentially lead to an error in the estimation of the magnitude of the difference in the rates of glycogenolysis between the groups.
We have established that transaldolase exchange occurs in humans (14, 23, 24) and results in labeling of the C5 of glucose with deuterium from carbon exchange rather than from new synthesis of glucose. This was evident in the present experiments because the plasma [3-13C]glucose to [4-13C]glucose ratio consistently was less than 1 in all groups both before and during the clamps and because uncorrected rates of gluconeogenesis were consistently higher than corrected rates in all groups both before and during the clamp. Because glycogenolysis is calculated by subtracting the rate of gluconeogenesis from glucose production, an overestimation of gluconeogenesis due to transaldolase exchange results in a proportionate underestimation of glycogenolysis. As described previously (23, 24), measurement of the plasma [3-13C]glucose to [4-13C]glucose ratio enables correction for transaldolase exchange. The observations that calculated rates of transaldolase exchange are constant (ie, did not differ in the NFG/NGT, IFG/NGT, and IFG/IGT groups), are the same in those with and without type 2 diabetes (23, 24), and are not altered by infusion of insulin (23, 24) are reassuring. Therefore, even without correcting for transaldolase exchange, the deuterated water method probably provides useful qualitative information regarding rates of gluconeogenesis and glycogenolysis in humans.
Limitations
FFAs modulate glycogenolysis and gluconeogenesis (25). Although we did not measure FFA turnover, FFA concentrations did not differ among groups either before or during the clamps. Therefore, differences in FFA concentrations are not likely to account for the differences in gluconeogenesis and glycogenolysis observed between the groups. We also did not perform indirect calorimetry and hence are unable to comment on substrate oxidation. Lactate concentrations were higher in people with IFG/NGT in the basal state and both before and during clamp in people with IFG/IGT than in those with NFG/NGT. However, we did not measure lactate turnover in these experiments and hence cannot draw definitive conclusions regarding the cause of this observation.
We also could not measure portal insulin concentrations during the clamp. However, comparable suppression of insulin secretion (as evident from the suppressed C-peptide concentrations) and the comparable peripheral insulin concentrations strongly suggest that portal insulin concentrations were the same in all 3 groups during the clamp. Similarly, we do not know the portal glucagon concentrations. The fact that peripheral glucagon concentrations did not differ either before or during the somatostatin replacement glucagon infusion suggests that portal glucagon concentrations also were the same in all 3 groups.
Taken together, these data indicate that excessive glucose production is the cause of fasting hyperglycemia in people with either isolated IFG or combined IFG/IGT. Increased rates of gluconeogenesis are the cause of the excessive fasting glucose production in people with IFG/NGT and, along with increased rates of glycogenolysis, probably contribute to increased fasting glucose production in people with IFG/IGT. Postprandial hyperglycemia does not occur in people with isolated IFG because insulin-induced suppression of glucose production and insulin-induced stimulation of glucose uptake are not impaired, and insulin secretion is relatively preserved (11, 23, 24). In contrast, people with IFG/IGT have defects in hepatic insulin action and extrahepatic action as well as defects in insulin secretion (11, 23, 24), which in combination lead to postprandial hyperglycemia. Impaired insulin-induced suppression of glycogenolysis in the subjects with IFG/IGT is intriguing in view of the observation that glycogenolysis also is increased in subjects with mild but overt diabetes (22) under conditions in which glucose and insulin concentrations are matched. These data suggest that alterations in the regulation of glycogenolysis, as well as gluconeogenesis, occur early in the course of evolution of diabetes mellitus. In contrast, suppression of glycogenolysis was normal in the subjects with IFG/NGT, implying that either IFG/NGT is an earlier stage of what subsequently becomes a more marked abnormality in glucose tolerance or that the pathogenic mechanism(s) that causes abnormal regulation of hepatic glucose metabolism differs from that of subjects who have both IFG and IGT.
We therefore conclude that impaired suppression of both gluconeogenesis and glycogenolysis contributes to hepatic insulin resistance in people with IFG/IGT, suggesting that alteration(s) in the regulation of these pathways occurs early in the evolution of diabetes mellitus.
Supplementary Material
Acknowledgments
We thank P. Reich and Betty Dicke (Mayo Clinic) for technical assistance, B. McConahey (Mayo Clinic) for assistance with graphics, and Barbara Norby, RN (Mayo Clinic), and the staff of the Mayo Clinical Research Unit and Center for Clinical and Translation Science Activities for assistance with the studies.
This work was supported by the US Public Health Service (Grants DK29953 and DK50456), the Mayo Clinic, and the National Center for Advancing Translational Science, a component of the National Institutes of Health (NIH) (CTSA Grant UL1 TR000135). Its contents are solely the responsibility of the authors and do not necessarily represent the official view of NIH. The NMR spectrometers are part of the National NMR Network and were purchased in the framework of the Portuguese National Programme for Scientific Re-equipment (Contract REDE/1517/RMN/2005), with funds from POCI 2010 (Fondo Europeo de Desarrollo Regional) and Fundação para a Ciência e a Tecnologia.
Disclosure Summary: The authors have nothing to disclose.
Footnotes
- FFA
- free fatty acid
- HbA1c
- glycosylated hemoglobin
- IFG
- impaired fasting glucose
- IGT
- impaired glucose tolerance
- NFG
- normal fasting glucose
- NGT
- normal glucose tolerance
- NMR
- nuclear magnetic resonance
- OGTT
- oral glucose tolerance test.
References
- 1. Dinneen SF, Maldonado D, III, Leibson CL, et al. Effects of changing diagnostic criteria on the risk of developing diabetes. Diabetes Care. 1998;21:1408–1413 [DOI] [PubMed] [Google Scholar]
- 2. Meigs JB, Muller DC, Nathan DM, Blake DR, Andres R. The natural history of progression from normal glucose tolerance to type 2 diabetes in the Baltimore longitudinal study of aging. Diabetes. 2003;52:1475–1484 [DOI] [PubMed] [Google Scholar]
- 3. Saad MF, Knowler WC, Pettitt DJ, Nelson FG, Mott DM, Bennett PH. The natural history of impaired glucose tolerance in the Pima Indians. N Engl J Med. 1988;319:1500–1506 [DOI] [PubMed] [Google Scholar]
- 4. Hanefeld M, Koehler C, Fuecker K, Henkel E, Schaper F, Temelkova-Kurktschiev T. Insulin secretion and insulin sensitivity pattern is different in isolated impaired glucose tolerance and impaired fasting glucose. Diabetes Care. 2003;26:868–874 [DOI] [PubMed] [Google Scholar]
- 5. Bock G, Dalla Man C, Campioni M, et al. Pathogenesis of prediabetes: mechanisms of fasting and postprandial hyperglycemia in people with impaired fasting glucose and/or impaired glucose tolerance. Diabetes. 2006;55:3536–3549 [DOI] [PubMed] [Google Scholar]
- 6. Meyer C, Pimenta W, Woerle HJ, et al. Different mechanisms for impaired fasting glucose and impaired postprandial glucose tolerance in humans. Diabetes Care. 2006;29:1909–1914 [DOI] [PubMed] [Google Scholar]
- 7. Tripathy D, Carlsson M, Almgren P, et al. Insulin secretion and insulin sensitivity in relation to glucose tolerance: lessons from the Botnia Study. Diabetes. 2000;49:975–980 [DOI] [PubMed] [Google Scholar]
- 8. Jensen CC, Cnop M, Hull RL, Fujimoto WY, Kahn SE, American Diabetes Association GENNID Study Group β-Cell function is a major contributor to oral glucose tolerance in high-risk relatives of four ethnic groups in the U.S. Diabetes. 2002;51:2170–2178 [DOI] [PubMed] [Google Scholar]
- 9. Ferrannini E, Gastaldelli A, Miyazaki Y, et al. Predominant role of reduced β-cell sensitivity to glucose over insulin resistance in impaired glucose tolerance. Diabetologia. 2003;46:1211–1219 [DOI] [PubMed] [Google Scholar]
- 10. Utzschneider KM, Prigeon RL, Carr DB, et al. Impact of differences in fasting glucose and glucose tolerance on the hyperbolic relationship between insulin sensitivity and insulin responses. Diabetes Care. 2006;29:356–362 [DOI] [PubMed] [Google Scholar]
- 11. Perreault L, Bergman BC, Playdon MC, Dalla Man C, Cobelli C, Eckel RH. Impaired fasting glucose with or without impaired glucose tolerance: progressive or parallel states of prediabetes? Am J Physiol Endocrinol Metab. 2008;295:E428–E435 [DOI] [PMC free article] [PubMed] [Google Scholar]
- 12. Weyer C, Bogardus C, Pratley RE. Metabolic characteristics of individuals with impaired fasting glucose and/or impaired glucose tolerance. Diabetes. 1999;48:2197–2203 [DOI] [PubMed] [Google Scholar]
- 13. Bock G, Chittilapilly E, Basu R, et al. Contribution of hepatic and extrahepatic insulin resistance to the pathogenesis of impaired fasting glucose: role of increased rates of gluconeogenesis. Diabetes. 2007;56:1703–1711 [DOI] [PubMed] [Google Scholar]
- 14. Basu R, Barosa C, Basu A, et al. Transaldolase exchange and its effects on measurements of gluconeogenesis in humans. Am J Physiol Endocrinol Metab. 2011;300:E296–E303 [DOI] [PMC free article] [PubMed] [Google Scholar]
- 15. Basu R, Schwenk F, Rizza RA. Both fasting glucose production and disappearance are abnormal in people with “mild” and “severe” type 2 diabetes. Am J Physiol Endocrinol Metab. 2004;287:E55–E62 [DOI] [PubMed] [Google Scholar]
- 16. Basu R, Di Camillo B, Toffolo G, et al. Use of a novel triple-tracer approach to assess postprandial glucose metabolism. Am J Physiol Endocrinol Metab. 2003;284:E55–E69 [DOI] [PubMed] [Google Scholar]
- 17. Basu A, Basu R, Shah P, et al. Type 2 diabetes impairs splanchnic uptake of glucose but does not alter intestinal glucose absorption during enteral glucose feeding: additional evidence for a defect in hepatic glucokinase activity. Diabetes. 2001;50:1351–1362 [DOI] [PubMed] [Google Scholar]
- 18. Rizza RA, Mandarino LJ, Gerich JE. Dose-response characteristics for effects of insulin on production and utilization of glucose in man. Am J Physiol. 1981;240:E630–E639 [DOI] [PubMed] [Google Scholar]
- 19. Jones JG, Barosa C, Gomes F, et al. NMR derivatives for quantification of 2H and 13C-enrichment of human glucuronide from metabolic tracers. J Carbohydr Chem. 2006;25:203–217 [Google Scholar]
- 20. Jones JG, Fagulha A, Barosa C, et al. Noninvasive analysis of hepatic glycogen kinetics before and after breakfast with deuterated water and acetaminophen. Diabetes. 2006;55:2294–2300 [DOI] [PubMed] [Google Scholar]
- 21. Steele J, Wall JS, DeBodo RC, Altszuler N, Kiang SP, Bjerkins C. Measurement of size or turnover rate of body glucose pool by the isotopic dilution method. Am J Physiol. 1965;187:15–24 [DOI] [PubMed] [Google Scholar]
- 22. Basu R, Chandramouli V, Dicke B, Landau B, Rizza R. Obesity and type 2 diabetes impair insulin-induced suppression of glycogenolysis as well as gluconeogenesis. Diabetes. 2005;54:1942–1948 [DOI] [PubMed] [Google Scholar]
- 23. Bock G, Schumann WC, Basu R, et al. Evidence that processes other than gluconeogenesis may influence the ratio of deuterium on the fifth and third carbons of glucose: implications for the use of 2H2O to measure gluconeogenesis in humans. Diabetes. 2008;57:50–55 [DOI] [PubMed] [Google Scholar]
- 24. Basu R, Chandramouli V, Schumann W, Basu A, Landau BR, Rizza RA. Additional evidence that transaldolase exchange, isotope discrimination during the triose-isomerase reaction, or both occur in humans: effects of type 2 diabetes. Diabetes. 2009;58:1539–1543 [DOI] [PMC free article] [PubMed] [Google Scholar]
- 25. Ramnanan CJ, Edgerton DS, Rivera N, et al. Molecular characterization of insulin-mediated suppression of hepatic glucose production in vivo. Diabetes. 2010;59:1302–1311 [DOI] [PMC free article] [PubMed] [Google Scholar]
Associated Data
This section collects any data citations, data availability statements, or supplementary materials included in this article.