Abstract
Meiotic recombination creates genetic diversity and ensures segregation of homologous chromosomes. Previous population analyses yielded results averaged among individuals and impacted by evolutionary pressures. Here we sequenced 99 sperm from an Asian male using the newly developed amplification method—Multiple Annealing and Looping-Based Amplification Cycles (MALBAC)—to phase the personal genome and map at high resolution recombination events, which are non-uniformly distributed across the genome in the absence of selection pressure. The paucity of recombination near transcription start sites observed in individual sperm indicates such a phenomenon is intrinsic to the molecular mechanism of meiosis. Interestingly, a decreased crossover frequency in companion with an increase of autosomal aneuploidy is observable on a global per-sperm basis.
Meiosis plays a crucial role in generating haploid gametes for sexual reproduction. In most organisms, the presence of crossovers between homologous chromosomes, in combination with connections between sister chromatids, creates a physical connection that ensures regular segregation of homologues at the first of the two meiotic divisions (1). Abnormality in generating crossovers is the leading cause of miscarriage and birth defects (2). Crossovers also create new combinations of alleles, thus contributing to genetic diversity and evolution (3).
Recent linkage disequilibrium (LD) and pedigree studies showed that the distribution of recombination is highly uneven across the human genome (4, 5), as in all studied organisms. Substantial recombination active regions are not conserved between humans and chimpanzees (6–8) or among different human populations (9, 10), suggesting these regions are quickly evolving and might even be individual-specific (11). However, such variation in the human population would be masked by the population average, and resolution of this variation would require comparison of recombination genome-wide among many single genomes.
Whole genome amplification (WGA) of single sperm cells was proposed decades ago to facilitate mapping recombination at the individual level (12). With the development of high throughput genotyping technologies (13, 14), whole-genome mapping of recombination events in single gametes of an individual is achievable and was recently demonstrated by performing WGA by Multiple Displacement Amplification (MDA) (15) on single sperm cells followed by genotyping using DNA microarrays (16). However, thus far, due to the amplification bias and thus insufficient marker density, the resolution of crossover locations has been limited to ~150kb. In addition, this recent work (16) relied on prior knowledge of the chromosome-level haplotype information of the analyzed individual, which is experimentally difficult to obtain and is currently available for only a few individuals (17–19).
Here we demonstrate a more general approach of studying recombination in single sperm cells of an individual, without prior knowledge of the haplotype information. Single sperm cells were isolated from a normal Asian male donor at his late 40s. The donor has healthy offspring of both genders and normal clinical semen analysis results. We performed WGA on single cells using the recently developed method Multiple Annealing and Looping Based Amplification Cycles (MALBAC) (20). MALBAC provides significantly improved amplification evenness compared with the prevailing WGA methods, such as MDA. We sequenced 93 sperm at ~1x genome depth and 6 sperm at ~5x depth, achieving genome coverages of ~23% and ~43% respectively (Table S1). 3 of the 99 sperm samples were found to contain more than one haploid cell and were filtered out in downstream analysis (Fig. S1). ~89% of the sequencing reads from single sperm can be aligned to the human genome, in agreement with that of a typical human resequencing project.
We further sequenced the diploid genome of the donor at ~70x depth and identified ~2.8 million single nucleotide polymorphisms (SNPs). About 1.4 million of them are heterozygous (hetSNPs) (SOM, Table S2). Among the hetSNP sites, ~500k (35%) and ~300k (20%) could be genotyped with >99% accuracy (Phred quality score >20) threshold for the high coverage (5x) and low coverage (1x) sperm cells, respectively (Table S3).
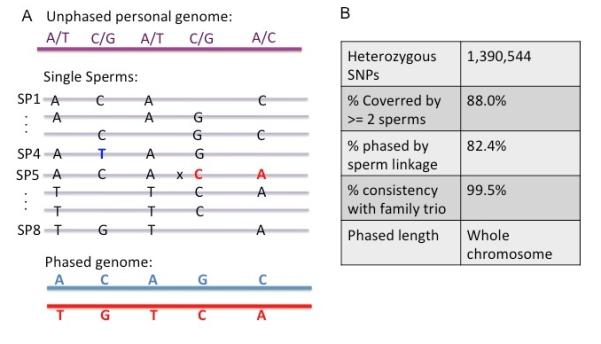
Phase information is crucial for the correct description and interpretation of the human genome (21) and is essential for mapping crossovers. We phased the hetSNPs into chromosome-level haplotypes by comparing the SNP linkage information across all sperm (SOM, Fig 1A). Since crossovers (such as the A-C link in SP5) and false SNP identification (such as the highlighted T in SP4) are low probability events, most SNP linkage information identified in a sperm reflects the true SNP linkage in the somatic genome. These SNP linkages were calculated statistically by comparing across all sperm cells. In so doing, we were able to phase ~1.1M (~82%) hetSNPs with high confidence into two sets of chromosome haplotypes. To verify the phasing result, we lightly sequenced the genomes from the donor’s parents (~10x each) and inferred the phase information of the donor using a pedigree approach (22) (SOM, Table S3 and S4). We obtained ~99.5% consistency between the two methods, indicating the high accuracy of our approach in phasing hetSNPs into chromosome-level haplotypes (Fig.1B, SOM, Table S4). We note that the percentage of phased hetSNPs could be further improved with higher sequencing depths from each sperm (currently only ~1x).
Figure 1.

Principle of whole genome phasing of an individual using the SNP linkage information from individual sperm cells. (A) We sequenced the diploid genome and identified five heterozygous SNPs with unknown linkage information shown in purple. Individual sperm cells were sequenced after MALBAC amplification, from which SNP linkage information in each sperm was used to infer the phase information in the diploid genome (B) Performance of whole genome phasing by SNP linkage in sperm cells.
Several methods for haplotyping individual humans have been described previously (19, 23, 24). However, these methods often involved labor-intensive sample preparations and had limited haplotype block size (<1Mb). Our method enables whole genome phasing into haplotypes of complete chromosomes, without requiring cell culture and sophisticated instrumentation or devices for separating metaphase chromosomes (18, 25).
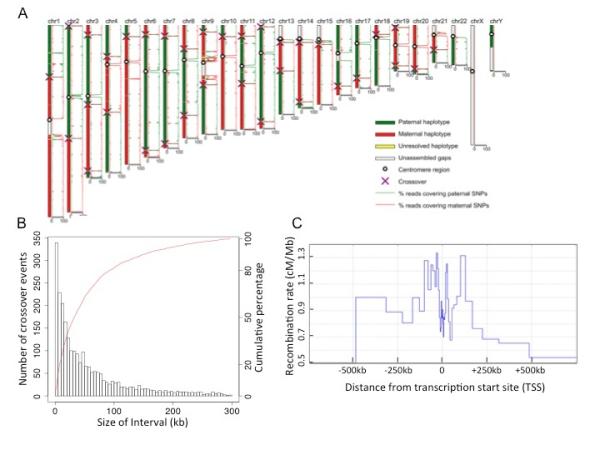
With the diploid genome phased into haplotypes of complete chromosomes, we used SNPs as markers to map the positions of crossovers in each sperm. We used a hidden Markov model to accurately determine the positions for most crossovers and manually identified the crossovers for the low confidence regions (Fig 2A, SOM). We identified 2368 autosomal crossover events in the sperm cells with a complete haploid genome. The average of ~26.0 crossovers per cell is consistent with reported pedigree studies (26, 27) The amplification evenness of MALBAC allowed us to achieve high resolution in detecting crossovers with only ~1x sequencing depth from each sperm. About 93%, 80% and 45% of the crossovers can be confidently assigned to intervals of 200 kb, 100 kb, and 30kb, respectively (Fig 2B), compared to 59%, 37% and 13% from the recently reported single sperm study (16). Of the crossovers unambiguously resolvable within a 10kb interval, ~40% are found to overlap with the male-specific recombination hotspots inferred from the deCODE project (9). Also, about 45% of these crossovers are close to the PRDM9 binding motif CCnCCnTnnCCnC, which is consistent with previous population studies (28).
Figure 2.

Identifying crossover positions in individual sperm cells (A) Parental haplotype contributions are determined by comparing the percentage of reads covering the paternal or maternal SNPs, and crossover positions are detected by identifying the crossing locations of the two parental haplotypes by a hidden Markov model. (B) Resolution of crossover determination. ~60% of the crossovers can be determined within intervals of 50kb. (C) Distribution of recombination rate relative to transcription start sites (TSS).
Recombination rates correlate positively with gene density both in yeast and human (26, 29). However, at a finer scale, recombination rates in human populations are lower very close to genes (within 20kb) and higher tens or hundreds of kilobases away from the transcription start sites (TSS) (4, 9, 27). This feature is an average of different individuals that reflects the cumulative effect of human evolutionary history, and it may also be complicated by selecting against the recombinations that compromise offspring viability. Our method detects recombination features based on single gametes, which are free of selection effects of population studies. We analyzed the crossovers resolvable within 30kb and derived the recombination rate relative to the TSS of the individual (SOM, Fig 2C). We observed lower recombination rate close to the TSS and higher rates tens of kilobase away, which is consistent with the previous population studies (4, 9, 27), indicating the reduced recombination rate close to TSS is primarily due to the variation of recombination probability during meiosis rather than due to selection.
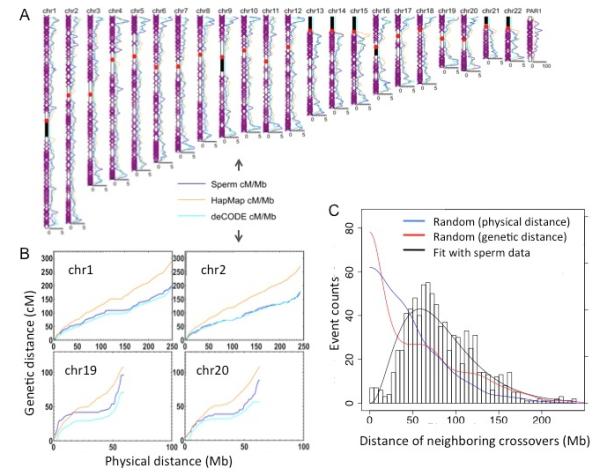
Recombination events have been shown to have a non-uniform distribution across the genome by previous population studies, which reflects the cumulative evolutionary history of recombination (5). By binning the crossover incidence into units of three megabases in autosomes, we constructed a genetic map of recombination of the individual. We compared it to a population-based sex-averaged map (HapMap) (4) and a pedigree-based male-specific map (deCODE) (9) (Fig 3A, Fig 3B) and obtained correlation coefficients of 0.71 and 0.77 respectively. In some of the bins, we observed a significant difference between HapMap and the donor (Table S6), which can be explained by sex-specific recombination variations.
Figure 3.

Genome-wide distribution of recombination (A) Comparison of the sperm recombination rates to the HapMap and deCODE (male-specific) genetic maps across the human genome. We used a 3Mb statistical window size and a 1Mb moving step. (B) A personal genetic map. Relations of physical and genetic length of selected chromosomes. (C) Distance distribution of coexisted crossovers on the same chromosome. The experimental data is fitted with gamma distribution (α=3.35), indicating a strong deviation from random distribution. In comparison, we generated random crossovers based on physical and genetic distances.
A recent study reported crossover active regions that are specific to an individual exist at a megabase scale (16). Such finding, if true, would imply extraordinary rapid evolution of human recombination, even at a large scale. Indeed, we also found 9 bins showing significant differences between the donor and deCODE (Table S7). However, we note that most of these regions are very close to the centromere or the ends of the chromosomes, where the estimation of the recombination rates was considered unreliable and excluded in deCODE (9). Therefore, we suspect these differences mainly reflect the incompleteness of the deCODE database. Our results suggest the distribution of recombination in the individual generally agrees with the population average at the megabase scale, which indicates a general consistency of large-scale recombination distribution in human evolution. With the rapid development of sequencing technologies, more sperm can be analyzed in future from different individuals to look into fine-scale recombination differences. We estimated that at least 1,000 sperm are required to identify personal recombination differences with statistical significance (SOM, Fig S4).
Obtaining the genome sequence of each sperm also allowed us to examine the coexisting crossovers on the same chromosome. The adjacent crossovers exhibit longer distance than expected by random chance (Fig. 3C, Fig. S5, S6), which is consistent with the well established phenomenon of crossover interference (30, 31). Although we have higher resolution to detect crossovers than a previous study, we did not see the reported phenomenon of substantial double crossovers occurring close together (e.g. 1-5 Mb) (32), which suggests that such phenomenon is likely not general and may only exist in certain populations.
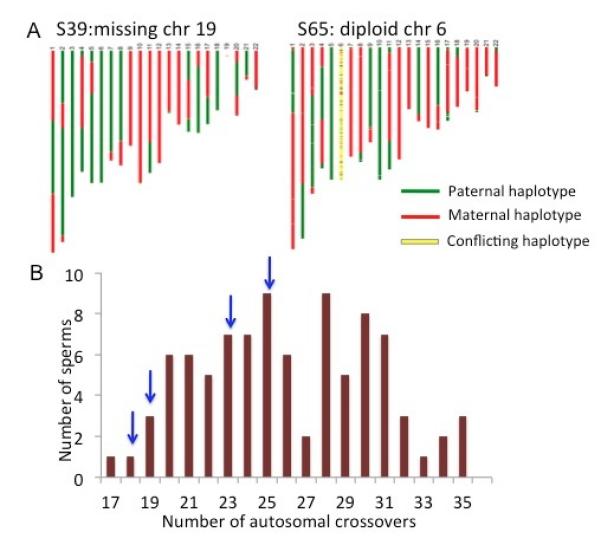
Failure to form crossovers during meiosis gives rise to chromosome segregation errors that result in aneuploidy. Autosomal aneuploidy is often lethal to embryos, with the exception of a few chromosomes that result in severe health consequences early in development (e.g. Trisomy 21, Down Syndrome). Reduced recombination activity is often found to associate with male infertility and sperm aneuploidy (33). By comparing the coverage depth and SNPs along the genome of the sperm cells, we detected four cells either missing or having additional autosomes (Fig 4A, SOM Fig S2). The rate of chromosome mis-segregation is consistent with the reported imaging studies on selected loci of human spermatocytes (34, 35).
Figure 4.

Detecting aneuploidy and crossover in the same sperm. (A) Two of the four sperm cells that exhibit autosomal abnormality. Few reads are mapped to chr19 in S39, indicating a loss of chr19. Both parental haplotypes are found in chr6 of S65, indicating a disomy chr6 in the sperm. The detailed coverage analysis on all four aneuploid sperms is shown in Fig S2. (B) Distribution of the autosomal crossover number. Blue arrows indicate the number of crossover in sperm cells with autosomal aneuploidy.
We next compared the crossover number of the aneuploid sperm to the normal sperm. Interestingly, sperm cells with aneuploid autosomes exhibit significantly fewer crossovers than normal cells on average (p=0.01). Our result suggests that autosomal segregation errors are not generated randomly during spermatogenesis. Instead, the error rate is higher in the spermatocytes with relatively repressed crossover activity. However, such a trend does not seem to be significant for sex chromosome aneuploidy, as we observed a sperm with 30 autosomal crossovers but no sex chromosome. Indeed, the crossover probability in the pseudoautosomal region of the sex chromosomes has no noticeable correlation with that of the autosomes (SOM, Table S8, S9), suggesting a different mechanism of crossover generation for autosomes and sex chromosomes, which is consistent with an earlier study in mice (36). We were unable to determine whether the chromosomes exhibiting aneuploidy underwent recombination, as recombination events are only observable when a single copy is present. MALBAC allows direct examination of meiotic crossovers and chromosome segregation errors on a per-meiotic-nucleus basis at high resolution, enabling further applications in studying genome instability and male infertility.
Supplementary Material
Acknowledgement
This work was supported by United States National Institutes of Health National Human Genome Research Institute Grant (HG005097-1 and HG005613-01) to X.S.X, and by funding from Peking University to Biodynamic Optical Imaging Center (BIOPIC). The computing was carried out at National Supercomputer Center in Tianjin, China, and the calculations were performed on TianHe-1. We thank Nancy Kleckner and Jinfu Zhang for critical comments on the manuscript. The sequencing data has been deposited in NCBI, the accession number is SRA060945.
References
- 1.Petronczki M, Siomos MF, Nasmyth K. Un Ménage à Quatre: The Molecular Biology of Chromosome Segregation in Meiosis. Cell. 2003;112:423–440. doi: 10.1016/s0092-8674(03)00083-7. [DOI] [PubMed] [Google Scholar]
- 2.Epstein CJ. The consequences of chromosome imbalance: principles, mechanisms, and models. Cambridge Univ Pr; 2007. [Google Scholar]
- 3.Jeffreys AJ, May CA. Intense and highly localized gene conversion activity in human meiotic crossover hot spots. Nature Genetics. 2004;36:151–156. doi: 10.1038/ng1287. [DOI] [PubMed] [Google Scholar]
- 4.Myers S, Bottolo L, Freeman C, McVean G, Donnelly P. A Fine-Scale Map of Recombination Rates and Hotspots Across the Human Genome. Science. 2005;310:321–324. doi: 10.1126/science.1117196. [DOI] [PubMed] [Google Scholar]
- 5.Paigen K, Petkov P. Mammalian recombination hot spots: properties, control and evolution. Nature Reviews Genetics. 2010;11:221–233. doi: 10.1038/nrg2712. [DOI] [PMC free article] [PubMed] [Google Scholar]
- 6.Winckler W, et al. Comparison of Fine-Scale Recombination Rates in Humans and Chimpanzees. Science. 2005;308:107–111. doi: 10.1126/science.1105322. [DOI] [PubMed] [Google Scholar]
- 7.Ptak SE, et al. Fine-scale recombination patterns differ between chimpanzees and humans. Nature Genetics. 2005;37:429–434. doi: 10.1038/ng1529. [DOI] [PubMed] [Google Scholar]
- 8.Auton A, et al. A Fine-Scale Chimpanzee Genetic Map from Population Sequencing. Science. 2012;336:193–198. doi: 10.1126/science.1216872. [DOI] [PMC free article] [PubMed] [Google Scholar]
- 9.Kong A, et al. Fine-scale recombination rate differences between sexes, populations and individuals. Nature. 2010;467:1099–1103. doi: 10.1038/nature09525. [DOI] [PubMed] [Google Scholar]
- 10.Hinch AG, et al. The landscape of recombination in African Americans. Nature. 2011;476:170–175. doi: 10.1038/nature10336. [DOI] [PMC free article] [PubMed] [Google Scholar]
- 11.Jeffreys AJ, Neumann R. Reciprocal crossover asymmetry and meiotic drive in a human recombination hot spot. Nat. Genet. 2002;31:267–271. doi: 10.1038/ng910. [DOI] [PubMed] [Google Scholar]
- 12.Zhang L, et al. Whole genome amplification from a single cell: implications for genetic analysis. PNAS. 1992;89:5847–5851. doi: 10.1073/pnas.89.13.5847. [DOI] [PMC free article] [PubMed] [Google Scholar]
- 13.Lockhart DJ, Winzeler EA. Genomics, gene expression and DNA arrays. Nature. 2000;405:827–836. doi: 10.1038/35015701. [DOI] [PubMed] [Google Scholar]
- 14.Metzker ML. Sequencing technologies — the next generation. Nature Reviews Genetics. 2010;11:31–46. doi: 10.1038/nrg2626. [DOI] [PubMed] [Google Scholar]
- 15.Dean FB, et al. Comprehensive human genome amplification using multiple displacement amplification. PNAS. 2002;99:5261–5266. doi: 10.1073/pnas.082089499. [DOI] [PMC free article] [PubMed] [Google Scholar]
- 16.Wang J, Fan HC, Behr B, Quake SR. Genome-wide Single-Cell Analysis of Recombination Activity and De Novo Mutation Rates in Human Sperm. Cell. 2012;150:402–412. doi: 10.1016/j.cell.2012.06.030. [DOI] [PMC free article] [PubMed] [Google Scholar]
- 17.Levy S, et al. The diploid genome sequence of an individual human. PLoS Biol. 2007;5:e254. doi: 10.1371/journal.pbio.0050254. [DOI] [PMC free article] [PubMed] [Google Scholar]
- 18.Fan HC, Wang J, Potanina A, Quake SR. Whole-genome molecular haplotyping of single cells. Nature Biotechnology. 2011;29:51–57. doi: 10.1038/nbt.1739. [DOI] [PMC free article] [PubMed] [Google Scholar]
- 19.Peters BA, et al. Accurate whole-genome sequencing and haplotyping from 10 to 20 human cells. Nature. 2012;487:190–195. doi: 10.1038/nature11236. [DOI] [PMC free article] [PubMed] [Google Scholar]
- 20.Zong C, Lu S, Chapman AR, Xie XS. Genome-wide detection of single nucleotide and copy number variations of a single human. Science. 2012 doi: 10.1126/science.1229164. in press. [DOI] [PMC free article] [PubMed] [Google Scholar]
- 21.Tewhey R, Bansal V, Torkamani A, Topol EJ, Schork NJ. The importance of phase information for human genomics. Nature Reviews Genetics. 2011;12:215–223. doi: 10.1038/nrg2950. [DOI] [PMC free article] [PubMed] [Google Scholar]
- 22.Browning SR, Browning BL. Haplotype phasing: existing methods and new developments. Nature Reviews Genetics. 2011;12:703–714. doi: 10.1038/nrg3054. [DOI] [PMC free article] [PubMed] [Google Scholar]
- 23.Kitzman JO, et al. Haplotype-resolved genome sequencing of a Gujarati Indian individual. Nat. Biotechnol. 2011;29:59–63. doi: 10.1038/nbt.1740. [DOI] [PMC free article] [PubMed] [Google Scholar]
- 24.Suk E-K, et al. A comprehensively molecular haplotype-resolved genome of a European individual. Genome Res. 2011;21:1672–1685. doi: 10.1101/gr.125047.111. [DOI] [PMC free article] [PubMed] [Google Scholar]
- 25.Ma L, et al. Direct determination of molecular haplotypes by chromosome microdissection. Nature Methods. 2010;7:299–301. doi: 10.1038/nmeth.1443. [DOI] [PMC free article] [PubMed] [Google Scholar]
- 26.Kong A, et al. A high-resolution recombination map of the human genome. Nat. Genet. 2002;31:241–247. doi: 10.1038/ng917. [DOI] [PubMed] [Google Scholar]
- 27.Coop G, Wen X, Ober C, Pritchard JK, Przeworski M. High-Resolution Mapping of Crossovers Reveals Extensive Variation in Fine-Scale Recombination Patterns Among Humans. Science. 2008;319:1395–1398. doi: 10.1126/science.1151851. [DOI] [PubMed] [Google Scholar]
- 28.Myers S, Freeman C, Auton A, Donnelly P, McVean G. A common sequence motif associated with recombination hot spots and genome instability in humans. Nature Genetics. 2008;40:1124–1129. doi: 10.1038/ng.213. [DOI] [PubMed] [Google Scholar]
- 29.Petes TD. Meiotic recombination hot spots and cold spots. Nature Reviews Genetics. 2001;2:360–369. doi: 10.1038/35072078. [DOI] [PubMed] [Google Scholar]
- 30.Kleckner N, et al. A mechanical basis for chromosome function. PNAS. 2004;101:12592–12597. doi: 10.1073/pnas.0402724101. [DOI] [PMC free article] [PubMed] [Google Scholar]
- 31.Handel MA, Schimenti JC. Genetics of mammalian meiosis: regulation, dynamics and impact on fertility. Nature Reviews Genetics. 2010;11:124–136. doi: 10.1038/nrg2723. [DOI] [PubMed] [Google Scholar]
- 32.Fledel-Alon A, et al. Broad-Scale Recombination Patterns Underlying Proper Disjunction in Humans. PLoS Genet. 2009;5:e1000658. doi: 10.1371/journal.pgen.1000658. [DOI] [PMC free article] [PubMed] [Google Scholar]
- 33.Ferguson KA, Wong EC, Chow V, Nigro M, Ma S. Abnormal meiotic recombination in infertile men and its association with sperm aneuploidy. Hum. Mol. Genet. 2007;16:2870–2879. doi: 10.1093/hmg/ddm246. [DOI] [PubMed] [Google Scholar]
- 34.Spriggs EL, Rademaker AW, Martin RH. Aneuploidy in human sperm: results of two-and three-color fluorescence in situ hybridization using centromeric probes for chromosomes 1, 12, 15, 18, X, and Y. Cytogenet. Cell Genet. 1995;71:47–53. doi: 10.1159/000134060. [DOI] [PubMed] [Google Scholar]
- 35.Downie SE, Flaherty SP, Swann NJ, Matthews CD. Estimation of Aneuploidy for Chromosomes 3, 7, 16, X and Y in Spermatozoa from 10 Normospermic Men Using Fluorescence in-Situ Hybridization. Mol. Hum. Reprod. 1997;3:815–819. doi: 10.1093/molehr/3.9.815. [DOI] [PubMed] [Google Scholar]
- 36.Kauppi L, et al. Distinct Properties of the XY Pseudoautosomal Region Crucial for Male Meiosis. Science. 2011;331:916–920. doi: 10.1126/science.1195774. [DOI] [PMC free article] [PubMed] [Google Scholar]
Associated Data
This section collects any data citations, data availability statements, or supplementary materials included in this article.


